


 |
市場調查報告書
商品編碼
2123799
電動商用車:市場佔有率分析、產業趨勢與統計、成長預測(2026-2031)Electric Commercial Vehicle - Market Share Analysis, Industry Trends & Statistics, Growth Forecasts (2026 - 2031) |
||||||

※ 本網頁內容可能與最新版本有所差異。詳細情況請與我們聯繫。
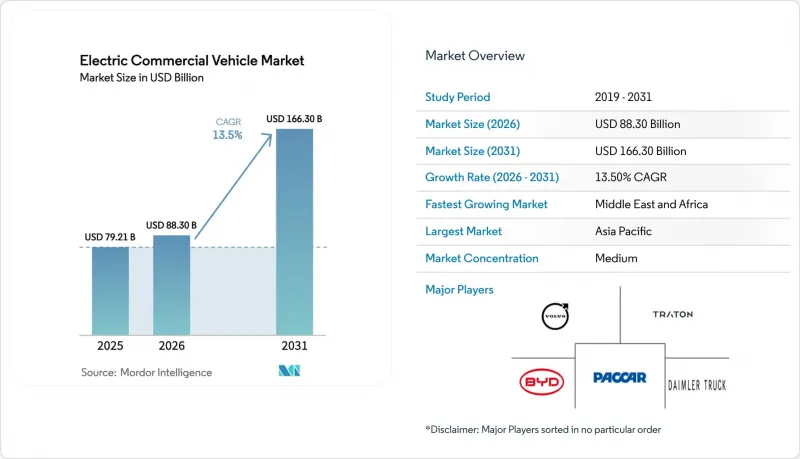
根據 Mordor Intelligence 預測,電動商用車市場預計將從 2025 年的 792.1 億美元成長到 2026 年的 883 億美元,到 2031 年達到 1,663 億美元,2026 年至 2031 年的複合年成長率預計為 13.5%。
本報告按車輛類型(巴士、卡車等)、驅動方式(電池式電動車、混合動力電動車等)、功率輸出(小於150千瓦、150-250千瓦、其他)、電池容量(小於100千瓦、100-200千瓦、其他)、續航里程、用戶產業、充電方式和地區終端進行細分。市場預測以價值(美元)和銷售(輛)為單位呈現。
全球電動商用車市場趨勢與洞察
電池成本迅速下降,目前已低於每千瓦時 100 美元,這正在降低總擁有成本的損益平衡點。
2025年初,磷酸鋰鐵鋰電池價格達到一個重要里程碑,超過了長途卡車總擁有成本(TCO)的損益平衡點。寧德時代(CATL)最新一代電池擁有更高的能量密度和成本效益,可在不超出軸重限制的情況下延長續航里程。考慮到燃油和維護成本的降低,戴姆勒卡車的eCascadia車型在加州本地路線上展現出比柴油車顯著的成本優勢。反映市場動態,帕卡集團(PACCAR)報告稱,其2025年的大部分訂單是在不依賴補貼的情況下獲得的,這凸顯了這些技術的經濟可行性日益增強。預計未來幾年成本將進一步降低,在大多數營運情境下,可能不再需要購置獎勵。
政府資助購買零排放車輛
歐盟委員會修訂後的重型車輛二氧化碳排放標準規定,到2030年減排45%,到2040年減排90%,這實際上終止了中型柴油車的上市。中國的雙積分制度獎勵超標排放,比亞迪預計其2025年國內商用車銷售量的很大一部分將來自這項獎勵計畫。印度的FAME-III計畫為電動公車和充電基礎設施投入大量資金,特別關注德里、孟買和班加羅爾。這些計畫正在加速批量採購,加快技術學習曲線,並加強供應鏈,而這些速度僅靠自發性需求成長是無法實現的。
高速公路貨運走廊商業快速充電樁的網路限制
在美國,超過350千瓦的大型直流充電運作數量有限,無法滿足運輸走廊的需求。在歐洲,電網連接等待時間過長,導致安裝地點的電力供應延遲,迫使車隊選擇本地路線。 Electrify Americas指出,大量規劃中的卡車充電站需要升級變電站,而每次升級將運作。同時,印度國家公路管理局僅啟用了其規劃卡車充電站的一小部分,全面投入營運目前仍處於延遲狀態。在兆瓦級充電樁普及之前,這些電網瓶頸阻礙了長途純電動卡車的廣泛應用。
細分市場分析
預計到2025年,公車將佔總銷售量的54.12%。這反映了公車採購週期長,以及政府補貼支持在城市交通系統中部署整支車隊,表明電動商用車市場是以公車為基礎的。同時,受電商巨頭推動末端配送和跨區域配送路線電氣化的影響,預計到2031年,卡車將以17.15%的複合年成長率成長。近年來,比亞迪已在全球範圍內交付了大量電動公車,其中大部分因空氣品質法規的要求而分配給了中國的地方政府。另一方面,福特的「E-Transit」廂型車在北美的銷量也實現了顯著成長。雖然負載容量的限制阻礙了電池式電動車在長途重型卡車領域的應用,但預計近距離區域運輸領域將在短期內出現成長。受益於可保持有效載荷能力的模組化電池組的廂型車已成為小包裹遞送公司不可或缺的工具。近年來,DHL 的「Streetscooter」車隊規模顯著擴大。
在新興市場,由於地方政府持續的資金支持,公車仍保持市場主導地位。但物流車輛的更新周期通常為4-6年,預計從2028年起,卡車的年銷售量將超過公車。 UPS、亞馬遜和京東物流等車隊營運商正在為輕型電動底盤打造次市場,使供應商不再局限於傳統的以公車為中心的OEM製造商。同時,廢棄物管理部門和公共產業也開始採用專用電動底盤來應對頻繁的啟停作業,進一步擴大了對卡車的需求。隨著供應鏈的成熟和底盤通用性的提高,卡車有望成為電動商用車市場銷售的主要驅動力,尤其是在高利用率的小包裹遞送和市政服務路線上。
到2025年,在成熟的供應鏈和電池價格大幅下降的支撐下,純電動動力傳動系統將佔據82.36%的市場佔有率,在電動商用車市場確立明顯的技術優勢。然而,燃料電池電動車預計到2031年將維持25.01%的複合年成長率,其目標應用場景是大型車輛,因為電池重量會影響負載容量的經濟性。現代汽車的「XCIENT」卡車已累積行駛超過500萬公里,這為氫能在長途運輸中的應用提供了有力支撐。美國氫能中心計劃在2028年為加州港口部署1000輛燃料電池卡車,顯示公共部門對氫能發展路徑充滿信心。插電式混合動力汽車正在續航里程有限的地區應用,Volvo的插電式混合動力FH車型在2024年僅佔該公司歐洲電動車銷量的一小部分。
在都市區和農村地區,由於電池驅動電動車具有成本優勢,且充電站的便利充電和低廉的能源價格使其成本得以維持,因此它們仍將佔據主導地位。燃料電池的廣泛應用取決於氫氣成本的競爭力,而隨著可再生能源電解的擴展,預計未來幾年氫氣成本競爭力將得以提升。隨著監管機構實施更嚴格的零排放標準,混合動力汽車汽車和非插電式混合動力汽車的銷售量預計將會下降。隨著動力系統格局的改變,電池預計將在都市區道路上佔據主導地位。同時,氫氣預計將用於更重型、長途的貨運,從而擴大電動商用車的市場。
到2025年,輸出範圍將佔交付的46.25%,這與用於區域配送的6-7級卡車的需求量基本一致。預計到2031年,功率超過250千瓦的動力總成系統將以15.23%的複合年成長率成長,這主要得益於戴姆勒的eActros 600和特斯拉的Semi,這兩款車型都解決了主要貨運路線上的續航里程問題。功率低於150千瓦的系統則廣泛應用於Rivian EDV等輕型貨車,低功率帶來了經濟性和更高的效率。
高功率系統需要800伏特架構,這會使組件成本增加15-20%,但可實現1兆瓦的充電功率,這對8級牽引車至關重要。隨著兆瓦級基礎設施在5號州際公路、95號州際公路和歐洲的泛歐交通運輸網路(TEN-T)走廊沿線的普及,高功率系統將在電動商用車市場佔據更大的佔有率。中功率系統仍將在市政和區域車隊中佔據主導地位,因為這些車隊只需在車庫進行夜間充電即可。
區域分析
預計到2025年,亞太地區將佔全球銷售量的62.18%。這主要得益於中國新增城市公車訂單中電動公車佔有率的顯著成長,以及印度對公車和貨車的FAME-III補貼。日本五十鈴和三菱扶桑交付了多輛電動卡車,主要目標市場是東京和大阪的低排放氣體區。韓國出口了其「XCIENT」燃料電池卡車,進一步提升了其國內氫能技術能力。該地區受益於集中採購系統、高密度都市化以及改善空氣品質的需求,這些因素都有助於加快公共汽車的推廣部署。
預計中東和非洲地區將經歷最快的成長,到2031年複合年成長率將達到14.18%。沙烏地阿拉伯公共投資基金(PIF)在其「2030願景」下,已撥款大量資金用於建造電動巴士和電動卡車工廠,目標是在未來幾年實現可觀的年產量。德班已透過非洲開發銀行獲得資金,用於引進多輛電動巴士;埃及則利用歐洲復興開發銀行(EBRD)的貸款,並計劃在2028年實現開羅大部分公車車隊的電動化。儘管國內原始設備製造商(OEM)數量有限,但在一個雄心勃勃的脫碳計劃的市場中,政府資金和多邊金融機構的貸款為其成長提供了支持。
北美和歐洲在監管嚴格程度和基礎設施挑戰方面較為相似。加州的「先進清潔卡車」(ACT)法規要求製造商從2024款車型開始逐步提高其年度銷量中零排放車輛(ZEV)的比例,目標是到2035款車型,2b-3級卡車達到55%,4-8級直卡車達到75%,牽引車達到40%。加拿大已累計27.5億加元(約20億美元)用於2026-2027年間實現5,000輛公車的電氣化。歐洲的目標是到2030年將重型車輛的二氧化碳排放量減少45%,德國的卡車補貼以及法國和英國低排放區的擴張正在推動這一目標的實現。然而,這兩個大洲都面臨著高速公路沿線電網連接延遲的問題,減緩了這些車輛在長途運輸中的普及速度。然而,政策的確定性和購買獎勵正推動它們在 2030 年前迅速普及。
其他好處:
- Excel格式的市場預測(ME)表
- 3個月的分析師支持
目錄
第1章:引言
- 研究假設和市場定義
- 調查範圍
第2章:調查方法
第3章執行摘要
第4章 市場狀況
- 市場概覽
- 市場促進因素
- 電池成本迅速下降,目前已低於每千瓦時 100 美元,這提高了總擁有成本的損益平衡點。
- 政府出資強制推廣零排放車輛
- 都市區最後一公里配送車輛的激增是由電子商務推動的。
- 對氫能中心的投資正在加速燃料電池卡車的普及。
- 一個多邊組織的專門為電動巴士資金籌措的項目
- 地方政府的噪音管制條例鼓勵夜間引進電子貨運。
- 市場限制因素
- 高速公路貨運走廊商業快速充電樁面臨的電網限制
- 大容量電池組對長距離負載容量的影響
- 二手電動卡車殘值基準有限
- 新興市場高壓驅動系統熟練技術人員短缺
- 供應鏈分析
- 監管和技術展望
- 波特五力模型
- 在全部區域發展電動車充電基礎設施
第5章 市場規模與成長預測
- 車輛類型
- 公車
- 追蹤
- 皮卡車
- 範
- 透過推進力
- 電池式電動車(BEV)
- 混合動力電動車(HEV)
- 插電式混合動力車(PHEV)
- 燃料電池汽車(FCEV)
- 依輸出類型
- 小於150千瓦
- 150~250 kW
- 超過250千瓦
- 按電池容量
- 小於100度
- 100~200 kWh
- 超過 200 千瓦時
- 透過練習場
- 不到150英里
- 150-300英里
- 超過300英里
- 按最終用途行業分類
- 城市交通
- 物流/配送
- 廢棄物管理
- 公共產業及建築
- 透過充電方法
- 倉庫(AC)
- 自動充電/行駛中充電(直流)
- 按地區
- 北美洲
- 美國
- 加拿大
- 其他北美國家
- 南美洲
- 巴西
- 阿根廷
- 其他南美國家
- 歐洲
- 德國
- 英國
- 法國
- 義大利
- 西班牙
- 北歐的
- 其他歐洲國家
- 亞太地區
- 中國
- 印度
- 日本
- 韓國
- 其他亞太國家
- 中東和非洲
- 阿拉伯聯合大公國
- 沙烏地阿拉伯
- 土耳其
- 埃及
- 南非
- 其他中東和非洲國家
- 北美洲
第6章 競爭情勢
- 市場集中度
- 策略趨勢
- 市佔率分析
- 公司簡介
- BYD Auto Co., Ltd.
- Daimler Truck AG
- AB Volvo
- Traton SE
- Zhengzhou Yutong Bus Co., Ltd
- Ford Motor Company
- Tesla Inc.
- Proterra Inc.
- Rivian Automotive Inc.
- Tata Motors Limited
- Olectra Greentech Limited
- PACCAR Inc.
- Nikola Corporation
- NFI Group Inc.(New Flyer)
- Hyundai Motor Company
- Isuzu Motors Limited
- Mitsubishi Fuso Truck & Bus Corporation
第7章 市場機會與未來展望
According to Mordor Intelligence, the electric commercial vehicle market size is expected to increase from USD 79.21 billion in 2025 to USD 88.30 billion in 2026 and reach USD 166.30 billion by 2031, growing at a CAGR of 13.5% over 2026-2031.
This report is Segmented by Vehicle Type (Bus, Trucks, and More), Propulsion (Battery Electric Vehicles, Hybrid Electric Vehicles, and More), Power Output (Less Than 150 KW, 150-250 KW, and More), Battery Capacity (Less Than 100 KWh, 100-200 KWh, and More), Range, End-Use Industry, Charging Type, and Geography. The Market Forecasts are Provided in Terms of Value (USD) and Volume (Units).
Global Electric Commercial Vehicle Market Trends and Insights
Rapid Battery-Cost Decline Below USD 100/kWh Driving TCO Breakeven
In early 2025, lithium-iron-phosphate cell prices reached a significant milestone, crossing the breakeven threshold for high-mileage trucks. CATL's latest-generation cells offer enhanced energy density and cost efficiency, enabling extended ranges without exceeding axle-weight limits. When considering fuel and maintenance savings, Daimler Trucks' eCascadia demonstrates a notable cost advantage over diesel alternatives on regional routes in California. Reflecting a shift in market dynamics, PACCAR reported that a substantial portion of its 2025 orders were placed without relying on subsidies, highlighting the growing economic feasibility of these technologies. Projections suggest further cost reductions in the coming years, potentially eliminating the need for purchase incentives across most operational scenarios.
Government-funded Zero-Emission Fleet Procurement Mandates
The European Commission's revised heavy-duty CO2 standards stipulate a 45% cut by 2030 and a 90% cut by 2040, effectively sunsetting new diesel in medium-duty classes. China's dual-credit scheme rewards over-compliance, prompting BYD to attribute a significant share of its 2025 domestic commercial sales to the incentive framework. India's FAME-III allocates substantial funding to electric buses and charging infrastructure, with a particular focus on Delhi, Mumbai, and Bengaluru. Such programs spur bulk procurement, accelerate learning curves, and tighten supply chains faster than organic demand growth alone.
Commercial-grade Fast-Charger Grid Constraints on Highway Freight Corridors
The United States operates a limited number of heavy-duty DC chargers above 350 kW, falling short of corridor requirements. In Europe, interconnection queues are significantly long, delaying site energization and pushing fleets onto regional routes. Electrify America notes that a significant portion of its planned truck sites require substation upgrades, each of which entails substantial costs. Meanwhile, India's National Highways Authority has activated only a fraction of its planned truck-charging plazas, with full commissioning now delayed. These grid bottlenecks hinder the potential for long-haul battery-electric penetration until megawatt charging becomes more prevalent.
Other drivers and restraints analyzed in the detailed report include:
- E-commerce-led Surge in Urban Last-Mile Delivery Vehicles
- Hydrogen Hub Investments Accelerating Fuel-cell Trucks
- Payload Penalties from Large Battery Packs in Long-haul Segments
For complete list of drivers and restraints, kindly check the Table Of Contents.
Segment Analysis
Buses accounted for 54.12% of 2025 revenue, reflecting long procurement cycles and public subsidies that favor fleet-wide deployment in city transit systems, giving the electric commercial vehicle market size a bus-centred foundation. Trucks, however, are growing at 17.15% CAGR through 2031 as e-commerce giants electrify last-mile and regional routes. In recent years, BYD has delivered a significant number of electric buses globally, with the majority allocated to Chinese municipalities due to air-quality mandates. Meanwhile, Ford has experienced notable growth in the sales of its E-Transit vans across North America. While payload penalties hinder the adoption of battery-electric vehicles in long-haul heavy trucks, they steer near-term growth toward regional hauls within a limited radius. Vans, benefiting from modular battery packaging that maintains cargo volume, have become essential for parcel carriers. Notably, DHL's Streetscooter fleet has expanded substantially in recent years.
Continued municipal funding sustains bus dominance in emerging markets, yet the shorter four- to six-year replacement cycles in logistics fleets position trucks to overtake buses in annual volumes after 2028. Fleet operators such as UPS, Amazon, and JD Logistics are creating a secondary market for lightweight electric chassis, expanding supplier diversity beyond traditional bus-focused OEMs. Meanwhile, waste-management authorities and utilities adopt specialized electric chassis for stop-and-go duty cycles, further broadening truck demand. As supply chains mature and chassis versatility improves, trucks are set to become the volume engine of the electric commercial vehicle market, particularly in high-utilization parcel and municipal service routes.
Battery electric powertrains captured an 82.36% share in 2025, benefiting from mature supply chains and the rapid decline in cell pricing, giving the electric commercial vehicle market a clear technology incumbent. Fuel-cell electric vehicles nonetheless post a 25.01% CAGR through 2031, targeting heavy-duty use cases where battery mass erodes payload economics. Hyundai's XCIENT trucks have clocked more than 5 million kilometers with refueling, validating the business case for hydrogen in long-haul applications. The United States hydrogen hub program earmarks 1,000 fuel-cell trucks for California ports by 2028, signaling public-sector confidence in the pathway. Plug-in hybrids serve range-constrained regions; Volvo's plug-in FH variant made up a nominal share of its European electric sales in 2024.
Battery-electric traction will remain dominant in urban and regional fleets because depot charging and low energy prices preserve its cost advantage. Fuel-cell adoption depends on achieving cost competitiveness for hydrogen, which is expected as renewable electrolysis scales in the coming years. As regulators enforce stricter zero-emission standards, hybrid and non-plug-in variants are likely to decline. In the shifting propulsion landscape, batteries are expected to dominate urban routes. At the same time, hydrogen is poised to serve heavier, long-distance freight, expanding the market for electric commercial vehicles.
The 150-250 kW band held 46.25% of 2025 deliveries, aligning with Class 6-7 trucks used for regional distribution. Greater-than-250 kW drivetrains grow at 15.23% CAGR to 2031, catalyzed by Daimler's eActros 600 and Tesla's Semi, both of which eliminate range anxiety on major freight corridors. Less-than-150 kW systems dominate light vans such as Rivian's EDV, where lower power improves affordability and efficiency.
High-power systems require 800-volt architectures that add 15-20% component cost yet enable one-megawatt charging, a critical feature for class 8 tractors. As megawatt infrastructure spreads across Interstate 5, Interstate 95, and European TEN-T corridors, high-power segments will capture a larger slice of the electric commercial vehicle market. Mid-range power will remain prevalent in municipal and regional fleets, where overnight depot charging is sufficient.
Complete Report Scope:
- By Vehicle Type
- Bus
- Trucks
- Pick-up Trucks
- Vans
- By Propulsion
- Battery Electric Vehicles (BEV)
- Hybrid Electric Vehicles (HEV)
- Plug-in Hybrid Electric Vehicles (PHEV)
- Fuel-cell Electric Vehicles (FCEV)
- By Power Output
- Less than 150 kW
- 150-250 kW
- Greater than 250 kW
- By Battery Capacity
- Less than 100 kWh
- 100-200 kWh
- Greater than 200 kWh
- By Range
- Less than 150 miles
- 150-300 miles
- More than 300 miles
- By End-use Industry
- Urban Transit
- Logistics and Delivery
- Waste Management
- Utilities and Construction
- By Charging Type
- Depot (AC)
- Opportunity / En-route (DC)
- By Geography
- North America
- United States
- Canada
- Rest of North America
- South America
- Brazil
- Argentina
- Rest of South America
- Europe
- Germany
- United Kingdom
- France
- Italy
- Spain
- Nordics
- Rest of Europe
- Asia-Pacific
- China
- India
- Japan
- South Korea
- Rest of Asia-Pacific
- Middle East and Africa
- United Arab Emirates
- Saudi Arabia
- Turkey
- Egypt
- South Africa
- Rest of Middle East and Africa
- North America
Geography Analysis
Asia-Pacific controlled 62.18% of 2025 revenue, underpinned by China's significant electric share of new urban bus orders and India's FAME-III subsidy for buses and goods carriers. Japan's Isuzu and Mitsubishi Fuso delivered several electric trucks focused on Tokyo and Osaka's low-emission zones. South Korea exported XCIENT fuel-cell trucks, sharpening domestic hydrogen expertise. The region benefits from centralized procurement, dense urbanization, and air-quality imperatives that accelerate public bus rollouts.
The Middle East and Africa region is expected to record the fastest growth, with a 14.18% CAGR by 2031. Under Vision 2030, Saudi Arabia's Public Investment Fund has allocated significant resources to establish electric bus and truck plants, aiming for substantial annual production in the coming years. Durban financed several e-buses through the African Development Bank, while Egypt aims to electrify a significant number of Cairo buses by 2028 with EBRD loans. Growth rides on sovereign capital and multilateral facilities in markets that lack domestic OEM depth but possess ambitious decarbonization agendas.
North America and Europe mirror each other in regulatory stringency and infrastructure challenges. California's Advanced Clean Trucks (ACT) regulation requires manufacturers to sell ZEVs as an increasing share of annual sales starting MY2024, reaching 55% (Class 2b-3), 75% (Class 4-8 straight trucks), and 40% (tractors) by MY2035. Canada set aside CAD 2.75 billion (~USD 2 billion) to electrify 5,000 buses by 2026-27. Europe's 45% heavy-duty CO2 cut by 2030 is reinforced by German truck subsidies and expanding low-emission zones in France and the United Kingdom. Both continents face grid connection delays along highway corridors, slowing long-haul penetration, yet policy certainty and purchase incentives keep uptake on track for a rapid climb through 2030.
- BYD Auto Co., Ltd.
- Daimler Truck AG
- AB Volvo
- Traton SE
- Zhengzhou Yutong Bus Co., Ltd
- Ford Motor Company
- Tesla Inc.
- Proterra Inc.
- Rivian Automotive Inc.
- Tata Motors Limited
- Olectra Greentech Limited
- PACCAR Inc.
- Nikola Corporation
- NFI Group Inc. (New Flyer)
- Hyundai Motor Company
- Isuzu Motors Limited
- Mitsubishi Fuso Truck & Bus Corporation
Additional Benefits:
- The market estimate (ME) sheet in Excel format
- 3 months of analyst support
TABLE OF CONTENTS
1 Introduction
- 1.1 Study Assumptions & Market Definition
- 1.2 Scope of the Study
2 Research Methodology
3 Executive Summary
4 Market Landscape
- 4.1 Market Overview
- 4.2 Market Drivers
- 4.2.1 Rapid Battery-Cost Decline Below USD 100/kWh Driving TCO Breakeven
- 4.2.2 Government-funded Zero-Emission Fleet Procurement Mandates
- 4.2.3 E-commerce-led Surge in Urban Last-Mile Delivery Vehicles
- 4.2.4 Hydrogen Hub Investments Accelerating Fuel-cell Trucks
- 4.2.5 Dedicated E-Bus Financing Programs by Multilateral Agencies
- 4.2.6 Municipal Anti-Noise Regulations Boosting Night-time e-Freight Adoption
- 4.3 Market Restraints
- 4.3.1 Commercial-grade Fast-Charger Grid Constraints on Highway Freight Corridors
- 4.3.2 Payload Penalties from Large Battery Packs in Long-haul Segments
- 4.3.3 Limited Residual-Value Benchmarking for Used e-Trucks
- 4.3.4 Scarcity of Trained Technicians for High-Voltage Drivetrains in Emerging Markets
- 4.4 Supply-Chain Analysis
- 4.5 Regulatory or Technological Outlook
- 4.6 Porter's Five Forces
- 4.6.1 Threat of New Entrants
- 4.6.2 Bargaining Power of Buyers
- 4.6.3 Bargaining Power of Suppliers
- 4.6.4 Threat of Substitutes
- 4.6.5 Intensity of Competitive Rivalry
- 4.7 Electric Vehicle Charging Infrastructure Development Across the Region
5 Market Size & Growth Forecasts (Value (USD) and Volume (Units))
- 5.1 By Vehicle Type
- 5.1.1 Bus
- 5.1.2 Trucks
- 5.1.3 Pick-up Trucks
- 5.1.4 Vans
- 5.2 By Propulsion
- 5.2.1 Battery Electric Vehicles (BEV)
- 5.2.2 Hybrid Electric Vehicles (HEV)
- 5.2.3 Plug-in Hybrid Electric Vehicles (PHEV)
- 5.2.4 Fuel-cell Electric Vehicles (FCEV)
- 5.3 By Power Output
- 5.3.1 Less than 150 kW
- 5.3.2 150-250 kW
- 5.3.3 Greater than 250 kW
- 5.4 By Battery Capacity
- 5.4.1 Less than 100 kWh
- 5.4.2 100-200 kWh
- 5.4.3 Greater than 200 kWh
- 5.5 By Range
- 5.5.1 Less than 150 miles
- 5.5.2 150-300 miles
- 5.5.3 More than 300 miles
- 5.6 By End-use Industry
- 5.6.1 Urban Transit
- 5.6.2 Logistics and Delivery
- 5.6.3 Waste Management
- 5.6.4 Utilities and Construction
- 5.7 By Charging Type
- 5.7.1 Depot (AC)
- 5.7.2 Opportunity / En-route (DC)
- 5.8 By Geography
- 5.8.1 North America
- 5.8.1.1 United States
- 5.8.1.2 Canada
- 5.8.1.3 Rest of North America
- 5.8.2 South America
- 5.8.2.1 Brazil
- 5.8.2.2 Argentina
- 5.8.2.3 Rest of South America
- 5.8.3 Europe
- 5.8.3.1 Germany
- 5.8.3.2 United Kingdom
- 5.8.3.3 France
- 5.8.3.4 Italy
- 5.8.3.5 Spain
- 5.8.3.6 Nordics
- 5.8.3.7 Rest of Europe
- 5.8.4 Asia-Pacific
- 5.8.4.1 China
- 5.8.4.2 India
- 5.8.4.3 Japan
- 5.8.4.4 South Korea
- 5.8.4.5 Rest of Asia-Pacific
- 5.8.5 Middle East and Africa
- 5.8.5.1 United Arab Emirates
- 5.8.5.2 Saudi Arabia
- 5.8.5.3 Turkey
- 5.8.5.4 Egypt
- 5.8.5.5 South Africa
- 5.8.5.6 Rest of Middle East and Africa
- 5.8.1 North America
6 Competitive Landscape
- 6.1 Market Concentration
- 6.2 Strategic Moves
- 6.3 Market Share Analysis
- 6.4 Company Profiles (Includes Global Level Overview, Market Level Overview, Core Segments, Financials as Available, Strategic Information, Market Rank/Share for Key Companies, Products and Services, SWOT Analysis, and Recent Developments)
- 6.4.1 BYD Auto Co., Ltd.
- 6.4.2 Daimler Truck AG
- 6.4.3 AB Volvo
- 6.4.4 Traton SE
- 6.4.5 Zhengzhou Yutong Bus Co., Ltd
- 6.4.6 Ford Motor Company
- 6.4.7 Tesla Inc.
- 6.4.8 Proterra Inc.
- 6.4.9 Rivian Automotive Inc.
- 6.4.10 Tata Motors Limited
- 6.4.11 Olectra Greentech Limited
- 6.4.12 PACCAR Inc.
- 6.4.13 Nikola Corporation
- 6.4.14 NFI Group Inc. (New Flyer)
- 6.4.15 Hyundai Motor Company
- 6.4.16 Isuzu Motors Limited
- 6.4.17 Mitsubishi Fuso Truck & Bus Corporation
7 Market Opportunities & Future Outlook
- 7.1 White-space & Unmet-need Assessment

 電動商用車市場-2026-2032年全球市場預測
 商用電動車市場預測至2034年-全球分析(按車輛類型、驅動系統、電池類型、電池容量、續航里程、充電方式、最終用戶和地區分類)
 全球商用電動車市場:按車輛類型、推進系統、電池類型、功率輸出、續航里程、最終用途、組件、電池容量和地區分類-預測至2033年
 工業電動車市場分析與預測(至2035年):按類型、產品、服務、技術、組件、應用、最終用戶、功能、安裝方式和解決方案分類電動商用車市場分析及預測(至2035年):類型、產品、服務、技術、組件、應用、部署、最終用戶、功能、安裝配置
 電動商用車市場規模、佔有率和趨勢分析報告:按車輛類型、推進系統、驅動系統、車速、地區和細分市場預測(2026-2033 年)
 2026-2030年全球電動商用車(ECV)市場
 2026年全球中重型商用電動車市場報告2026年全球商用電動車市場報告
 全球電動商用車MRO市場規模、佔有率、趨勢與成長分析報告(2026-2034年)