


 |
市場調查報告書
商品編碼
2123755
損壞感測型智慧標籤:市場佔有率分析、產業趨勢與統計、成長預測(2026-2031)Spoil Detection Based Smart Labels - Market Share Analysis, Industry Trends & Statistics, Growth Forecasts (2026 - 2031) |
||||||

※ 本網頁內容可能與最新版本有所差異。詳細情況請與我們聯繫。
2025 年,變質感測型智慧標籤市場價值為 11.1 億美元,預計到 2031 年將達到 20.7 億美元,而 2026 年為 12.3 億美元,預測期(2026-2031 年)複合年成長率為 10.92%。
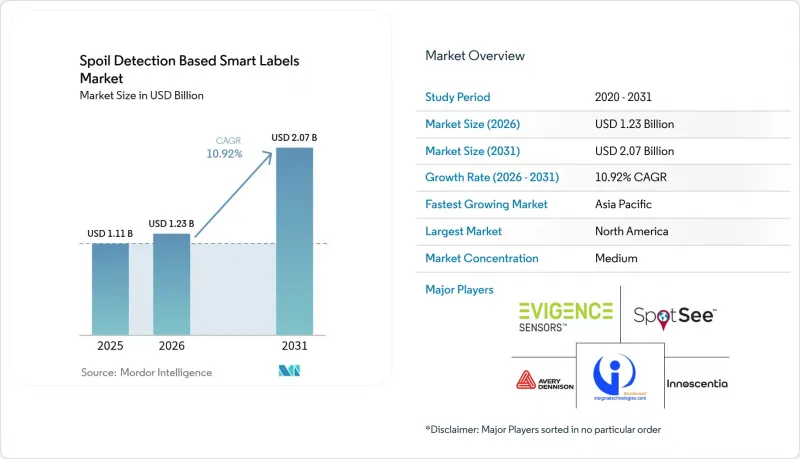
本報告按技術(RFID、NFC、感測標籤等)、終端用戶產業(食品飲料、製藥等)、包裝類型(軟包裝袋、硬質瓶罐等)、保鮮指示機制(比色化學指示劑、生物感測器指示劑等)和地區進行細分。市場預測以美元計價。
全球變質感測型智慧標籤市場趨勢及洞察
食品新鮮度即時監測的需求日益成長
食品經銷商正用可在運輸過程中檢測新鮮度的感測器取代靜態日期代碼,因為時間和溫度控制不當會導致產品在印刷日期前數天就已變質。聯合國環境規劃署 (UNEP) 的一份報告顯示,13.2% 的食物在收穫到零售之間損失,另有 19% 的食物在零售階段及之後被丟棄。這部分食物的損耗佔全球溫室氣體排放量的 8% 至 10%。沃爾瑪於 2025 年 10 月要求供應商在所有生鮮食品運輸中貼上 RFID 標籤,這使得食品浪費成為一個合規問題,迫使生產商採用能夠觸發自動庫存調整的變質檢測指標。 SpotSee 於 2025 年 1 月推出的無需電池的 WarmMark QR 感測器,擁有 ±1°C 的精度和兩年的保存期限,展現了大規模一次性感測器的全新經濟可行性。預計這一趨勢將使變質感測型智慧標籤市場受益,這既得益於監管的強制執行,也得益於私部門的成本降低。
消費者對食品安全和衛生的關注日益增加。
疫情後的消費者,尤其是免疫力族群的家長和看護者,越來越重視檢驗的新鮮度。日本和韓國的零售先導計畫正在使用支援NFC功能的標籤,這些標籤可透過智慧型手機掃描,將冷鏈數據轉化為銷售點行銷資源。能夠即時傳遞產品變質狀態的品牌可以獲得展示優勢,而那些僅依賴印刷保存期限的品牌則可能面臨聲譽受損的風險。有機農產品和草飼肉類等高價品類可以承受智慧標籤帶來的5-10倍成本成長。中國國務院頒布的冷鏈法規,對不遵守新鮮度監測規定的企業處以罰款,也推動了這一趨勢。這些因素正在推動具備變質檢測功能的智慧標籤市場在亞太地區的都市區穩步滲透。
高單價與傳統有效期限標籤的比較
智慧標籤的成本是印刷保存期限標籤的5到10倍,這會擠壓袋裝沙拉等低價商品的利潤空間。除非法規或零售商強制要求,採購部門往往會選擇更便宜的日期代碼。像Energous這樣的供應商目前正在研發無需電池的感測器設計,以降低整體擁有成本(TCO),而SpotSee則在其WarmMark QR標籤中強調可再生材料,以順應注重永續性的採購趨勢。這一價格障礙在南美和非洲尤為突出,因為這些地區的買家更重視冷藏功能而非監控功能。
細分市場分析
預計到2025年,RFID將佔銷售額的45.40%,這反映了倉庫和商店中已建立的讀寫器基礎設施。基於RFID的劣化智慧標籤市場規模預計將透過與自動化庫存管理系統的整合而擴大,到2031年將達到9.4億美元。同時,NFC預計將以11.62%的速度成長,超過感測型劣化標籤市場的整體成長率,因為智慧型手機掃描將成為主流。 RAIN RFID聯盟強調,超高頻(UHF)RFID對於追蹤托盤和箱子至關重要,因為它即使在視線範圍之外也能每秒讀取數百個物品。 NFC的近距離接觸要求使每個包裝都成為一個互動點,從而開闢了新的促銷和資料收集管道。 Energous公司於2025年6月推出的無電池e-Sense標籤可望降低RFID和未來環境聯網混合系統的營運成本。隨著經濟狀況的改善,將用於物流的遠端 RFID 與用於消費者互動的 NFC 相結合的混合部署可能會加速發展。
在價值極高的製藥業,感測標籤和時間/溫度指示器正被廣泛應用,監管機構會將溫度偏差記錄作為批次放行文件的一部分。光子標籤和氧反應標籤雖然仍處於小眾市場,但對於即食食品的調節氣體包裝至關重要。諸如印刷石墨烯天線和酶聯生物感測器等創新技術將進一步豐富技術組合,確保變質感測型智慧標籤產業持續細分並快速推進技術創新。
到2025年,食品飲料業將佔銷售額的61.20%,繼續保持其在變質感測型智慧標籤市場的最大佔有率,並直接受益於零售商的監管和嚴格的衛生標準。物流和供應鏈領域的應用預計將以11.34%的複合年成長率成長,並且隨著第三方物流供應商(3PL)採取責任保護措施,其市場佔有率預計將進一步擴大。在醫藥冷鏈領域,由於違規罰款遠高於標籤成本,且生技藥品的劣化是不可逆轉的,因此需要使用最昂貴的感測器套件。隨著劣化檢測範圍擴展到新的生鮮產品類別,化妝品、個人保健產品、組織樣本和特殊化學品等領域的需求也不斷成長。沃爾瑪2025年的RFID部署要求正在將智慧標籤從北美的“可選”轉變為“強制”,這表明一家零售商可以如何改變劣化感測型智慧標籤市場的成長軌跡。
朝向直接面對消費者 (D2C) 的配送模式轉變,正在拓展商品級感測器的應用場景。將「從魚到餐桌」和「從農場到餐桌」的數據整合到行動應用程式中的品牌,其複購率已顯著提升。對於面臨壓力、需要在整個配送過程中維護控制記錄的物流供應商而言,智慧標籤如今既被視為競爭優勢,也被視為合規保障,這正在推動設備規格的跨行業整合。
區域分析
預計到2025年,亞太地區將佔全球銷售額的32.10%,並將以12.01%的複合年成長率(CAGR)在所有地區中位居榜首,成為食品變質感測型智慧標籤市場成長最快的地區。中國國務院鼓勵進口商和國內包裝商採用智慧標籤,強制推行端對端冷鏈可追溯性,並將自願監測轉變為法律義務。日本的《食品損耗減少促進法》正在推廣延長保存期限和實現動態定價的技術,而韓國則在資助智慧農場項目,將變質感測器從溫室整合到零售商環節。印度的食品標準與安全局(FSSAI)指南正在刺激市場需求,但執行力度不一致限制了短期成長。澳洲和紐西蘭正迅速將感測器應用於高價值肉類出口,東南亞國家也在跨境零售連鎖的推動下紛紛效仿。
北美受益於成熟的RFID基礎設施。由於沃爾瑪強制要求供應商在2025年前採用RFID技術,其應用正在加速發展,但零售商的議價能力也給標籤製造商的利潤率帶來了壓力。加拿大在很大程度上遵循美國零售商的要求,而美國環保署(EPA)的「食品回收挑戰」計畫正在推動RFID技術的普及。在墨西哥,莓果和酪梨的冷鏈走廊正在興起,創造了新的機遇,但監管執行力度不足。
歐洲擁有世界上最嚴格的廢棄物和可追溯性法規。歐盟的「從農場到餐桌」策略設定了到2030年減少食物廢棄物的目標,而「數位產品護照」則呼籲在產品生命週期的各個階段保持透明。儘管《一般資料保護規則》(GDPR) 的資料保護需求增加了NFC和RFID技術的部署成本,但像Tesco和Sainsbury's這樣的零售商正在試行使用OnVu指示器來實現降價自動調整。從區域來看,德國、英國和法國在支出方面處於主導,而東歐和巴爾幹半島的步伐則相對較慢。中東和非洲的部署情況則更為多樣化,但海灣合作理事會(GCC)成員國正在投資冷鏈安全,作為「2030願景」的一部分,而南非的零售業正在試點使用智慧標籤來標記進口奢侈品。
其他好處:
- Excel格式的市場預測(ME)表
- 3個月的分析師支持
目錄
第1章:引言
- 研究假設和市場定義
- 調查範圍
第2章:調查方法
第3章執行摘要
第4章 市場狀況
- 市場概覽
- 市場促進因素
- 食品新鮮度即時監測的需求日益成長
- 消費者對食品安全和衛生的關注日益增加。
- 全球冷鏈物流網路的擴展
- 物聯網平台與變質檢測標籤的整合
- 零售商正在推行基於新鮮度的動態定價策略。
- 政府對減少食物浪費技術的補貼
- 市場限制因素
- 與傳統生產日期代碼相比,單價更高
- 缺乏全球互通性標準
- 關於基於NFC和RFID標籤的資料隱私問題
- 某些化學指示劑油墨的保存期限短
- 價值鏈分析
- 監理情勢
- 技術展望
- 宏觀經濟因素對市場的影響
- 波特五力分析
第5章 市場規模與成長預測
- 透過技術
- RFID
- NFC
- 感知標籤
- 時間和溫度指示器
- 光子/氧反應標記
- 按最終用戶行業分類
- 食品/飲料
- 製藥
- 物流和供應鏈
- 化妝品和個人護理
- 其他終端用戶產業
- 按包裝類型
- 軟包裝袋
- 硬瓶/罐子
- 紙箱和盒子
- 其他包裝形式
- 新鮮度指標的不同機制
- 比色化學指示劑
- 利用生物感測器的指標
- 氣體檢測指示器
- 混合多參數指數
- 按地區
- 北美洲
- 美國
- 加拿大
- 墨西哥
- 歐洲
- 英國
- 德國
- 法國
- 義大利
- 其他歐洲國家
- 亞太地區
- 中國
- 日本
- 印度
- 韓國
- 其他亞洲國家
- 中東
- 以色列
- 沙烏地阿拉伯
- 阿拉伯聯合大公國
- 土耳其
- 其他中東國家
- 非洲
- 南非
- 埃及
- 其他非洲國家
- 南美洲
- 巴西
- 阿根廷
- 其他南美國家
- 北美洲
第6章 競爭情勢
- 市場集中度
- 策略趨勢
- 市佔率分析
- 公司簡介
- Evigence Sensors Ltd.
- Insignia Technologies Ltd.
- Avery Dennison Corporation
- Innoscentia AB
- SpotSee LLC
- SATO Holdings Corporation
- Scanbuy Inc.
- Zebra Technologies Corporation
- Ensurge Micropower ASA
- CCL Industries Inc.
- Temptime Corporation
- Timestrip UK Ltd.
- Varcode Ltd.
- DeltaTrak Inc.
- SMARTRAC Technology GmbH
- Checkpoint Systems Inc.
- Ynvisible Interactive Inc.
- Shenzhen Freshlabel Systems Co., Ltd.
- Apex Labels Ltd.
- Freshpoint Labelling Solutions Inc.
第7章 市場機會與未來展望
According to Mordor Intelligence, the spoil detection based smart labels market size was valued at USD 1.11 billion in 2025 and estimated to grow from USD 1.23 billion in 2026 to reach USD 2.07 billion by 2031, at a CAGR of 10.92% during the forecast period (2026-2031).
This report is Segmented by Technology (RFID, NFC, Sensing Labels, and More), End-User Industry (Food and Beverage, Pharmaceutical, and More), Packaging Format (Flexible Pouches, Rigid Bottles/Jars, and More), Freshness Indicator Mechanism (Colorimetric Chemical Indicators, Biosensor-Based Indicators, and More), and Geography. The Market Forecasts are Provided in Terms of Value (USD).
Global Spoil Detection Based Smart Labels Market Trends and Insights
Growing Demand for Real-Time Food Freshness Monitoring
Food distributors are replacing static date codes with sensors that confirm freshness throughout transit, because time-temperature abuse can make products unsafe days before printed dates. The United Nations Environment Programme reported that 13.2% of food is lost between harvest and retail and a further 19% is wasted beyond retail, a footprint that generates 8-10% of global greenhouse-gas emissions. Walmart's October 2025 requirement that suppliers attach RFID tags to all fresh-food shipments turns food waste into a compliance issue, pushing producers to adopt spoilage indicators that trigger automatic inventory adjustments. SpotSee's battery-free WarmMark QR, launched in January 2025, offers +-1 °C accuracy and a two-year shelf life, illustrating the new economics that make single-use sensors viable at scale. The trajectory ensures that the spoil detection based smart labels market will benefit from both regulatory enforcement and private cost avoidance.
Rising Consumer Emphasis on Food Safety and Hygiene
Post-pandemic shoppers now treat verifiable freshness as essential, particularly parents and caregivers for immunocompromised consumers. Retail pilots in Japan and South Korea use NFC-enabled labels that allow smartphone scans, turning cold-chain data into a point-of-sale marketing asset. Brands that deliver real-time spoilage status gain shelf preference, while those relying solely on printed dates risk reputational damage. Price-premium segments such as organic produce and grass-fed meats can absorb the 5-10-fold cost premium of smart labels. China's State Council cold-chain mandates reinforce the trend by penalizing non-compliant freshness monitoring. These forces promote steady penetration of the spoil detection based smart labels market in urban Asia-Pacific.
High Unit Cost Versus Traditional Date Codes
Smart labels cost five to ten times more than printed expiration dates, eroding margins on low-value SKUs such as bagged salads. Procurement teams revert to cheaper date codes unless compelled by regulation or retailer mandate. Energous and other vendors now pursue battery-free sensor designs to lower total cost of ownership, while SpotSee promotes WarmMark QR's recyclable materials to align with sustainability-driven purchasing. The price hurdle is particularly binding in South America and Africa, where buyers prioritize refrigeration hardware over monitoring.
Other drivers and restraints analyzed in the detailed report include:
- Expansion of Cold-Chain Logistics Networks Globally
- Integration of Spoil Detection Labels with IoT Platforms
- Lack of Global Interoperability Standards
For complete list of drivers and restraints, kindly check the Table Of Contents.
Segment Analysis
RFID captured 45.40% revenue in 2025, reflecting established reader infrastructure in warehouses and stores. The spoil detection based smart labels market size for RFID is projected to reach USD 0.94 billion by 2031, expanding in lockstep with automated inventory systems. Conversely, NFC is forecast to grow at 11.62%, outpacing the overall spoil detection based smart labels market as smartphone scanning becomes mainstream. The RAIN RFID Alliance highlights that ultra-high-frequency RFID reads hundreds of items per second without line-of-sight, making it indispensable for pallet and case tracking. NFC's proximity requirement turns each package into a point of interaction, opening new promotional and data-collection channels. Energous' battery-free e-Sense tags, introduced June 2025, promise to lower operating costs for both RFID and future ambient-IoT hybrids. As economies improve, hybrid deployments that alternate between long-range RFID for logistics and NFC for consumer engagement will accelerate.
Sensing labels and time-temperature indicators serve high-value pharmaceuticals, where regulators treat excursion records as part of batch-release documentation. Photonic and oxygen-reactive labels remain niche but are indispensable for modified-atmosphere packaging in ready-to-eat meals. Innovations such as printed graphene antennas and enzyme-linked biosensors will further diversify the technology mix, ensuring continued fragmentation and rapid innovation in the spoil detection based smart label industry.
Food and beverage maintained 61.20% of 2025 revenue, equal to the largest slice of the spoil detection based smart labels market size, and benefits directly from retailer mandates and stringent hygiene norms. Logistics and supply-chain applications are projected to post an 11.34% CAGR, lifting their share as third-party logistics providers embed liability protections. Pharmaceutical cold chains adopt the highest-cost sensor suites, because regulatory fines dwarf labelling expenses and because biologics spoilage is irreversible. Cosmetics, personal care, tissue samples, and specialty chemicals round out demand as spoilage detection crosses into new perishable categories. Walmart's 2025 RFID requirement converts smart labels from optional to obligatory in North America, demonstrating how a single retailer can bend the growth trajectory of the spoil detection based smart labels market.
A shift toward direct-to-consumer grocery delivery widens use cases for item-level sensors. Brands that link fin-to-fork or farm-to-fork data in mobile apps gain measurable lifts in repeat purchase rates. Logistics providers, under pressure to document chain-of-custody, now view smart labels as both marketing moat and compliance shield, driving cross-industry convergence in device specifications.
Complete Report Scope:
- By Technology
- RFID
- NFC
- Sensing Labels
- Time-Temperature Indicators
- Photonic/Oxygen-Reactive Labels
- By End-User Industry
- Food and Beverage
- Pharmaceutical
- Logistics and Supply-Chain
- Cosmetics and Personal Care
- Other End-User Industries
- By Packaging Format
- Flexible Pouches
- Rigid Bottles/Jars
- Cartons and Boxes
- Other Packaging Format
- By Freshness Indicator Mechanism
- Colorimetric Chemical Indicators
- Biosensor-Based Indicators
- Gas-Sensing Indicators
- Hybrid Multi-Parameter Indicators
- By Geography
- North America
- United States
- Canada
- Mexico
- Europe
- United Kingdom
- Germany
- France
- Italy
- Rest of Europe
- Asia-Pacific
- China
- Japan
- India
- South Korea
- Rest of Asia
- Middle East
- Israel
- Saudi Arabia
- United Arab Emirates
- Turkey
- Rest of Middle East
- Africa
- South Africa
- Egypt
- Rest of Africa
- South America
- Brazil
- Argentina
- Rest of South America
- North America
Geography Analysis
Asia-Pacific led with 32.10% 2025 revenue and is projected to expand at a 12.01% CAGR, the highest among all regions in the spoil detection based smart labels market. China's State Council mandated end-to-end cold-chain traceability, transforming voluntary monitoring into legal obligation and boosting label uptake among importers and domestic packers. Japan's Food Loss Reduction Promotion Act promotes technologies that extend shelf life or enable dynamic pricing, while South Korea funds smart farm projects that integrate spoilage sensors from greenhouse to retailer. India's FSSAI guidelines create demand but uneven enforcement tempers near-term growth. Australia and New Zealand adopt sensors quickly for high-value meat exports, and Southeast Asian economies follow, spurred by cross-border retail chains.
North America benefits from mature RFID infrastructure. Walmart's 2025 supplier mandate accelerates penetration, but retailer bargaining power compresses margins for label makers. The U.S. EPA Food Recovery Challenge nudges adoption, while Canada largely mirrors U.S. retailer requirements. Mexico's emerging cold-chain corridor for berries and avocados creates incremental opportunities but lags in enforcement.
Europe enforces some of the strictest waste and traceability rules. The EU Farm-to-Fork Strategy sets 2030 food-waste reduction targets, and the Digital Product Passport demands life-cycle transparency. GDPR data-protection requirements add cost to NFC and RFID deployments, but retailers such as Tesco and Sainsbury's test OnVu indicators to automate markdowns. Germany, the United Kingdom, and France dominate regional spend, while Eastern Europe and the Balkans follow at a slower pace. The Middle East and Africa show patchy adoption; however, Gulf Cooperation Council states invest in cold-chain security under Vision 2030, and South Africa's organized retail sector is piloting smart labels for premium imports.
- Evigence Sensors Ltd.
- Insignia Technologies Ltd.
- Avery Dennison Corporation
- Innoscentia AB
- SpotSee LLC
- SATO Holdings Corporation
- Scanbuy Inc.
- Zebra Technologies Corporation
- Ensurge Micropower ASA
- CCL Industries Inc.
- Temptime Corporation
- Timestrip UK Ltd.
- Varcode Ltd.
- DeltaTrak Inc.
- SMARTRAC Technology GmbH
- Checkpoint Systems Inc.
- Ynvisible Interactive Inc.
- Shenzhen Freshlabel Systems Co., Ltd.
- Apex Labels Ltd.
- Freshpoint Labelling Solutions Inc.
Additional Benefits:
- The market estimate (ME) sheet in Excel format
- 3 months of analyst support
TABLE OF CONTENTS
1 INTRODUCTION
- 1.1 Study Assumptions and Market Definition
- 1.2 Scope of the Study
2 RESEARCH METHODOLOGY
3 EXECUTIVE SUMMARY
4 MARKET LANDSCAPE
- 4.1 Market Overview
- 4.2 Market Drivers
- 4.2.1 Growing Demand for Real-Time Food Freshness Monitoring
- 4.2.2 Rising Consumer Emphasis on Food Safety and Hygiene
- 4.2.3 Expansion of Cold-Chain Logistics Networks Globally
- 4.2.4 Integration of Spoil Detection Labels with IoT Platforms
- 4.2.5 Retailer Push for Dynamic Pricing Based on Freshness
- 4.2.6 Government Subsidies for Anti-Food-Waste Technologies
- 4.3 Market Restraints
- 4.3.1 High Unit Cost Versus Traditional Date Codes
- 4.3.2 Lack of Global Interoperability Standards
- 4.3.3 Data-Privacy Concerns in NFC and RFID-Based Labels
- 4.3.4 Limited Shelf-Life of Certain Chemical Indicator Inks
- 4.4 Value-Chain Analysis
- 4.5 Regulatory Landscape
- 4.6 Technological Outlook
- 4.7 Impact of Macroeconomic Factors on the Market
- 4.8 Porters Five Forces Analysis
- 4.8.1 Threat of New Entrants
- 4.8.2 Bargaining Power of Buyers
- 4.8.3 Bargaining Power of Suppliers
- 4.8.4 Threat of Substitute Products
- 4.8.5 Intensity of Competitive Rivalry
5 MARKET SIZE AND GROWTH FORECASTS (VALUE)
- 5.1 By Technology
- 5.1.1 RFID
- 5.1.2 NFC
- 5.1.3 Sensing Labels
- 5.1.4 Time-Temperature Indicators
- 5.1.5 Photonic/Oxygen-Reactive Labels
- 5.2 By End-User Industry
- 5.2.1 Food and Beverage
- 5.2.2 Pharmaceutical
- 5.2.3 Logistics and Supply-Chain
- 5.2.4 Cosmetics and Personal Care
- 5.2.5 Other End-User Industries
- 5.3 By Packaging Format
- 5.3.1 Flexible Pouches
- 5.3.2 Rigid Bottles/Jars
- 5.3.3 Cartons and Boxes
- 5.3.4 Other Packaging Format
- 5.4 By Freshness Indicator Mechanism
- 5.4.1 Colorimetric Chemical Indicators
- 5.4.2 Biosensor-Based Indicators
- 5.4.3 Gas-Sensing Indicators
- 5.4.4 Hybrid Multi-Parameter Indicators
- 5.5 By Geography
- 5.5.1 North America
- 5.5.1.1 United States
- 5.5.1.2 Canada
- 5.5.1.3 Mexico
- 5.5.2 Europe
- 5.5.2.1 United Kingdom
- 5.5.2.2 Germany
- 5.5.2.3 France
- 5.5.2.4 Italy
- 5.5.2.5 Rest of Europe
- 5.5.3 Asia-Pacific
- 5.5.3.1 China
- 5.5.3.2 Japan
- 5.5.3.3 India
- 5.5.3.4 South Korea
- 5.5.3.5 Rest of Asia
- 5.5.4 Middle East
- 5.5.4.1 Israel
- 5.5.4.2 Saudi Arabia
- 5.5.4.3 United Arab Emirates
- 5.5.4.4 Turkey
- 5.5.4.5 Rest of Middle East
- 5.5.5 Africa
- 5.5.5.1 South Africa
- 5.5.5.2 Egypt
- 5.5.5.3 Rest of Africa
- 5.5.6 South America
- 5.5.6.1 Brazil
- 5.5.6.2 Argentina
- 5.5.6.3 Rest of South America
- 5.5.1 North America
6 COMPETITIVE LANDSCAPE
- 6.1 Market Concentration
- 6.2 Strategic Moves
- 6.3 Market Share Analysis
- 6.4 Company Profiles (includes Global level Overview, Market level overview, Core Segments, Financials as available, Strategic Information, Market Rank/Share for key companies, Products and Services, and Recent Developments)
- 6.4.1 Evigence Sensors Ltd.
- 6.4.2 Insignia Technologies Ltd.
- 6.4.3 Avery Dennison Corporation
- 6.4.4 Innoscentia AB
- 6.4.5 SpotSee LLC
- 6.4.6 SATO Holdings Corporation
- 6.4.7 Scanbuy Inc.
- 6.4.8 Zebra Technologies Corporation
- 6.4.9 Ensurge Micropower ASA
- 6.4.10 CCL Industries Inc.
- 6.4.11 Temptime Corporation
- 6.4.12 Timestrip UK Ltd.
- 6.4.13 Varcode Ltd.
- 6.4.14 DeltaTrak Inc.
- 6.4.15 SMARTRAC Technology GmbH
- 6.4.16 Checkpoint Systems Inc.
- 6.4.17 Ynvisible Interactive Inc.
- 6.4.18 Shenzhen Freshlabel Systems Co., Ltd.
- 6.4.19 Apex Labels Ltd.
- 6.4.20 Freshpoint Labelling Solutions Inc.
7 MARKET OPPORTUNITIES AND FUTURE OUTLOOK
- 7.1 White-Space and Unmet-Need Assessment

 2026-2034年全球NFC和QR碼智慧標籤市場規模、佔有率、趨勢和成長分析報告
 具備劇透檢測功能的智慧標籤市場-2026-2032年全球市場預測
 智慧標籤:市場佔有率分析、產業趨勢與統計、成長預測(2026-2031)智慧標籤市場:2026-2032年全球市場預測(依標籤類型、技術、材料、組件、頻率、部署模式、應用程式和最終用戶分類)
 支援NFC和QR碼的消費級智慧標籤市場:市場機會、成長要素、產業趨勢分析及2026-2035年預測
 RFID智慧標籤市場預測至2034年-按組件、材料、頻率、應用、最終用戶和地區分類的全球分析全球物流智慧標籤市場:市場規模、佔有率、趨勢和成長分析(2026-2034)智慧標籤包裝市場預測至2034年—全球技術類型、組件、標籤類型、包裝形式、應用、最終用戶和區域分析
 智慧標籤市場報告:按技術、組件、最終用戶和地區分類(2026-2034 年)QR碼智慧標籤市場預測至2034年-全球標籤類型、代碼類型、材料類型、印刷技術、應用、最終用戶和區域分析