


 |
市場調查報告書
商品編碼
2123737
電視牆:市場佔有率分析、產業趨勢與統計、成長預測(2026-2031)Video Wall - Market Share Analysis, Industry Trends & Statistics, Growth Forecasts (2026 - 2031) |
||||||

※ 本網頁內容可能與最新版本有所差異。詳細情況請與我們聯繫。
據 Mordor Intelligence 稱,2025 年電視牆市場價值為 118.1 億美元,預計到 2031 年將達到 230.6 億美元,而 2026 年為 132 億美元,預測期(2026-2031 年)的複合年成長率為 11.79%。
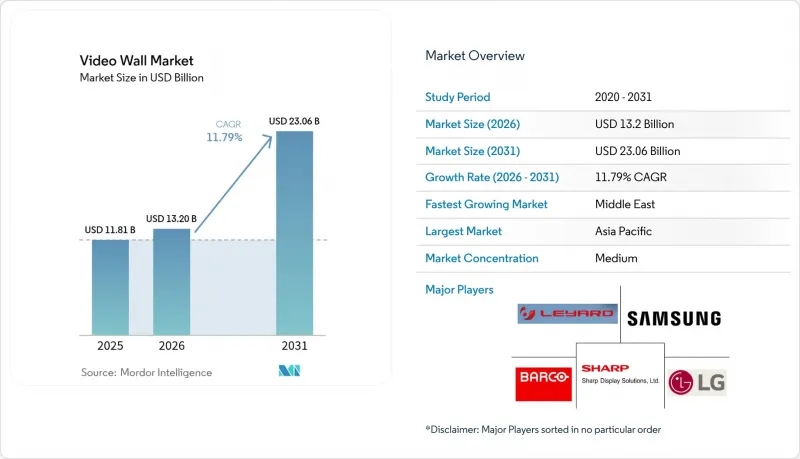
本報告按技術(LCD、LED、背投影立方體、microLED)、終端用戶(零售、交通運輸等)、顯示類型(直視型、拼接式LCD面板、背投影立方體)、安裝位置(室內、室外)和地區(北美、南美、歐洲、亞太、中東和非洲)進行細分。市場預測以美元(USD)為單位。
全球電視牆市場趨勢及洞察
MicroLED電視牆解決方案的興起
MicroLED 可實現像素級調光,對比度超過 1,000,000:1,這些特性如今已成為廣播工作室和高階零售商提案書 (RFP) 中的一項重要要求。三星的「The Wall」和 LG 的「MAGNIT」將於 2024 年實現商業化,它們摒棄了 OLED 中的有機層,將使用壽命延長至 10 萬小時以上,並消除了燒屏風險。SONY的「Crystal LED」將於 2025 年初在東京發布,它採用基於人工智慧的色彩校正技術,可根據環境變化自動調節輸出。台灣的晶圓代工廠正在向 8 吋藍寶石顯示器轉型,以提高良率並降低成本,預計成長率將達到 27.47%。許多公共設施現在必須符合 IEC 62341 光生物安全標準。
擴大交通樞紐LED電視牆的應用
機場和地鐵營運商正透過展示即時航班和月台資訊並投放動態廣告,將乘客的停留時間轉化為收入。愛丁堡機場12公尺長的弧形LED幕牆和堪薩斯市新航廈安裝的18塊DirectView顯示器皆於2024年投入運作。仁川機場24公尺長的帶狀顯示器採用臉部辨識技術實現內容個人化,但歐盟監管機構對此提出了隱私的擔憂。這些運作運營的設施簽訂了為期10年的服務契約,確保了持續的收入,從而實現了2.3%的成長率。
初始投資和總擁有成本高
高階微型LED陣列每平方公尺造價超過5,000美元,促使教育機構和市政部門轉向解析度較低的LCD產品。幾家機場營運商進行的一項2024年五年總擁有成本研究發現,一面由20塊面板組成的LED幕牆的成本約為32萬美元,而拼接式LCD的成本約為18萬美元。然而,考慮到LED的長壽命和低故障率,兩者之間的差距正在縮小。為了控制預算,企業客戶正在採用一種模式,將硬體、安裝和維護打包到一個固定的月費中,由供應商承擔組件故障的風險。由於外匯波動和關稅的影響,南美和非洲的本地到岸價格上漲了高達50%,使得租賃成為主要的實施方案。
細分市場分析
預計到2025年,LED將占到銷售額的45.74%,憑藉其小於1.2毫米的像素間距,即使在近距離觀看也能確保影像無縫銜接,從而奠定電視牆市場的基礎。 MicroLED預計到2031年將以26.11%的複合年成長率成長,高階零售商、廣播業和企業大廳等買家都看重其近乎無限的對比度和10萬小時的使用壽命。 LCD雖然擁有小於1毫米的超窄邊框優勢,但由於其在24/7全天候運作環境下亮度均勻性迅速下降,在高階專案中的應用正在減少。此外,隨著LED無需更換燈泡且易於擴充性,背投影機也逐漸從控制室的配置中淘汰。
為了確保氮化鎵晶圓的供應,並緩解2024年衝擊Mini-LED市場的價格波動,製造商們正在對其晶片生產線進行垂直整合。SONY在2024年4月決定自主生產MicroLED,清楚展現了高階品牌向端到端控制轉型的大趨勢。對於注重預算的教育機構和輔助控制室而言,LCD仍然具有吸引力,因為與LED相比,其資本成本可降低40%以上。
在電視牆市場,預計到2025年,交通運輸業將佔總收入的28.22%,這主要得益於航站升級改造,將航班數據和廣告功能整合其中。飯店和娛樂產業預計將以20.29%的複合年成長率成長,這主要得益於各場所透過贊助實現身臨其境型環境的商業化。零售業規模依然龐大,但由於連鎖店優先發展電子商務基礎設施並推遲二線門市的維修,其成長速度正在放緩。企業用戶正在混合會議空間中採用窄邊框電視牆,以融合視訊會議和現場參會,並且出於成本考慮,他們越來越傾向於選擇液晶顯示器。
儘管政府和公共產業部門正在穩步推進,但它們仍受到多年採購週期的限制。同時,教育和醫療保健部門需要包含培訓和軟體的承包解決方案。為了滿足《美國殘障人士法案》(ADA) 的要求,包括內建文字轉語音功能在內的無障礙功能現在已成為標準配置。
區域分析
到2025年,亞太地區將佔總銷售額的37.92%,這主要得益於中國垂直整合型供應商以比歐美同類產品低20-30%的價格出口承包系統。目前,印度主要機場和大都會圈正在進行升級改造,而日本的設備更換則符合經濟產業省制定的2024年能源效率標準。澳洲的礦業指揮中心需要防塵耐高溫的設備。
預計到2031年,中東地區的年複合成長率(CAGR)13.72%,這主要得益於沙烏地阿拉伯NEOM新城和阿拉伯聯合大公國機場擴建等項目中對耐高溫50 度C戶外顯示器的需求,即使在陽光直射下也能清晰可見。一家土耳其零售集團正在部署大型顯示器以提升店內體驗。在北美,隨著企業以窄邊框LED顯示器取代LCD顯示器以適應混合辦公環境,市場正在穩步擴張。歐洲的部署反映了嚴格的能源和光污染法規。英國一家交通樞紐正在從投影立方體過渡到直視LED顯示螢幕,以期在未來十年內節省成本。一家德國汽車製造商在其設計工作室中使用4K顯示器來即時預覽油漆和裝飾效果。法國的宵禁政策促使預算轉向室內設施,而南美的成長則取決於巴西機場私有化計畫帶來的關稅降低。
其他好處:
- Excel格式的市場預測(ME)表
- 3個月的分析師支持
目錄
第1章:引言
- 研究假設和市場定義
- 調查範圍
第2章:調查方法
第3章執行摘要
第4章 市場狀況
- 市場概覽
- 市場促進因素
- 擴大交通樞紐LED電視牆的應用
- 零售業對數位電子看板的需求日益成長
- 窄邊框液晶面板的技術進步
- MicroLED電視牆解決方案的到來
- 電視牆與指揮中心資料視覺化平台的整合
- 擴建身臨其境型娛樂設施與電子競技場
- 市場限制因素
- 初始投資和總擁有成本高
- 大型顯示器會產生大量熱能和電力消耗。
- Mini-LED和IC元件供應鏈的不穩定性
- 主要城市的戶外光害法規
- 產業價值鏈分析
- 監理情勢
- 技術展望
- 波特五力分析
- 宏觀經濟因素對市場的影響
第5章 市場規模與成長預測
- 透過技術
- LCD
- LED
- 背投影立方體
- MicroLED
- 最終用戶
- 零售
- 運輸
- 政府和公共產業
- 公司
- 飯店和娛樂
- 其他
- 顯示類型
- 直視電視牆
- 磁磚圖案液晶面板牆
- 背投影立方體牆
- 按安裝位置
- 室內的
- 戶外的
- 按地區
- 北美洲
- 美國
- 加拿大
- 墨西哥
- 南美洲
- 巴西
- 阿根廷
- 其他南美國家
- 歐洲
- 英國
- 德國
- 法國
- 西班牙
- 義大利
- 其他歐洲國家
- 亞太地區
- 中國
- 印度
- 日本
- 澳洲
- 韓國
- 其他亞太國家
- 中東和非洲
- 中東
- 沙烏地阿拉伯
- 阿拉伯聯合大公國
- 土耳其
- 其他中東國家
- 非洲
- 南非
- 肯亞
- 其他非洲國家
- 中東
- 北美洲
第6章 競爭情勢
- 市場集中度
- 策略趨勢
- 市佔率分析
- 公司簡介
- Samsung Electronics Co., Ltd.
- LG Electronics Inc.
- Leyard Optoelectronic Co., Ltd.
- Barco NV
- Sharp NEC Display Solutions, Ltd.
- Sony Group Corporation
- Panasonic Holdings Corporation
- Christie Digital Systems USA, Inc.
- Unilumin Group Co., Ltd.
- Absen Optoelectronic Co., Ltd.
- Daktronics, Inc.
- ViewSonic Corporation
- Planar Systems, Inc.
- ROE Visual Co., Ltd.
- Shenzhen AOTO Electronics Co., Ltd.
- Delta Electronics, Inc.
- Mitsubishi Electric Corporation
- Toshiba Corporation
- Koninklijke Philips NV
- Acer Incorporated
第7章 市場機會與未來展望
According to Mordor Intelligence, the video wall market size was valued at USD 11.81 billion in 2025 and estimated to grow from USD 13.2 billion in 2026 to reach USD 23.06 billion by 2031, at a CAGR of 11.79% during the forecast period (2026-2031).
This report is Segmented by Technology (LCD, LED, Rear-Projection Cube, Microled), End-User (Retail, Transportation, and More), Display Type (Direct-View, Tiled LCD Panel, and Rear Projection Cube), Installation Location (Indoor, and Outdoor), and Geography (North America, South America, Europe, Asia-Pacific, Middle East and Africa). The Market Forecasts are Provided in Terms of Value (USD).
Global Video Wall Market Trends and Insights
Emergence of MicroLED Video Wall Solutions
MicroLED brings per-pixel dimming and contrast ratios beyond 1,000,000:1, attributes now written into RFPs for broadcast studios and luxury retail. Samsung's The Wall and LG's MAGNIT, commercialized in 2024, eliminate the organic layers found in OLED, extending lifespans beyond 100,000 hours and removing burn-in risk. Sony's Crystal LED installation in Tokyo in early 2025 adds AI-based color calibration that adjusts output regardless of ambient changes. Taiwan-based foundries are shifting to 8-inch sapphire to lift yields and compress pricing, enabling the 27.47% forecast growth. Compliance with IEC 62341 photobiological safety norms is now mandatory in many public installations.
Growing Adoption of LED Video Walls in Transportation Hubs
Airport and metro operators are turning dwell time into revenue by streaming dynamic ads alongside real-time flight or platform data. Edinburgh Airport's 12-meter curved LED wall and Kansas City's new terminal's 18 direct-view displays both went live in 2024. Incheon Airport's 24-meter ribbon integrates facial-recognition triggers to personalize content, drawing privacy scrutiny from EU regulators. The 2.3% growth lift arises because these 24/7 facilities lock in 10-year service contracts that assure recurring revenue.
High Initial Investment and Total Cost of Ownership
Premium MicroLED arrays can top USD 5,000 per square meter, pushing education and municipal buyers toward lower-resolution LCD alternatives. Five-year ownership studies by several airport operators in 2024 show LED walls costing roughly USD 320,000 for a 20-panel build versus USD 180,000 for tiled LCD, though the gap narrows once longer LED lifespans and lower failure rates are factored. To maintain budgets, corporate customers are bundling hardware, installation, and maintenance into fixed monthly fees that place component-failure risk on vendors. Currency swings and tariffs inflate landed costs by up to 50% in South America and Africa, making leasing the primary adoption path.
Other drivers and restraints analyzed in the detailed report include:
- Integration with Command-Center Visualization Platforms
- Expansion of Immersive Venues and eSports Arenas
- Outdoor Light-Pollution Regulations in Major Urban Centers
For complete list of drivers and restraints, kindly check the Table Of Contents.
Segment Analysis
LED retained 45.74% of 2025 revenue, anchoring the video wall market thanks to sub-1.2-millimeter pixel pitches that ensure seamless imagery at close range. MicroLED is set to expand at a 26.11% CAGR through 2031 as luxury retail, broadcast, and corporate lobby buyers favor its near-infinite contrast and 100,000-hour lifespan. LCD, while benefiting from bezels under 1 millimeter, is ceding high-profile projects because brightness uniformity degrades faster in 24/7 service. Rear-projection cubes continue to exit control-room specifications as LED eliminates lamp replacements and simplifies scaling.
Manufacturers are vertically integrating chip lines to secure gallium-nitride wafers and blunt pricing swings that rattled Mini-LED in 2024. Sony's April 2024 decision to bring MicroLED fabrication in-house illustrates a broader pivot among premium brands toward end-to-end control. LCD still appeals in budget-sensitive education and secondary control rooms where capital savings exceed 40% versus LED.
Transportation held 28.22% of 2025 revenue in the video wall market, driven by terminal-wide upgrades that combine flight data and advertising. Hospitality and entertainment is forecast to grow at 20.29% CAGR, fueled by venues that monetize immersive environments via sponsorships. Retail remains sizable yet slower as chains prioritize e-commerce infrastructure, deferring secondary-store upgrades. Corporate adopters equip hybrid meeting spaces with narrow-bezel walls that align video conferencing with in-person presence, leaning toward LCD for cost reasons.
Government and utilities progress steadily but are bound by multi-year procurement cycles, while education and healthcare demand turnkey bundles with training and software included. Accessibility features, including embedded text-to-speech, are now standard to satisfy ADA requirements.
Complete Report Scope:
- By Technology
- LCD
- LED
- Rear-Projection Cube
- MicroLED
- By End-User
- Retail
- Transportation
- Government and Public Utilities
- Corporate
- Hospitality and Entertainment
- Others
- By Display Type
- Direct-View Video Wall
- Tiled LCD Panel Wall
- Rear Projection Cube Wall
- By Installation Location
- Indoor
- Outdoor
- By Geography
- North America
- United States
- Canada
- Mexico
- South America
- Brazil
- Argentina
- Rest of South America
- Europe
- United Kingdom
- Germany
- France
- Spain
- Italy
- Rest of Europe
- Asia Pacific
- China
- India
- Japan
- Australia
- South Korea
- Rest of Asia-Pacific
- Middle East and Africa
- Middle East
- Saudi Arabia
- United Arab Emirates
- Turkey
- Rest of Middle East
- Africa
- South Africa
- Kenya
- Rest of Africa
- Middle East
- North America
Geography Analysis
The Asia-Pacific region generated 37.92% of 2025 revenue, sustained by vertically integrated Chinese vendors exporting turnkey systems at prices 20-30% lower than those of Western peers. India's major airports and metros are mid-upgrade, while Japan's replacements align with 2024 efficiency codes from METI. Australia's mining command centers require dust-proof, temperature-tolerant models.
The Middle East is forecast to have a 13.72% CAGR through 2031, as Saudi Arabia's NEOM and the UAE's airport expansions demand sunlight-readable, 50 °C-rated outdoor walls. Retail groups in Turkey are turning to large-format displays to spur in-store experiences. North America advances steadily as enterprises retrofit LCD walls with narrow-bezel LED models compatible with hybrid work suites. European adoption reflects tough energy and light-pollution rules. U.K. transportation hubs move from projection cubes to direct-view LED for 10-year savings. German automakers utilize 4K walls in their design studios to visualize paint and trim in real-time. France's nighttime curfews redirect budgets indoors, while South America's growth hinges on reduced tariffs under Brazil's airport privatization program.
- Samsung Electronics Co., Ltd.
- LG Electronics Inc.
- Leyard Optoelectronic Co., Ltd.
- Barco NV
- Sharp NEC Display Solutions, Ltd.
- Sony Group Corporation
- Panasonic Holdings Corporation
- Christie Digital Systems USA, Inc.
- Unilumin Group Co., Ltd.
- Absen Optoelectronic Co., Ltd.
- Daktronics, Inc.
- ViewSonic Corporation
- Planar Systems, Inc.
- ROE Visual Co., Ltd.
- Shenzhen AOTO Electronics Co., Ltd.
- Delta Electronics, Inc.
- Mitsubishi Electric Corporation
- Toshiba Corporation
- Koninklijke Philips N.V.
- Acer Incorporated
Additional Benefits:
- The market estimate (ME) sheet in Excel format
- 3 months of analyst support
TABLE OF CONTENTS
1 INTRODUCTION
- 1.1 Study Assumptions and Market Definition
- 1.2 Scope of the Study
2 RESEARCH METHODOLOGY
3 EXECUTIVE SUMMARY
4 MARKET LANDSCAPE
- 4.1 Market Overview
- 4.2 Market Drivers
- 4.2.1 Growing Adoption of LED Video Walls in Transportation Hubs
- 4.2.2 Increasing Demand for Digital Signage in Retail Environments
- 4.2.3 Advancements in Narrow-Bezel LCD Panels
- 4.2.4 Emergence of MicroLED Video Wall Solutions
- 4.2.5 Integration of Video Walls with Command-Centre Data Visualisation Platforms
- 4.2.6 Expansion of Immersive Entertainment Venues and eSports Arenas
- 4.3 Market Restraints
- 4.3.1 High Initial Investment and Total Cost of Ownership
- 4.3.2 Significant Heat and Power Consumption of Large Displays
- 4.3.3 Supply Chain Volatility for Mini-LED and IC Components
- 4.3.4 Outdoor Light-Pollution Regulations in Major Urban Centres
- 4.4 Industry Value Chain Analysis
- 4.5 Regulatory Landscape
- 4.6 Technological Outlook
- 4.7 Porter's Five Forces Analysis
- 4.7.1 Threat of New Entrants
- 4.7.2 Bargaining Power of Buyers
- 4.7.3 Bargaining Power of Suppliers
- 4.7.4 Threat of Substitute Products
- 4.7.5 Intensity of Competitive Rivalry
- 4.8 Impact of Macroeconomic Factors on the Market
5 MARKET SIZE AND GROWTH FORECASTS (VALUE)
- 5.1 By Technology
- 5.1.1 LCD
- 5.1.2 LED
- 5.1.3 Rear-Projection Cube
- 5.1.4 MicroLED
- 5.2 By End-User
- 5.2.1 Retail
- 5.2.2 Transportation
- 5.2.3 Government and Public Utilities
- 5.2.4 Corporate
- 5.2.5 Hospitality and Entertainment
- 5.2.6 Others
- 5.3 By Display Type
- 5.3.1 Direct-View Video Wall
- 5.3.2 Tiled LCD Panel Wall
- 5.3.3 Rear Projection Cube Wall
- 5.4 By Installation Location
- 5.4.1 Indoor
- 5.4.2 Outdoor
- 5.5 By Geography
- 5.5.1 North America
- 5.5.1.1 United States
- 5.5.1.2 Canada
- 5.5.1.3 Mexico
- 5.5.2 South America
- 5.5.2.1 Brazil
- 5.5.2.2 Argentina
- 5.5.2.3 Rest of South America
- 5.5.3 Europe
- 5.5.3.1 United Kingdom
- 5.5.3.2 Germany
- 5.5.3.3 France
- 5.5.3.4 Spain
- 5.5.3.5 Italy
- 5.5.3.6 Rest of Europe
- 5.5.4 Asia Pacific
- 5.5.4.1 China
- 5.5.4.2 India
- 5.5.4.3 Japan
- 5.5.4.4 Australia
- 5.5.4.5 South Korea
- 5.5.4.6 Rest of Asia-Pacific
- 5.5.5 Middle East and Africa
- 5.5.5.1 Middle East
- 5.5.5.1.1 Saudi Arabia
- 5.5.5.1.2 United Arab Emirates
- 5.5.5.1.3 Turkey
- 5.5.5.1.4 Rest of Middle East
- 5.5.5.2 Africa
- 5.5.5.2.1 South Africa
- 5.5.5.2.2 Kenya
- 5.5.5.2.3 Rest of Africa
- 5.5.5.1 Middle East
- 5.5.1 North America
6 COMPETITIVE LANDSCAPE
- 6.1 Market Concentration
- 6.2 Strategic Moves
- 6.3 Market Share Analysis
- 6.4 Company Profiles (includes Global level Overview, Market level overview, Core Segments, Financials as available, Strategic Information, Market Rank/Share for key companies, Products and Services, and Recent Developments)
- 6.4.1 Samsung Electronics Co., Ltd.
- 6.4.2 LG Electronics Inc.
- 6.4.3 Leyard Optoelectronic Co., Ltd.
- 6.4.4 Barco NV
- 6.4.5 Sharp NEC Display Solutions, Ltd.
- 6.4.6 Sony Group Corporation
- 6.4.7 Panasonic Holdings Corporation
- 6.4.8 Christie Digital Systems USA, Inc.
- 6.4.9 Unilumin Group Co., Ltd.
- 6.4.10 Absen Optoelectronic Co., Ltd.
- 6.4.11 Daktronics, Inc.
- 6.4.12 ViewSonic Corporation
- 6.4.13 Planar Systems, Inc.
- 6.4.14 ROE Visual Co., Ltd.
- 6.4.15 Shenzhen AOTO Electronics Co., Ltd.
- 6.4.16 Delta Electronics, Inc.
- 6.4.17 Mitsubishi Electric Corporation
- 6.4.18 Toshiba Corporation
- 6.4.19 Koninklijke Philips N.V.
- 6.4.20 Acer Incorporated
7 MARKET OPPORTUNITIES AND FUTURE OUTLOOK
- 7.1 White-Space and Unmet-Need Assessment

 電視牆和拼接顯示器市場規模、佔有率和成長分析:按顯示技術、配置和邊框寬度、系統元件組件、應用領域和地區分類 - 行業預測,2026-2033年
 LED電視牆市場分析及預測(至2035年):類型、產品類型、服務、技術、組件、應用、形式、最終用戶、安裝方式、解決方案
 LED電視牆市場:2026-2032年全球市場預測(按顯示技術、安裝類型、解析度、部署方式、應用、最終用戶和銷售管道)電視牆市場:2026-2032年全球市場預測(按顯示技術、組件、部署、應用和最終用戶分類)
 電視牆市場報告:按產品、服務、部署類型、技術、產業和地區分類(2026-2034 年)電視牆市場分析及至2035年預測:按類型、產品類型、服務、技術、組件、應用、形式、安裝類型、解決方案和最終用戶分類
 LED電視牆市場規模、佔有率及成長分析(按類型、安裝方式、服務、應用和地區分類)-2026-2033年產業預測
 LED電視牆的全球市場(2026年):展望與價格成本分析
 全球電視牆市場預測(2025-2030)
 電視牆市場規模、佔有率、趨勢分析報告(按顯示技術、應用、最終用途、地區和細分市場),預測(2025 年至 2030 年)