


 |
市場調查報告書
商品編碼
2123713
智慧顯示器:市場佔有率分析、產業趨勢與統計及成長預測(2026-2031)Smart Display - Market Share Analysis, Industry Trends & Statistics, Growth Forecasts (2026 - 2031) |
||||||

※ 本網頁內容可能與最新版本有所差異。詳細情況請與我們聯繫。
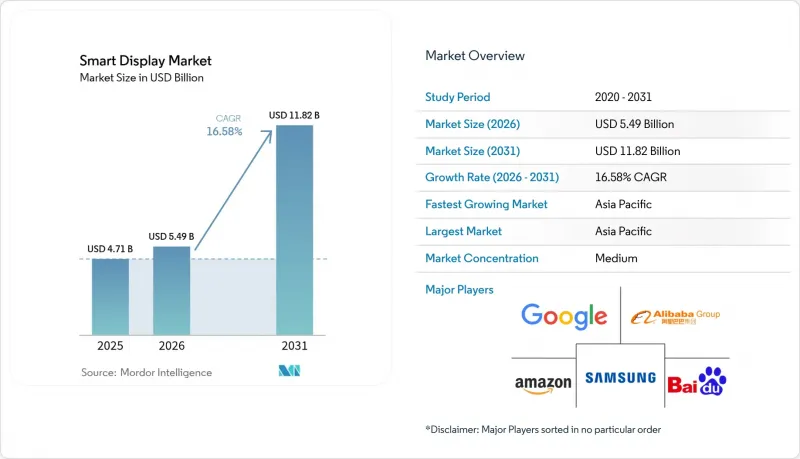
根據 Mordor Intelligence 估計,智慧顯示器市場規模從 2025 年的 47.1 億美元成長到 2026 年的 54.9 億美元,預計到 2031 年將達到 118.2 億美元。
預計 2026 年至 2031 年的複合年成長率為 16.58%。
本報告按語音助理(亞馬遜 Alexa 及其他)、螢幕大小(5-10 吋及其他)、顯示技術(LCD 及其他)、解析度(全高清及其他)、安裝方式(獨立式及其他)、連接方式(僅 Wi-Fi 及其他)、終端使用者產業(汽車及其他)和地區(北美及其他)進行細分。市場預測以美元計價。
全球智慧顯示器市場趨勢及洞察
北美地區多模態、語音優先的智慧家庭中心日益普及
智慧顯示器正朝著融合視聽功能的混合型設備發展,可透過單一介面整合控制照明、安防和娛樂系統。預計到2026年,美國語音助理用戶將達到1.571億,這將推動設備升級,使其能夠處理更複雜的指令並提供情境化的視覺資訊。生成式人工智慧(AI)能夠提供主動提案,例如根據通勤資料預熱恆溫器,進而提升產品感知價值。三星的Vision AI顯示器助力該公司在2024年佔據了高階產品28.3%的市場。零售商將顯示器與訂閱服務捆綁銷售,從而提高經常性收入和客戶留存率。隨著蘋果準備推出首款智慧家庭顯示器,競爭日益激烈,迫使生態系統中的公司每年更新產品線。
Matter相容設備的普及化正在加速平台間的互通性。
Matter 1.4 引入了整合 Wi-Fi 和 Thread 的認證家用路由器,顯著減少了設定失敗率和安裝時間。預計到 2025 年中,將有超過 1000 種 Matter 認證產品問世,消費者可以自由搭配不同品牌的產品,無需擔心被廠商鎖定。企業將該協議的安全部署流程視為滿足零信任要求的第一步,這正在推動其在商業領域的廣泛應用。公共產業正在考慮部署基於 Matter 的能源儀表板,以支援其需量反應計劃。該標準也為酒店業現有設施的維修創造了機會,因為它允許現有的 Wi-Fi 基礎設施承載 Thread 邊界路由器,而無需重新佈線。
始終開啟的麥克風存在安全漏洞,導致 B2B 採購延遲。
金融機構和醫院暫停部署,直到供應商提供資料通道文件並證明設備具備足夠的處理能力。由於首席資訊安全長 (CISO) 要求按照 ISO 27001 標準進行滲透測試,採購週期最多延長了 45 天。 Matter 的離線模式選項緩解了一些擔憂,但它使集中式設備管理更加複雜,從而催生了對混合架構的需求,這增加了成本和整合複雜性。擁有 FedRAMP 同等認證的供應商能夠更快地贏得契約,並建立先發優勢。
細分市場分析
預計到2025年,支援語音助理的智慧顯示器市場規模將達到41.8億美元。亞馬遜Alexa憑藉著Fire TV和Ring的交叉銷售勢頭,在2025年佔據了33.12%的市場佔有率。谷歌助理(Google Assistant)緊跟在後,其產品Nest Hub也取得了不錯的成績。同時,阿里巴巴旗下的天貓智慧助理(TmallGenie)憑藉其整合的AI聊天機器人(能夠根據中國方言進行內容在地化),實現了18.38%的複合年成長率。由於生成式模型能夠記憶過往對話歷史,智慧顯示器的更換需求不斷成長,預計到2025年,支援語音助理的智慧顯示器市場規模也將達到41.8億美元。蘋果將於2025年3月發布的6吋「Home Display」標誌著新一輪競爭的開始,並可能將iOS用戶家庭納入HomeKit生態系統。
針對標準中文最佳化的大規模語言模型的持續擴展,正逐漸削弱Alexa在中國的主導地位。在中國,百度DuerOS佔了行動智慧螢幕市場41.1%的佔有率,較上年同期下降了10.3個百分點。各品牌正透過視覺搜尋、嬰兒安全模式以及整合QR碼支付的多模態購物車等功能來凸顯自身差異化優勢。這些發展表明,儘管Matter致力於實現互聯互通,但智慧顯示市場正在細分為基於特定區域的體驗細分市場。
到2025年,5-10吋螢幕將佔據市場主導地位,銷售佔比高達52.10%。這主要得益於該尺寸螢幕在安裝空間和觀看舒適度之間的良好平衡。烹飪食譜、臥室警報和辦公桌視訊通話等應用情境尤其適合此尺寸,從而有效降低了物料成本。同時,10吋以上螢幕市場正以18.92%的複合年成長率快速成長,這主要得益於零售商店、醫院和汽車儀錶板等場所對更豐富視覺效果的需求。更大的螢幕支援分割畫面模式,可同時顯示視訊聊天和智慧家庭儀表板,從而提升用戶參與度。
當螢幕對角線超過10吋時,平均售價大幅上漲,提高了製造商的利潤率。 OLED螢幕在該細分市場滲透率高,促成了智慧顯示器市場高階價格區間的形成。面板製造商正將產能轉向8.6代玻璃基板,以滿足市場對大尺寸螢幕的激增需求。同時,5吋以下的設備仍局限於低價利基市場和床頭應用,但由於穿戴式裝置已經具備小螢幕通知功能,它們在智慧顯示器市場的佔有率正在萎縮。
由於成熟的供應鏈和具有競爭力的價格,液晶顯示器(LCD)預計在2025年仍將保持81.05%的市場佔有率。低溫多相液晶顯示器(LTPS LCD)因其熱穩定性和高亮度,仍是汽車儀錶板的首選。然而,隨著供應商利用OLED深邃的黑色顯示效果和柔軟性打造曲面和捲曲等外形規格,OLED的複合年成長率(CAGR)正以21.35%的速度快速成長。在豪華飯店的智慧鏡中,OLED層壓板被用於將非顯示顯示器隱藏在反射玻璃之後,從而提高了每位用戶平均收入(ARPU)。
預計到2031年,基於OLED的智慧顯示器市場規模將超過34.2億美元,主要得益於韓國和中國第六代軟性材料製造廠的運作。 MicroLED的研究表明,其亮度更高、壽命更長,而印刷轉印技術的成本也逐漸接近目標。為了規避單一技術帶來的風險,製造商正透過專利交叉授權和麵板產品組合多元化來分散風險。
區域分析
預計到2025年,亞太地區將以37.42%的市佔率引領智慧顯示器市場,並在2031年之前維持17.05%的複合年成長率。面對2024年智慧音箱出貨量25.6%的下滑,百度和阿里巴巴等中國廠商正透過在其顯示器中整合大規模語言模型(LLM)來重塑產品價值提案。政府支持的人工智慧晶片計畫正在降低物料清單(BOM)成本,使售價低於100美元的大螢幕顯示器得以普及,並拓展其在遍遠地區的覆蓋範圍。韓國品牌則專注於OLED創新,利用本土面板生態系統向全部區域出口高階產品。
北美憑藉著近乎普及的寬頻網路和語音助理的高普及率,依然是科技潮流的先鋒。在家庭用戶中,從第一代智慧音箱升級到配備更高級麥克風和邊緣人工智慧技術的Matter智慧音箱的趨勢正在推動市場成長。亞馬遜目前佔據美國智慧音箱市場29%的佔有率,並透過為Alexa推出生成式人工智慧升級來促進提升銷售到更高階的Echo Show型號。蘋果計劃於2025年推出智慧音箱,這可能會吸引其部分高收入iOS用戶,並重塑市場格局。
在歐洲,隱私和永續性備受重視,這刺激了對採用設備內處理和回收材料的產品的需求。預計到2024年,歐洲智慧家庭市場規模將達到221.1億美元,這主要得益於即將訂定的生態設計法規強制要求具備能源管理功能,從而推動了對Matter認證的、可監測能耗的智慧家庭中心的採購量成長。雖然由於語音助理缺乏語言支持,北歐國家的普及速度較為緩慢,但隨著相關法規的完善和節能維修補貼的推出,預計潛在需求將會受到刺激。在南美、中東和非洲等新興地區,隨著OEM廠商將小螢幕手機與智慧型手機捆綁銷售以促進生態系統整合,智慧型手機的普及率正在逐步提高,但價格敏感度和不穩定的通訊環境限制了銷量成長。
其他好處
- Excel格式的市場預測(ME)表
- 3個月的分析師支持
目錄
第1章:引言
- 研究假設和市場定義
- 調查範圍
第2章:調查方法
第3章執行摘要
第4章 市場狀況
- 市場概覽
- 市場促進因素
- 北美地區多模態「語音優先」智慧家庭中心的廣泛應用
- Matter相容設備的普及化正在加速平台間的互通性。
- 汽車製造商將智慧後視鏡和貫穿式駕駛座顯示器整合在一起。
- 透過人工智慧驅動的上下文感知使用者介面(亞洲主導),拓展10吋以上螢幕類別的高階定價結構
- 零售業對「無摩擦支付」和「動態貨架末端標誌」的需求
- 透過床邊智慧型設備提高病人參與和HCAHPS評分。
- 市場限制因素
- 始終開啟的麥克風存在安全漏洞,導致 B2B 採購延遲。
- 8-10吋液晶面板工廠持續短缺,限制了供應彈性。
- 各地資料隱私法規的不一致推高了在地化成本。
- 語音助理缺乏語言支持,阻礙了其在北歐和加勒比地區的普及。
第5章:工業生態系分析
第6章 技術展望
第7章:波特五力分析
- 波特五力模型
第8章 市場規模與成長預測
- 語音助理
- Amazon Alexa
- Google Assistant
- Baidu DuerOS
- Alibaba TmallGenie
- Apple Siri
- 其他
- 螢幕大小
- 5英吋或更小
- 5-10英寸
- 10吋或更大
- 顯示技術
- LCD
- OLED
- 其他(微型LED、電子紙)
- 通過決議
- 高清(720p 或更低)
- 全高清 (1080p)
- 4K 或更高
- 按安裝類型
- 獨立式智慧顯示器
- 整合智慧顯示器(智慧鏡子、自助服務終端、貨架邊緣)
- 透過連接方式
- 僅限 Wi-Fi
- Wi-Fi + 蜂窩網路
- Wi-Fi+Zigbee,Thread,Matter
- 按最終用戶行業分類
- 智慧住宅
- 車
- 零售和酒店
- 衛生保健
- 企業和教育機構
- 其他(交通樞紐、公部門)
- 按地區
- 北美洲
- 美國
- 加拿大
- 墨西哥
- 歐洲
- 德國
- 英國
- 法國
- 義大利
- 西班牙
- 北歐國家(丹麥、瑞典、挪威、芬蘭)
- 其他歐洲國家
- 亞太地區
- 中國
- 日本
- 韓國
- 印度
- 東南亞
- 澳洲
- 其他亞太國家
- 南美洲
- 巴西
- 阿根廷
- 其他南美國家
- 中東
- 波灣合作理事會(GCC)成員國
- 土耳其
- 其他中東國家
- 非洲
- 南非
- 奈及利亞
- 其他非洲地區
- 北美洲
第9章 競爭情勢
- 市場集中度
- 策略趨勢
- 市佔率分析
- 公司簡介
- Amazon.com Inc.
- Google LLC
- Baidu Inc.
- Alibaba Group Holding Ltd.
- Xiaomi Corp.
- Lenovo Group Ltd.
- LG Electronics Inc.
- Samsung Electronics Co., Ltd.
- Meta Platforms Inc.(Portal)
- Sony Corp.
- TCL Tech. Group
- Hisense Group
- Sharp Corp.
- Koninklijke Philips NV
- Panasonic Holdings Corp.
- Huawei Tech. Co. Ltd.
- BOE Technology Group Co. Ltd.
- Vizio Inc.
- JBL(Harman Int'l)
- Apple Inc.
第10章 市場機會與未來展望
- 對未開發市場和未滿足需求的評估
According to Mordor Intelligence, smart display market size in 2026 is estimated at USD 5.49 billion, growing from 2025 value of USD 4.71 billion with 2031 projections showing USD 11.82 billion, growing at 16.58% CAGR over 2026-2031.
This report is Segmented by Voice Assistant (Amazon Alexa, and More), Screen Size (5 - 10 Inches, and More), Display Technology (LCD, and More), Resolution (Full HD, and More), Installation Type (Stand-Alone, and More), Connectivity (Wi-Fi Only, and More), End-User Industry (Automotive, and More), and Geography (North America, and More). The Market Forecasts are Provided in Terms of Value (USD).
Global Smart Display Market Trends and Insights
Rising adoption of multimodal voice-first smart-home hubs in North America
Smart displays are evolving into visual-voice hybrids that orchestrate lighting, security, and entertainment systems from a single interface. Voice-assistant penetration is expected to reach 157.1 million U.S. users by 2026, underpinning device upgrades that handle richer commands and provide contextual visuals. Generative AI is enabling proactive suggestions-such as pre-warming thermostats based on commute data-raising perceived value. Samsung's Vision AI-equipped displays helped the company capture 28.3% of premium category shipments in 2024. Retailers are bundling displays with subscription services, driving recurring revenue and stickiness. Competitive intensity is heightening as Apple prepares its first smart home display, prompting ecosystem players to refresh line-ups annually.
Proliferation of Matter-compliant devices accelerating platform interoperability
Matter 1.4 introduced certified home routers that unify Wi-Fi and Thread, slashing onboarding failures and cutting installer time. By mid-2025 more than 1,000 Matter-certified products are expected, giving consumers confidence to mix brands without fearing lock-in. Enterprises view the protocol's secure commissioning as a step toward meeting zero-trust mandates, encouraging broader commercial rollouts. Utilities are exploring Matter-based energy dashboards to support demand-response programs. The standard also unlocks retrofit opportunities in hospitality, where existing Wi-Fi infrastructure can host Thread border routers without rewiring.
Security vulnerabilities in always-on microphones causing B2B procurement delays
Financial institutions and hospitals are pausing deployments until vendors document data pathways and prove on-device processing sufficiency. Procurement cycles have stretched by up to 45 days as CISOs demand penetration tests aligned with ISO 27001 requirements. Matter's optional offline mode eases some concerns but complicates central device management, prompting requests for hybrid architectures that add cost and integration complexity. Vendors that achieve FedRAMP-equivalent attestations are winning contracts faster, creating early-mover advantages.
Other drivers and restraints analyzed in the detailed report include:
- Automotive OEM integration of smart mirrors and pillar-to-pillar cockpit displays
- AI-powered contextual UI driving premium price mix in more than 10-inch category
- Persistent panel shortage in 8-10-inch LCD fabs limiting supply elasticity
For complete list of drivers and restraints, kindly check the Table Of Contents.
Segment Analysis
The smart display market size for voice-assistant devices reached USD 4.18 billion in 2025. Amazon Alexa held 33.12% market share in 2025, riding cross-sell momentum from Fire TV and Ring. Google Assistant followed through Nest hubs, while Alibaba's TmallGenie grew at 18.38% CAGR, buoyed by AI chatbot integration that localizes content for Chinese dialects. The smart display market size for voice-assistant devices reached USD 4.18 billion in 2025, and replacement demand is strengthening as generative models enable memory of prior conversations. Apple's March 2025 six-inch Home Display announcement signals fresh competition that may draw iOS households into its HomeKit universe.
Continued expansion of Mandarin-optimized large language models is eroding Alexa's edge in China, where Baidu DuerOS controlled 41.1% of mobile smart screens despite a 10.3 percentage-point decline. Brands are differentiating via visual search, kid-safe modes, and multimodal shopping carts that link QR-based checkout. These moves illustrate how the smart display market is fragmenting into region-specific experience layers even as Matter attempts to harmonize connectivity.
The 5-10-inch category dominated with 52.10% revenue in 2025 because it balances countertop space and viewing comfort. Kitchen recipes, bedroom alarms, and desk video calls mostly fit this diagonal, keeping BOM costs low. Yet the >10-inch cohort is expanding at a 18.92% CAGR as retailers, hospitals, and vehicle dashboards demand richer visuals. Wider panels invite split-screen modes for simultaneous video chats and smart-home dashboards, elevating user engagement metrics.
Average selling prices jump when diagonal exceeds 10 inches, improving manufacturer margins. OLED penetration is higher in this tier, helping the smart display market command premium price points. Panel makers are shifting capacity toward Gen 8.6 glass substrates to serve the large-format rush. Meanwhile, <5-inch devices remain in budget niches and as bedside companions, but their slice of the smart display market is shrinking under competition from wearables that already occupy the small-screen notification role.
LCD retained 81.05% share in 2025, thanks to mature supply chains and competitive pricing. Automotive instrument clusters often favor LTPS LCD for thermal stability and brightness. However, OLED's 21.35% CAGR is accelerating as vendors exploit its deep blacks and flexibility to fashion curved or rollable form factors. Smart mirrors in luxury hotels use OLED laminates to hide inactive displays behind reflective glass, commanding higher ARPU.
The smart display market size for OLED-based units is forecast to exceed USD 3.42 billion by 2031, aided by Gen 6 flexible fabs in South Korea and China. MicroLED research promises even higher luminance and lifespan, with printed transfer techniques edging closer to cost targets. Manufacturers are hedging by cross-licensing patents and mixing panel portfolios to avoid single-technology risk.
Complete Report Scope:
- By Voice Assistant
- Amazon Alexa
- Google Assistant
- Baidu DuerOS
- Alibaba TmallGenie
- Apple Siri
- Others
- By Screen Size
- Less than 5 Inches
- 5 - 10 Inches
- Above 10 Inches
- By Display Technology
- LCD
- OLED
- Others (Micro-LED, E-Paper)
- By Resolution
- HD (= 720p)
- Full HD (1080p)
- 4K and Above
- By Installation Type
- Stand-alone Smart Displays
- Integrated Smart Displays (smart mirrors, kiosk, shelf-edge)
- By Connectivity
- Wi-Fi Only
- Wi-Fi + Cellular
- Wi-Fi + Zigbee/Thread/Matter
- By End-user Industry
- Residential Smart Home
- Automotive
- Retail and Hospitality
- Healthcare
- Corporate and Education
- Others (Transportation Hubs, Public Sector)
- By Geography
- North America
- United States
- Canada
- Mexico
- Europe
- Germany
- United Kingdom
- France
- Italy
- Spain
- Nordics (Denmark, Sweden, Norway, Finland)
- Rest of Europe
- Asia-Pacific
- China
- Japan
- South Korea
- India
- Southeast Asia
- Australia
- Rest of Asia-Pacific
- South America
- Brazil
- Argentina
- Rest of South America
- Middle East
- Gulf Cooperation Council Countries
- Turkey
- Rest of Middle East
- Africa
- South Africa
- Nigeria
- Rest of Africa
- North America
Geography Analysis
Asia Pacific led the smart display market with 37.42% revenue share in 2025 and is set to compound at 17.05% CAGR through 2031. Chinese vendors such as Baidu and Alibaba responded to a 25.6% slump in 2024 smart-speaker shipments by layering large language models onto displays, resetting value propositions. Government-backed AI chip initiatives are lowering BOM costs, enabling sub-USD 100 large-screen models that widen rural penetration. South Korean brands focus on OLED innovation, leveraging local panel ecosystems to export premium units across the region.
North America remains a technology trendsetter with near-ubiquitous broadband and high voice-assistant uptake. Replacement cycles dominate growth as households swap first-generation screens for Matter-capable variants with superior microphones and edge AI. Amazon retained 29% of U.S. smart-speaker units, rolling out generative AI upgrades to Alexa that encourage upsells to larger Echo Show models. Apple's 2025 entry could lure a slice of the affluent iOS base, reshuffling vendor rankings.
Europe emphasizes privacy and sustainability, stimulating demand for devices with on-device processing and recycled materials. The European Smart Home market reached USD 22.11 billion in 2024, and energy-management features mandated by upcoming Ecodesign rules are steering procurement toward Matter-certified hubs that monitor consumption. Nordic adoption lags owing to voice-assistant language gaps, but regulatory clarity and subsidies for energy retrofits are expected to unlock latent demand. Emerging regions in South America, the Middle East, and Africa witness gradual uptake as smartphone OEMs bundle smaller screens to drive ecosystem stickiness, although price sensitivity and patchy connectivity temper volumes.
- Amazon.com Inc.
- Google LLC
- Baidu Inc.
- Alibaba Group Holding Ltd.
- Xiaomi Corp.
- Lenovo Group Ltd.
- LG Electronics Inc.
- Samsung Electronics Co., Ltd.
- Meta Platforms Inc. (Portal)
- Sony Corp.
- TCL Tech. Group
- Hisense Group
- Sharp Corp.
- Koninklijke Philips N.V.
- Panasonic Holdings Corp.
- Huawei Tech. Co. Ltd.
- BOE Technology Group Co. Ltd.
- Vizio Inc.
- JBL (Harman Int'l)
- Apple Inc.
Additional Benefits:
- The market estimate (ME) sheet in Excel format
- 3 months of analyst support
TABLE OF CONTENTS
1 INTRODUCTION
- 1.1 Study Assumptions and Market Definition
- 1.2 Scope of the Study
2 RESEARCH METHODOLOGY
3 EXECUTIVE SUMMARY
4 MARKET LANDSCAPE
- 4.1 Market Overview
- 4.2 Market Drivers
- 4.2.1 Rising adoption of multimodal voice-first smart-home hubs in North America
- 4.2.2 Proliferation of Matter-compliant devices accelerating platform interoperability
- 4.2.3 Automotive OEM integration of smart mirrors and pillar-to-pillar cockpit displays
- 4.2.4 AI-powered contextual UI driving premium price mix in Above 10-inch category, Asia-led
- 4.2.5 Retail demand for frictionless checkout and dynamic shelf-edge signage
- 4.2.6 Hospital bedside smart terminals improving patient engagement and HCAHPS scores
- 4.3 Market Restraints
- 4.3.1 Security vulnerabilities in always-on microphones causing B2B procurement delays
- 4.3.2 Persistent panel shortage in 8-10-inch LCD fabs limiting supply elasticity
- 4.3.3 Fragmented regional data-privacy mandates raising localisation costs
- 4.3.4 Voice-assistant language support gaps curbing uptake across Nordics and Caribbeans
5 INDUSTRY ECOSYSTEM ANALYSIS
6 TECHNOLOGICAL OUTLOOK
7 PORTER'S FIVE FORCES ANALYSIS
- 7.1 Porter's Five Forces
- 7.1.1 Bargaining Power of Suppliers
- 7.1.2 Bargaining Power of Buyers
- 7.1.3 Threat of New Entrants
- 7.1.4 Threat of Substitutes
- 7.1.5 Intensity of Competitive Rivalry
8 MARKET SIZE AND GROWTH FORECASTS (VALUES)
- 8.1 By Voice Assistant
- 8.1.1 Amazon Alexa
- 8.1.2 Google Assistant
- 8.1.3 Baidu DuerOS
- 8.1.4 Alibaba TmallGenie
- 8.1.5 Apple Siri
- 8.1.6 Others
- 8.2 By Screen Size
- 8.2.1 Less than 5 Inches
- 8.2.2 5 - 10 Inches
- 8.2.3 Above 10 Inches
- 8.3 By Display Technology
- 8.3.1 LCD
- 8.3.2 OLED
- 8.3.3 Others (Micro-LED, E-Paper)
- 8.4 By Resolution
- 8.4.1 HD (= 720p)
- 8.4.2 Full HD (1080p)
- 8.4.3 4K and Above
- 8.5 By Installation Type
- 8.5.1 Stand-alone Smart Displays
- 8.5.2 Integrated Smart Displays (smart mirrors, kiosk, shelf-edge)
- 8.6 By Connectivity
- 8.6.1 Wi-Fi Only
- 8.6.2 Wi-Fi + Cellular
- 8.6.3 Wi-Fi + Zigbee/Thread/Matter
- 8.7 By End-user Industry
- 8.7.1 Residential Smart Home
- 8.7.2 Automotive
- 8.7.3 Retail and Hospitality
- 8.7.4 Healthcare
- 8.7.5 Corporate and Education
- 8.7.6 Others (Transportation Hubs, Public Sector)
- 8.8 By Geography
- 8.8.1 North America
- 8.8.1.1 United States
- 8.8.1.2 Canada
- 8.8.1.3 Mexico
- 8.8.2 Europe
- 8.8.2.1 Germany
- 8.8.2.2 United Kingdom
- 8.8.2.3 France
- 8.8.2.4 Italy
- 8.8.2.5 Spain
- 8.8.2.6 Nordics (Denmark, Sweden, Norway, Finland)
- 8.8.2.7 Rest of Europe
- 8.8.3 Asia-Pacific
- 8.8.3.1 China
- 8.8.3.2 Japan
- 8.8.3.3 South Korea
- 8.8.3.4 India
- 8.8.3.5 Southeast Asia
- 8.8.3.6 Australia
- 8.8.3.7 Rest of Asia-Pacific
- 8.8.4 South America
- 8.8.4.1 Brazil
- 8.8.4.2 Argentina
- 8.8.4.3 Rest of South America
- 8.8.5 Middle East
- 8.8.5.1 Gulf Cooperation Council Countries
- 8.8.5.2 Turkey
- 8.8.5.3 Rest of Middle East
- 8.8.6 Africa
- 8.8.6.1 South Africa
- 8.8.6.2 Nigeria
- 8.8.6.3 Rest of Africa
- 8.8.1 North America
9 COMPETITIVE LANDSCAPE
- 9.1 Market Concentration
- 9.2 Strategic Moves
- 9.3 Market Share Analysis
- 9.4 Company Profiles (includes Global level Overview, Market level overview, Core Segments, Financials as available, Strategic Information, Market Rank/Share for key companies, Products and Services, and Recent Developments)
- 9.4.1 Amazon.com Inc.
- 9.4.2 Google LLC
- 9.4.3 Baidu Inc.
- 9.4.4 Alibaba Group Holding Ltd.
- 9.4.5 Xiaomi Corp.
- 9.4.6 Lenovo Group Ltd.
- 9.4.7 LG Electronics Inc.
- 9.4.8 Samsung Electronics Co., Ltd.
- 9.4.9 Meta Platforms Inc. (Portal)
- 9.4.10 Sony Corp.
- 9.4.11 TCL Tech. Group
- 9.4.12 Hisense Group
- 9.4.13 Sharp Corp.
- 9.4.14 Koninklijke Philips N.V.
- 9.4.15 Panasonic Holdings Corp.
- 9.4.16 Huawei Tech. Co. Ltd.
- 9.4.17 BOE Technology Group Co. Ltd.
- 9.4.18 Vizio Inc.
- 9.4.19 JBL (Harman Int'l)
- 9.4.20 Apple Inc.
10 MARKET OPPORTUNITIES AND FUTURE OUTLOOK
- 10.1 White-space and Unmet-Need Assessment

 智慧顯示器市場-2026-2032年全球市場預測
 全球智慧顯示器市場
 智慧顯示器市場報告:按類型、顯示尺寸、解析度、最終用戶和地區分類(2026-2034 年)
 2026-2034年全球教育智慧顯示器市場規模、佔有率、趨勢和成長分析報告教育智慧顯示器市場:2026-2032年全球市場預測(依產品類型、定價模式、應用、最終用戶及通路分類)
 智慧顯示器市場分析及預測(至2035年):依類型、產品類型、服務、技術、組件、應用、外形、最終用戶及功能分類日本智慧顯示器市場規模、佔有率、趨勢及預測(按類型、顯示器尺寸、解析度、最終用戶和地區分類),2026-2034年
 2026年全球感溫變色智慧窗戶顯示市場報告2026年全球智慧顯示器市場報告
 智慧顯示器市場-全球產業規模、佔有率、趨勢、機會、預測:按類型、技術、最終用戶、地區和競爭格局分類,2021-2031年