


 |
市場調查報告書
商品編碼
2123694
關節機器人:市場佔有率分析、產業趨勢與統計、成長預測(2026-2031)Articulated Robot - Market Share Analysis, Industry Trends & Statistics, Growth Forecasts (2026 - 2031) |
||||||

※ 本網頁內容可能與最新版本有所差異。詳細情況請與我們聯繫。
根據 Mordor Intelligence 估計,關節機器人市場在 2026 年的價值將達到 305.6 億美元,高於 2025 年的 269.2 億美元,預計到 2031 年將達到 576.3 億美元。
預計從 2026 年到 2031 年,其複合年成長率將達到 13.52%。
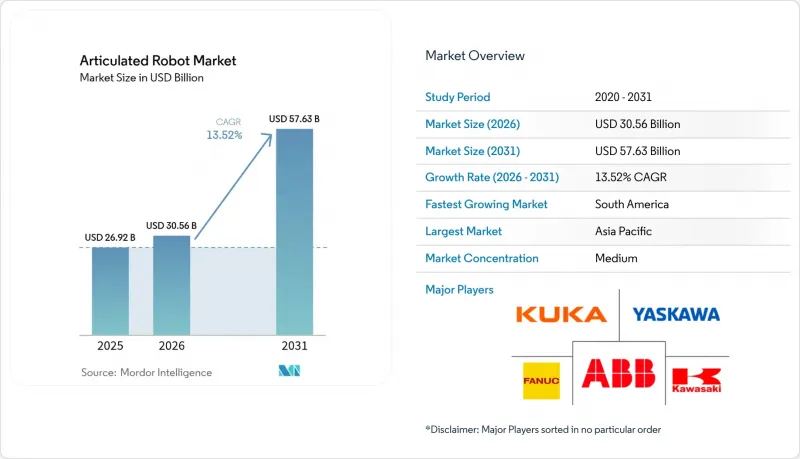
本報告承重能力(16公斤以下、16-60公斤以上)、軸數(4軸、5軸及以上)、應用領域(物料輸送、焊接/釬焊、組裝、噴塗/點膠等)、終端用戶行業(汽車、電氣/電子、金屬/機械、製藥/醫療設備等)和地區進行細分。市場預測以美元計價。
全球關節機器人市場趨勢及洞察
向工業4.0主導的自動化轉型
製造商正在建立封閉回路型生產生態系統,透過將關節型機器人與人工智慧分析和物聯網感測器整合,實現品質、運轉率和能耗的自主最佳化。富士康的「熄燈工廠」透過將預測性維護演算法融入機器人工作單元,在減少15萬名員工的同時,維持了產量。小米的全天候智慧型手機運作工廠也展示了這種「暗工廠」模式的擴充性。這些應用正在改變自動化的經濟效益,使其從“取代人工”轉向“產品組合的柔軟性”,從而實現生產線的快速切換,以適應客製化批次和新變體。
人事費用上升和技術純熟勞工短缺
目前,機器人的運作成本在每小時1.60美元至2美元之間,低於許多地區超過5.50美元的人事費用,因此,投資報酬率(ROI)的計算結果顯然更有利於自動化。通用汽車(GM)和約翰迪爾公司在引入機器人焊接單元後,焊接人事費用降低了50%,缺陷率降低了25%。像GXO物流這樣的倉儲業者正在引進Apollo人形機器人,以提高安全指標並彌補勞動力短缺。歐洲和東亞人口的老化也將長期推動這一趨勢。
較高的初始實施和整合成本
如果將系統整合、安全設備和培訓成本都考慮在內,關節型機器人單元的總成本可能會翻倍,這成為中小企業採用該技術的一大障礙。拉丁美洲的中小企業指出,整合商資源有限和資金籌措匱乏是採用此技術的主要障礙。 「機器人即服務 (RaaS)」模式透過將資本支出 (CapEx) 轉化為營運支出 (OpEx) 來緩解此限制。 Formic 公司報告稱,其已達成一項 20 萬生產小時的契約,運轉率高達收費%,這凸顯了投資者對基於使用量的自動化模式的高度興趣。
細分市場分析
預計16公斤以下級別的機器人將以15.42%的複合年成長率超越其他所有級別,這主要得益於電子、製藥和協作機器人行業的廣泛應用。同時,到2025年,16-60公斤等級的機器人將佔據關節機器人市場佔有率的32.54%。使用者青睞輕型平台,因為它們速度快、能效高,並且在人機協作方面更加安全。 Freedom Fresh Australia的澳洲堅果生產線採用輕型SCARA機器人,實現了0.39秒的循環時間,顯著提高了食品包裝行業的生產效率。對能源效率的需求也推動了材料創新。 Cognibotics的碳纖維機械手臂在保持剛性的同時,將能耗降低了90%。
汽車車身製造廠和鑄造廠對60-225公斤及225公斤以上機器人的需求保持穩定,但隨著原始設備製造商(OEM)將重點放在提高現有設備的運轉率而非擴建廠房上,市場成長速度正在放緩。形狀記憶合金夾爪可降低90%的氣壓能耗,因此正擴大應用於高承重能力機械手臂。預計2026年至2031年,大型關節機器人的市場規模將以個位數的成長率成長,這主要得益於電動車電池組和風力發電機機零件搬運需求的推動。
到2025年,六軸機器人將佔總銷售量的51.35%,鞏固其作為焊接、噴塗和精密組裝旗艦機型的地位,從而推動關節型機器人市場的發展。價格區間廣泛,從輕型機型的5000美元以下到無塵室機型的50萬美元以上不等。模組化控制器縮小了面積,為空間有限的中小型企業提供了顯著優勢。
七軸和超靈巧機器人是成長最快的細分市場,年複合成長率高達15.98%。 Yamaha的YA系列機器人能夠縮短高密度生產單元的循環時間,因為其肘關節可以圍繞狹窄的夾具旋轉。 MDPI公司對並聯拓樸機器人的研究有望在取放任務中實現更高的剛度重量比。隨著汽車內裝日益複雜,消費性電子產品不斷小型化,對用於在狹小空間內移動的額外軸的需求只會不斷成長。
區域分析
亞太地區受中國市場規模和日本創新生態系統的驅動,預計2025年將佔全球銷售額的42.05%,繼續保持其主導地位。各地區政府都在資助開創性項目,以加速中小企業採用機器人技術,從而穩定關節型機器人市場的成長,儘管國內薪資上漲導致成本優勢減弱。在日本「機器人稅額扣抵」和韓國「人工智慧代金券計畫」等措施的推動下,相關項目依然活躍。
預計到2031年,南美洲將以14.86%的複合年成長率實現最快成長,這主要得益於外國直接投資對汽車電氣化和農業自動化的推動。巴西的SOLIX田間機器人便是人工智慧視覺技術如何將關節型機器人設計應用於田間作物管理的典範。凱斯紐荷蘭公司斥資2000萬美元對索羅卡巴工廠維修,利用人工智慧控制收割機90%的功能,顯示該地區對先進機器人技術有著巨大的需求。
在北美,由於聯邦政府鼓勵生產回流和電動車供應鏈計畫的激勵措施,2024年部署的機器人數量達到44,303台,比上年成長12%。歐洲雖然面臨能源價格飆升帶來的不利影響,但仍持續投資本地產能。安川電機在斯洛維尼亞投資3,150萬歐元的工廠計畫在2027年實現其向歐洲、中東和非洲地區(EMEA)交付的機器人80%在當地生產。中東和非洲仍處於發展階段,但建築和石化工廠維護領域的試點計畫正在進行,為關節型機器人的長期普及奠定了基礎。
其他好處:
- Excel格式的市場預測(ME)表
- 3個月的分析師支持
目錄
第1章:引言
- 研究假設和市場定義
- 調查範圍
第2章:調查方法
第3章執行摘要
第4章 市場狀況
- 市場概覽
- 市場促進因素
- 向工業4.0主導的自動化轉型
- 人事費用上升和技術純熟勞工短缺
- 政府對智慧製造的支持措施
- 汽車電動出行領域的資本投資激增。
- 人工智慧驅動的自適應關節協作機器人
- 大型電子商務公司正在實現其履約中心的自動化。
- 市場限制因素
- 收購和整合的初期成本相對較高。
- 系統整合人員短缺
- 網路連接機器人控制器的網路安全風險
- 伺服馬達和半導體供不應求
- 產業價值鏈分析
- 監理情勢
- 技術展望
- 產業吸引力—五力分析
- 新進入者的威脅
- 買方的議價能力
- 供應商的議價能力
- 替代品的威脅
- 競爭公司之間的競爭
- 宏觀經濟因素對市場的影響
第5章 市場規模與成長預測
- 按有效載荷能力
- 16公斤或以下
- 16~60 kg
- 60~225 kg
- 225公斤或以上
- 按軸類型
- 四軸
- 5軸
- 六軸
- 7 個或更多軸
- 透過使用
- 物料輸送
- 焊接和釬焊
- 組裝
- 油漆和塗層
- 包裝和托盤堆垛
- 檢驗和品質保證
- 其他
- 按最終用戶行業分類
- 車
- 電氣和電子設備
- 金屬和機械
- 藥品和醫療設備
- 食品/飲料
- 電子商務與物流
- 其他終端用戶產業
- 按地區
- 北美洲
- 美國
- 加拿大
- 墨西哥
- 南美洲
- 巴西
- 阿根廷
- 智利
- 其他南美國家
- 歐洲
- 德國
- 英國
- 法國
- 義大利
- 西班牙
- 俄羅斯
- 其他歐洲國家
- 亞太地區
- 中國
- 印度
- 日本
- 韓國
- 新加坡
- 馬來西亞
- 澳洲
- 其他亞太國家
- 中東和非洲
- 中東
- 阿拉伯聯合大公國
- 沙烏地阿拉伯
- 土耳其
- 其他中東國家
- 非洲
- 南非
- 奈及利亞
- 埃及
- 其他非洲國家
- 中東
- 北美洲
第6章 競爭情勢
- 市場集中度
- 策略趨勢
- 市佔率分析
- 公司簡介
- ABB Ltd.
- FANUC Corporation
- Yaskawa Electric Corp.
- KUKA AG
- Kawasaki Heavy Industries Ltd.
- Mitsubishi Electric Corp.
- Nachi-Fujikoshi Corp.
- DENSO Corp.
- Seiko Epson Corp.
- Staubli International AG
- Hyundai Robotics Co., Ltd.
- Comau SpA
- Omron Adept Technology Inc.
- Universal Robots A/S
- Durr AG(Paint Robots)
- Estun Automation Co., Ltd.
- SIASUN Robot & Automation Co.
- JAKA Robotics Ltd.
- Techman Robot Inc.
- Precise Automation Inc.
- CMA Robotics SpA
- Gudel Group AG
- IAI Corporation
- Aubo Robotics Inc.
- Robot Industrial Association(RIA)
第7章 市場機會與未來趨勢
- 評估閒置頻段和未滿足的需求
According to Mordor Intelligence, articulated robot market size in 2026 is estimated at USD 30.56 billion, growing from 2025 value of USD 26.92 billion with 2031 projections showing USD 57.63 billion, growing at 13.52% CAGR over 2026-2031.
This report is Segmented by Payload Capacity (Up To 16 Kg, 16 - 60 Kg, and More), Axis Type (4-Axis, 5-Axis, and More), Application (Material Handling, Welding and Soldering, Assembly, Painting and Dispensing, and More), End-User Industry (Automotive, Electrical and Electronics, Metals and Machinery, Pharmaceutical and Medical Devices, and More), and Geography. The Market Forecasts are Provided in Terms of Value (USD).
Global Articulated Robot Market Trends and Insights
Shift toward Industry 4.0-led automation
Manufacturers are linking articulated robots with AI analytics and IoT sensors to create closed-loop production ecosystems that self-optimise quality, uptime, and energy consumption. Foxconn's lights-off sites cut headcount by 150,000 yet sustained output by embedding predictive-maintenance algorithms in robotic workcells. Xiaomi's 24/7 smartphone facility demonstrates the scalability of such dark-factory models. These deployments shift automation economics from manpower substitution to product-mix agility, enabling rapid re-tooling for customised lots and variant introductions.
Rising labor cost and skilled-worker shortage
Robot operating costs of USD 1.60-2.00 per hour now undercut human wages exceeding USD 5.50 in many regions, tilting ROI calculations decisively toward automation. General Motors and John Deere trimmed welding labor expenses by 50% and defects by 25% after adopting robotic welding cells. Warehouse operators such as GXO Logistics have turned to Apollo humanoids to bridge head-count gaps while improving safety metrics. Ageing demographics in Europe and East Asia anchor this driver for the long term.
High upfront acquisition and integration cost
Total cost of an articulated robot cell can double once integration, safety equipment, and training are included, discouraging smaller enterprises. Latin American SMEs cite limited access to integrators and finance as key barriers to adoption. Robots-as-a-Service models mitigate this restraint by converting cap-ex into opex; Formic reported 200,000 contracted production hours at 99.8% uptime, highlighting investor appetite for pay-per-use automation.
Other drivers and restraints analyzed in the detailed report include:
- Government incentives for smart manufacturing
- Automotive e-mobility cap-ex boom
- Servo-motor and semiconductor supply bottlenecks
For complete list of drivers and restraints, kindly check the Table Of Contents.
Segment Analysis
The <= 16 kg class is projected to outpace all others at a 15.42% CAGR on the back of electronics, pharma, and collaborative deployments, whereas the 16-60 kg segment retained 32.54% of articulated robot market share in 2025. Users favour lighter platforms for speed, energy thrift, and human-adjacent safety. Freedom Fresh Australia's macadamia line runs 0.39-second cycles with a lightweight SCARA unit, underscoring productivity gains in food packing. Energy-efficiency pressures are driving material innovations: carbon-fibre arms from Cognibotics cut consumption by 90% while maintaining rigidity.
Demand for 60-225 kg and > 225 kg robots remains stable in automotive body-shop and foundry tasks, yet growth decelerates as OEMs sweat installed assets rather than expand footprint. High-payload arms increasingly integrate shape-memory alloy grippers that slash pneumatic energy use by 90%. Over 2026-2031, the articulated robot market size for heavy-duty classes is forecast to expand at single-digit rates, supported by EV battery pack lifting and wind-turbine component handling.
Six-axis models captured 51.35% of revenue in 2025, anchoring the articulated robot market as the de-facto workhorse for welding, painting and precision assembly. Cost points now span under USD 5,000 for light units to beyond USD 500,000 for clean-room variants. Modular controllers are shrinking installation footprints, a boon for SMEs with space constraints.
Seven-axis and hyper-dexterous formats are the fastest-rising niche, charting a 15.98% CAGR. Yamaha's YA series elbows rotate around confined fixtures, enabling shorter takt times in dense production cells. Parallel-topology robots studied by MDPI promise higher stiffness-to-weight ratios for pick-and-place cycles. As automotive interiors grow more complex and consumer electronics trend toward miniaturisation, demand for extra axes to navigate tight envelopes will intensify.
Complete Report Scope:
- By Payload Capacity
- Up to 16 kg
- 16 - 60 kg
- 60 - 225 kg
- Above 225 kg
- By Axis Type
- 4-Axis
- 5-Axis
- 6-Axis
- 7-Axis and Above
- By Application
- Material Handling
- Welding and Soldering
- Assembly
- Painting and Dispensing
- Packaging and Palletizing
- Inspection and Quality Assurance
- Others
- By End-user Industry
- Automotive
- Electrical and Electronics
- Metals and Machinery
- Pharmaceutical and Medical Devices
- Food and Beverages
- E-commerce and Logistics
- Other End-User Industries
- By Geography
- North America
- United States
- Canada
- Mexico
- South America
- Brazil
- Argentina
- Chile
- Rest of South America
- Europe
- Germany
- United Kingdom
- France
- Italy
- Spain
- Russia
- Rest of Europe
- Asia-Pacific
- China
- India
- Japan
- South Korea
- Singapore
- Malaysia
- Australia
- Rest of Asia-Pacific
- Middle East and Africa
- Middle East
- United Arab Emirates
- Saudi Arabia
- Turkey
- Rest of Middle East
- Africa
- South Africa
- Nigeria
- Egypt
- Rest of Africa
- Middle East
- North America
Geography Analysis
Asia-Pacific retained its dominance with 42.05% revenue in 2025, propelled by China's scale and Japan's innovation ecosystems. Regional governments fund lighthouse projects that accelerate SME uptake, stabilising articulated robot market size gains even as domestic wage growth tempers cost advantages. Japan's Robot Tax Credit and Korea's AI Voucher Scheme keep pipeline activity robust.
South America is forecast to grow the fastest at 14.86% CAGR through 2031, underwritten by foreign direct investments in automotive electrification and agri-automation. Brazil's SOLIX field robot shows how AI vision extends articulated design into open-field crop management. Case IH's USD 20 million Sorocaba upgrade embeds AI to command 90% harvester functions, demonstrating regional appetite for advanced robotics.
North America posted 12% year-on-year installation growth in 2024-totaling 44,303 units-supported by federal reshoring incentives and EV supply-chain projects. Europe faces energy-price headwinds yet invests in local capacity; Yaskawa's EUR 31.5 million Slovenian hub will localise 80% of EMEA robot deliveries by 2027. The Middle East and Africa remain nascent but attract pilots in construction and petrochemical maintenance, laying the groundwork for long-run articulated robot market adoption.
- ABB Ltd.
- FANUC Corporation
- Yaskawa Electric Corp.
- KUKA AG
- Kawasaki Heavy Industries Ltd.
- Mitsubishi Electric Corp.
- Nachi-Fujikoshi Corp.
- DENSO Corp.
- Seiko Epson Corp.
- Staubli International AG
- Hyundai Robotics Co., Ltd.
- Comau SpA
- Omron Adept Technology Inc.
- Universal Robots A/S
- Durr AG (Paint Robots)
- Estun Automation Co., Ltd.
- SIASUN Robot & Automation Co.
- JAKA Robotics Ltd.
- Techman Robot Inc.
- Precise Automation Inc.
- CMA Robotics SpA
- Gudel Group AG
- IAI Corporation
- Aubo Robotics Inc.
- Robot Industrial Association (RIA)
Additional Benefits:
- The market estimate (ME) sheet in Excel format
- 3 months of analyst support
TABLE OF CONTENTS
1 INTRODUCTION
- 1.1 Study Assumptions and Market Definition
- 1.2 Scope of the Study
2 RESEARCH METHODOLOGY
3 EXECUTIVE SUMMARY
4 MARKET LANDSCAPE
- 4.1 Market Overview
- 4.2 Market Drivers
- 4.2.1 Shift toward Industry 4.0-led automation
- 4.2.2 Rising labor cost and skilled-worker shortage
- 4.2.3 Government incentives for smart manufacturing
- 4.2.4 Automotive e-mobility cap-ex boom
- 4.2.5 AI-enabled adaptive articulated cobots
- 4.2.6 Fulfilment-center automation by e-commerce majors
- 4.3 Market Restraints
- 4.3.1 High upfront acquisition and integration cost
- 4.3.2 Scarcity of system-integration talent
- 4.3.3 Cyber-security risk in connected robot controllers
- 4.3.4 Servo-motor and semiconductor supply bottlenecks
- 4.4 Industry Value Chain Analysis
- 4.5 Regulatory Landscape
- 4.6 Technological Outlook
- 4.7 Industry Attractiveness - Porter's Five Forces Analysis
- 4.7.1 Threat of New Entrants
- 4.7.2 Bargaining Power of Buyers
- 4.7.3 Bargaining Power of Suppliers
- 4.7.4 Threat of Substitutes
- 4.7.5 Intensity of Competitive Rivalry
- 4.8 Impact of Macroeconomic Factors on the Market
5 MARKET SIZE AND GROWTH FORECASTS (VALUES)
- 5.1 By Payload Capacity
- 5.1.1 Up to 16 kg
- 5.1.2 16 - 60 kg
- 5.1.3 60 - 225 kg
- 5.1.4 Above 225 kg
- 5.2 By Axis Type
- 5.2.1 4-Axis
- 5.2.2 5-Axis
- 5.2.3 6-Axis
- 5.2.4 7-Axis and Above
- 5.3 By Application
- 5.3.1 Material Handling
- 5.3.2 Welding and Soldering
- 5.3.3 Assembly
- 5.3.4 Painting and Dispensing
- 5.3.5 Packaging and Palletizing
- 5.3.6 Inspection and Quality Assurance
- 5.3.7 Others
- 5.4 By End-user Industry
- 5.4.1 Automotive
- 5.4.2 Electrical and Electronics
- 5.4.3 Metals and Machinery
- 5.4.4 Pharmaceutical and Medical Devices
- 5.4.5 Food and Beverages
- 5.4.6 E-commerce and Logistics
- 5.4.7 Other End-User Industries
- 5.5 By Geography
- 5.5.1 North America
- 5.5.1.1 United States
- 5.5.1.2 Canada
- 5.5.1.3 Mexico
- 5.5.2 South America
- 5.5.2.1 Brazil
- 5.5.2.2 Argentina
- 5.5.2.3 Chile
- 5.5.2.4 Rest of South America
- 5.5.3 Europe
- 5.5.3.1 Germany
- 5.5.3.2 United Kingdom
- 5.5.3.3 France
- 5.5.3.4 Italy
- 5.5.3.5 Spain
- 5.5.3.6 Russia
- 5.5.3.7 Rest of Europe
- 5.5.4 Asia-Pacific
- 5.5.4.1 China
- 5.5.4.2 India
- 5.5.4.3 Japan
- 5.5.4.4 South Korea
- 5.5.4.5 Singapore
- 5.5.4.6 Malaysia
- 5.5.4.7 Australia
- 5.5.4.8 Rest of Asia-Pacific
- 5.5.5 Middle East and Africa
- 5.5.5.1 Middle East
- 5.5.5.1.1 United Arab Emirates
- 5.5.5.1.2 Saudi Arabia
- 5.5.5.1.3 Turkey
- 5.5.5.1.4 Rest of Middle East
- 5.5.5.2 Africa
- 5.5.5.2.1 South Africa
- 5.5.5.2.2 Nigeria
- 5.5.5.2.3 Egypt
- 5.5.5.2.4 Rest of Africa
- 5.5.5.1 Middle East
- 5.5.1 North America
6 COMPETITIVE LANDSCAPE
- 6.1 Market Concentration
- 6.2 Strategic Moves
- 6.3 Market Share Analysis
- 6.4 Company Profiles (includes Global level Overview, Market level overview, Core Segments, Financials as available, Strategic Information, Market Rank/Share for key companies, Products and Services, and Recent Developments)
- 6.4.1 ABB Ltd.
- 6.4.2 FANUC Corporation
- 6.4.3 Yaskawa Electric Corp.
- 6.4.4 KUKA AG
- 6.4.5 Kawasaki Heavy Industries Ltd.
- 6.4.6 Mitsubishi Electric Corp.
- 6.4.7 Nachi-Fujikoshi Corp.
- 6.4.8 DENSO Corp.
- 6.4.9 Seiko Epson Corp.
- 6.4.10 Staubli International AG
- 6.4.11 Hyundai Robotics Co., Ltd.
- 6.4.12 Comau SpA
- 6.4.13 Omron Adept Technology Inc.
- 6.4.14 Universal Robots A/S
- 6.4.15 Durr AG (Paint Robots)
- 6.4.16 Estun Automation Co., Ltd.
- 6.4.17 SIASUN Robot & Automation Co.
- 6.4.18 JAKA Robotics Ltd.
- 6.4.19 Techman Robot Inc.
- 6.4.20 Precise Automation Inc.
- 6.4.21 CMA Robotics SpA
- 6.4.22 Gudel Group AG
- 6.4.23 IAI Corporation
- 6.4.24 Aubo Robotics Inc.
- 6.4.25 Robot Industrial Association (RIA)
7 MARKET OPPORTUNITIES AND FUTURE TRENDS
- 7.1 White-Space and Unmet-Need Assessment

 升降臂偵測機器人市場:全球市場預測,2026-2032年關節式焊接機器人市場:全球市場預測,2026-2032年
 2026-2030年全球關節機器人市場
 空心腕部機器人市場分析與預測(至2035年):類型、產品類型、技術、組件、應用、最終用戶、功能、安裝方式、解決方案關節型機器人市場-2026-2032年全球市場預測
 關節型機器人市場報告:按負載容量、功能、類型、組件、最終用途行業和地區分類(2026-2034 年)
 2026年全球關節機器人市場報告
 關節型機器人市場 - 全球產業規模、佔有率、趨勢、機會、預測(按有效載荷、功能、產業、地區和競爭格局分類),2021-2031年
 按有效載荷、功能、行業和地區分類的關節型機器人市場規模、佔有率和成長分析 - 2026-2033 年行業預測
 關節機器人市場:2025-2030 年預測