


 |
市場調查報告書
商品編碼
2123596
永續包裝:市場佔有率分析、產業趨勢與統計、成長預測(2026-2031)Sustainable Packaging - Market Share Analysis, Industry Trends & Statistics, Growth Forecasts (2026 - 2031) |
||||||

※ 本網頁內容可能與最新版本有所差異。詳細情況請與我們聯繫。
據 Mordor Intelligence 稱,2025 年永續包裝市場價值為 3,038 億美元,預計到 2031 年將達到 4,634.1 億美元,而 2026 年為 3,259.4 億美元,預測期(2026-2031 年)的複合年成長率為 7.29%。
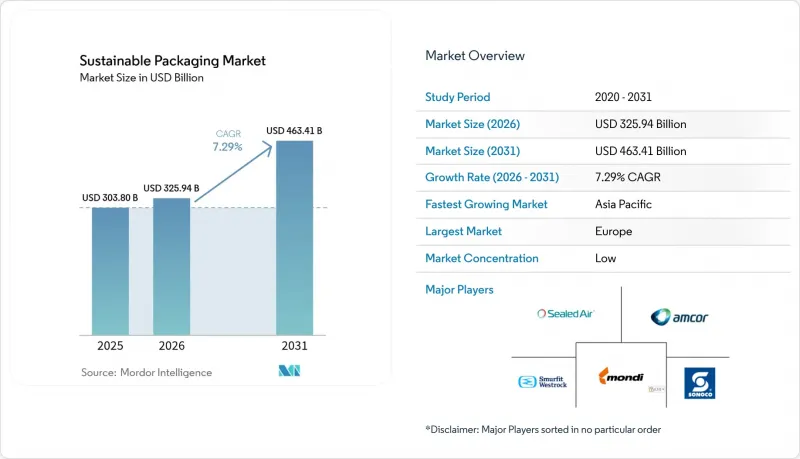
本報告按工藝(可重複使用、可回收、其他)、材料類型(紙/紙板、塑膠、其他)、包裝形式(硬質、軟質)、功能(初級包裝、二級包裝、三級包裝/運輸包裝)、最終用戶(食品飲料、醫藥/醫療、化妝品/個人護理、其他)和地區進行細分。市場預測以美元計價。
全球永續包裝市場趨勢與洞察
生產者延伸責任法(EPR法案)促進統一合規。
63個司法管轄區對生產者延伸責任制(EPR)法規的協調統一正在消除監管碎片化現象。歐盟的《包裝和包裝廢棄物法規》將於2025年2月生效,該法規設定了PET食品包裝30%的再生材料目標,並禁止使用PFAS,促使經合組織和金磚國家也採納了類似的框架。肯亞的新法規採用了歐盟的收費系統,而奧勒岡州和科羅拉多將從2025年7月起要求品牌方設立由其出資的生產者責任組織(PRO)。統一的時間表使全球品牌能夠大規模部署單一設計解決方案,從而降低合規成本,並加速永續包裝市場的發展。
品牌推廣活動正在推動 PCR 內容標準化,使其超過監管最低標準。
如今,大型消費品公司正超越法律要求,承諾到2030年,其所有產品系列中消費後回收(PCR)材料的含量達25%至50%。聯合利華的目標是到2025年實現所有包裝可回收、可重複使用或可堆肥,安姆科承諾為吉百利的包裝供應1000噸再生塑膠,這些都是自願性目標逐漸成為行業標準的典型例子。美國塑膠公約下的標準化PCR檢測工具包正在簡化檢驗流程,提高採購透明度,並促進永續包裝市場的成長。
PCR樹脂供應受限,造成了戰略瓶頸。
目前,品牌承諾的透明食品級消費後回收材料(PCR)供應量超過了實際供應量。牛奶產量下降導致天然來源的高密度聚乙烯(HDPE)供應減少,推高了高價,迫使企業依賴進口,這給國內回收企業帶來了壓力。這種供需失衡威脅到監管配額的及時完成,並阻礙了永續包裝市場向大眾市場的擴張。
細分市場分析
預計到2025年,可回收包裝的比例將維持在44.88%,而可堆肥和可生物分解產品的複合年成長率將達到12.32%,這反映出投資者對B'Zeos等生物材料(例如其海藻薄膜)的信心。可堆肥永續包裝市場的規模主要受餐飲服務業和個人護理品牌的需求驅動,這些品牌尋求的是不涉及微塑膠碎片化的解決方案。然而,美國祇有30%的城市擁有工業堆肥設施,阻礙了短期市場滲透。為了解決這個問題,美國《堆肥法案》(COMPOST Act)提案津貼20億美元擴大處理能力。如果該法案得以實施,將直接提高廢棄物回收率和長期成長前景。
消費者對有機廢棄物處理方法的困惑持續導致有機廢棄物污染,凸顯了更清晰的標籤和公眾宣傳宣傳活動的必要性。厭氧消化正逐漸成為一種替代方案,它透過沼氣發電提高專案經濟效益,並部分彌補基礎設施的不足。隨著政策和處理流程的差距逐步縮小,可生物分解包裝可望在永續包裝市場中佔據越來越大的佔有率。
2025年,紙張和紙板佔銷售額的39.96%,主要得益於成熟的回收系統和消費者信心的增強。同時,植物來源基材以11.21%的複合年成長率成長,其中斯特拉勒恩索的干模塑纖維線表現尤為突出,該生產線可減少75%的用水量和30%的能源消耗,從而增強了其與循環經濟的契合度。隨著PFAS禁令的實施和對再生材料含量監管的日益嚴格,聚烯在永續包裝市場的佔有率預計將逐步下降。
包括加州大學柏克萊分校260 度C汽化製程在內的先進回收創新技術,可將聚乙烯轉化為原料,回收率高達98%,進而實現食品級回收循環,同時減少降級回收。菌絲泡棉和木質PET替代品的應用範圍正在拓展,不再局限於小眾領域,這預示著永續包裝市場正在發生更廣泛的材料轉型。
區域分析
歐洲預計到2025年將佔據34.18%的市場佔有率,這主要得益於其開創性的監管政策,該政策培育了成熟的回收基礎設施和生態設計標準。根據循環利用績效調整生產者責任延伸(EPR)費用,鼓勵使用高比例再生材料包裝,並強化供應商的創新週期。統一的押金返還系統簡化了回收流程,使歐洲成為先進回收試點計畫和生物基材料商業化的標竿市場。眾多跨國品牌總部設在該地區,進一步提高了市場需求密度,確保永續包裝市場能夠持續在當地檢驗和推廣創新技術。
亞太地區預計將以11.05%的複合年成長率實現最高增速,主要得益於日本、韓國和澳洲更為嚴格的監管,以及中國和印度引入生產者延伸責任制(EPR)框架檢查。日本將於2024年強制實施再生塑膠使用政策,並於2025年6月生效食品接觸用再生塑膠正面表列,將催生高利潤應用領域,並刺激國內塑膠再加工領域的投資。中國在再生塑膠監管措施方面的進展,以及電子商務的強勁成長,正在加速其應用範圍的擴大。越南紙包裝產業預計到2026年將達到35億美元,象徵以出口為導向的製造業推動的區域擴張。
在北美,各州推行的生產者延伸責任制(EPR)以及大型消費品公司積極主動的自願措施正在推動這一領域的發展。奧勒岡州、科羅拉多和加州的計畫正在資助改善家庭垃圾收集系統,從而擴大消費後再生塑膠(PCR)原料的供應,並縮小成本差距。以澳洲近期針對高樂氏公司的訴訟為例,有關「綠色清洗」的訴訟促使企業加強資訊揭露,增強消費者信心,並推動建立更透明的供應鏈。中東、非洲和南美洲仍在發展中,但政策正在迅速趨同,隨著基礎設施的擴展,尚未開發的市場機會正為早期進入的科技公司敞開大門。
其他好處
- Excel格式的市場預測(ME)表
- 3個月的分析師支持
目錄
第1章:引言
- 研究假設和市場定義
- 調查範圍
第2章:調查方法
第3章執行摘要
第4章 市場狀況
- 市場概覽
- 市場促進因素
- 經合組織和金磚國家擴大了生產者延伸責任制(EPR)法律的實施範圍
- 品牌擁有者承諾所有產品組合中的消費後回收成分 (PCR) 含量超過 25%。
- 擴大電子商務物流零售商回收再利用試點項目
- 人工智慧分類技術提高了廢棄舊產品的回收率。
- 食品級聚烯化學回收技術取得突破性進展
- 一家新公司已成功從創業投資資金籌措,用於開發其從菌絲體和海藻中提取的包裝材料。
- 市場限制因素
- 高品質PCR樹脂的供需缺口
- 通貨膨脹主導原生材料成本溢價
- 北美和亞太地區堆肥基礎設施分散
- 由於面臨「綠色清洗」訴訟風險,行銷聲明改變
- 供應鏈分析
- 監理情勢
- 技術展望
- 波特五力分析
- 評估微觀經濟因素的影響
第5章 市場規模與成長預測
- 透過流程
- 可重複使用的包裝
- 可回收包裝
- 可堆肥和可生物分解的包裝
- 可食用包裝
- 依材料類型
- 紙張和紙板
- 塑膠
- 玻璃
- 金屬(鋁、鋼)
- 植物來源材料(甘蔗渣、蘑菇等)
- 按包裝類型
- 難的
- 柔軟的
- 按功能
- 初級包裝
- 二級包裝
- 三級包裝/運輸包裝
- 最終用戶
- 飲食
- 藥品和醫療保健
- 化妝品和個人護理
- 電子商務與零售
- 家用電子產品
- 其他
- 按地區
- 北美洲
- 美國
- 加拿大
- 墨西哥
- 歐洲
- 德國
- 英國
- 法國
- 義大利
- 西班牙
- 俄羅斯
- 其他歐洲國家
- 亞太地區
- 中國
- 印度
- 日本
- 韓國
- 澳洲和紐西蘭
- 其他亞太國家
- 中東和非洲
- 中東
- 阿拉伯聯合大公國
- 沙烏地阿拉伯
- 土耳其
- 其他中東國家
- 非洲
- 南非
- 奈及利亞
- 埃及
- 其他非洲地區
- 中東
- 南美洲
- 巴西
- 阿根廷
- 南美洲其他地區
- 北美洲
第6章 競爭情勢
- 市場集中度
- 策略趨勢
- 市佔率分析
- 公司簡介
- Amcor plc
- Smurfit WestRock Company
- Tetra Pak International SA
- Sonoco Products Company
- Sealed Air Corporation
- Mondi plc
- Huhtamaki Oyj
- BASF SE
- Ardagh Group SA
- Ball Corporation
- Crown Holdings Inc.
- Genpak LLC
- International Paper Company
- Stora Enso Oyj
- Graphic Packaging Holding Co.
- Uflex Ltd.
- Novolex Holdings Inc.
- Ecovative LLC
第7章 市場機會與未來展望
According to Mordor Intelligence, the sustainable packaging market size was valued at USD 303.80 billion in 2025 and estimated to grow from USD 325.94 billion in 2026 to reach USD 463.41 billion by 2031, at a CAGR of 7.29% during the forecast period (2026-2031).
This report is Segmented by Process (Reusable, Recyclable, and More), Material Type (Paper and Paperboard, Plastics, and More), Packaging Format (Rigid, Flexible), Function (Primary, Secondary, Tertiary/Transport), End User (Food and Beverage, Pharmaceutical and Healthcare, Cosmetics and Personal Care, and More), and Geography. The Market Forecasts are Provided in Terms of Value (USD).
Global Sustainable Packaging Market Trends and Insights
Extended Producer-Responsibility Laws Create Compliance Convergence
Converging EPR mandates in 63 jurisdictions are dismantling regulatory fragmentation. The European Union's Packaging and Packaging Waste Regulation, effective February 2025, sets 30% recycled-content targets for PET food packaging and bans PFAS, prompting similar frameworks across OECD and BRICS economies. New Kenyan statutes mirror EU fee structures, while Oregon and Colorado require brand-funded Producer Responsibility Organizations from July 2025. Harmonized timelines let global brands deploy single-design solutions at scale, lowering compliance costs and accelerating adoption across the sustainable packaging market.
Brand Commitments Drive PCR Content Standardization Beyond Regulatory Minimums
Major consumer-goods firms now exceed legislation by pledging 25-50% post-consumer recycled (PCR) content portfolio-wide by 2030. Unilever's 2025 goal for all packaging to be recyclable, reusable, or compostable and Amcor's supply of 1,000 tons of recycled plastic for Cadbury wrappers exemplify voluntary targets setting de facto industry baselines. Standardized PCR measurement toolkits from the U.S. Plastics Pact streamline verification, catalyzing procurement clarity and fueling growth in the sustainable packaging market.
PCR Resin Supply Constraints Create Strategic Bottlenecks
Brand pledges now outstrip supply of clear, food-grade PCR. Declining milk volumes shrink the natural HDPE stream, inflating premiums and forcing import reliance that undercuts domestic reclaimers. This imbalance threatens timely fulfillment of regulatory quotas, slowing mass-market expansion of the sustainable packaging market.
Other drivers and restraints analyzed in the detailed report include:
- E-commerce Logistics Pilots Scale Reusable Packaging Systems
- AI-Enhanced Sortation Technologies Improve Recycling Economics
- Cost Premium Persistence Challenges Mass-Market Adoption
For complete list of drivers and restraints, kindly check the Table Of Contents.
Segment Analysis
Recyclable formats retained a 44.88% share in 2025, yet compostable and biodegradable offerings are growing at a 12.32% CAGR, reflecting investor faith in biomaterials such as B'Zeos' seaweed films. The sustainable packaging market size for compostables is riding demand from food-service and personal-care brands seeking solutions free from microplastic fragmentation. However, only 30% of U.S. municipalities have access to industrial composting sites, curbing near-term penetration. In response, the U.S. COMPOST Act proposes USD 2 billion in grants to expand capacity, which would directly lift diversion rates and long-run growth prospects.
Consumer confusion over end-of-life handling still triggers contamination in organic-waste streams, calling for clearer labeling and public-education campaigns. Anaerobic digestion has emerged as an alternate pathway, generating biogas revenue that improves project economics and partially offsets infrastructure shortfalls. With policy and processing gaps gradually closing, compostable formats are set to capture an expanding slice of the sustainable packaging market.
Paper and paperboard represented 39.96% of 2025 revenue owing to mature recycling systems and consumer trust. Plant-based substrates, however, are advancing at 11.21% CAGR, propelled by Stora Enso's dry-forming fiber lines that cut water use by 75% and energy by 30%, boosting circularity credentials. The sustainable packaging market share of polyolefins is expected to contract gradually as PFAS bans and recycled-content rules intensify.
Advanced recycling breakthroughs, including Berkeley's 260 °C vaporization process that converts polyethylene into feedstock with 98% recovery, enable food-grade loops and mitigate downcycling. Mycelium foams and wood-based PET replacements are expanding addressable use cases beyond niche segments, signaling a broader materials transition within the sustainable packaging market.
Complete Report Scope:
- By Process
- Reusable Packaging
- Recyclable Packaging
- Compostable / Biodegradable Packaging
- Edible Packaging
- By Material Type
- Paper and Paperboard
- Plastics
- Glass
- Metal (Aluminum, Steel)
- Plant-based Materials (Bagasse, Mushroom, etc.)
- By Packaging Format
- Rigid
- Flexible
- By Function
- Primary Packaging
- Secondary Packaging
- Tertiary / Transport Packaging
- By End User
- Food and Beverage
- Pharmaceutical and Healthcare
- Cosmetics and Personal Care
- E-commerce and Retail
- Consumer Electronics
- Other End User
- By Geography
- North America
- United States
- Canada
- Mexico
- Europe
- Germany
- United Kingdom
- France
- Italy
- Spain
- Russia
- Rest of Europe
- Asia-Pacific
- China
- India
- Japan
- South Korea
- Australia and New Zealand
- Rest of Asia-Pacific
- Middle East and Africa
- Middle East
- United Arab Emirates
- Saudi Arabia
- Turkey
- Rest of Middle East
- Africa
- South Africa
- Nigeria
- Egypt
- Rest of Africa
- Middle East
- South America
- Brazil
- Argentina
- Rest of South America
- North America
Geography Analysis
Europe's 34.18% revenue share in 2025 reflects its first-mover regulatory stance that has birthed mature recycling infrastructure and eco-design norms. EPR fee modulation by circularity performance incentivizes high-recycled-content packaging, reinforcing supplier innovation cycles. Harmonized deposit-return schemes streamline collection, making Europe the reference market for both advanced recycling pilots and bio-based material commercialization. Multinational brand headquarters located in the region further amplify demand density, ensuring the sustainable packaging market continues to test and scale breakthroughs locally.
Asia-Pacific is on track for the fastest 11.05% CAGR thanks to tightening rules in Japan, South Korea, Australia, and pilot EPR frameworks in China and India. Japan's recycled-plastic mandate effective 2024 and its positive list for food-contact recycled resins entering force in June 2025 unlock high-margin applications and spur domestic resin reprocessing investments. China's evolving supervision policy for recycled plastics coupled with strong e-commerce growth accelerates volume uptake. Vietnam's paper-packaging sector, projected at USD 3.5 billion by 2026, exemplifies regional expansion anchored in export-oriented manufacturing.
North America benefits from state-level EPR adoption and aggressive voluntary commitments by consumer-goods leaders. Oregon, Colorado, and California programs fund curbside upgrades, boosting PCR feedstock availability and narrowing cost spreads. Greenwashing litigation-exemplified by Australia's recent Clorox action-raises disclosure rigor, bolstering consumer trust and driving transparent supply chains. Middle East & Africa and South America remain nascent but show rapid policy convergence, opening white-space opportunities for early technology entrants as infrastructure scales.
- Amcor plc
- Smurfit WestRock Company
- Tetra Pak International SA
- Sonoco Products Company
- Sealed Air Corporation
- Mondi plc
- Huhtamaki Oyj
- BASF SE
- Ardagh Group SA
- Ball Corporation
- Crown Holdings Inc.
- Genpak LLC
- International Paper Company
- Stora Enso Oyj
- Graphic Packaging Holding Co.
- Uflex Ltd.
- Novolex Holdings Inc.
- Ecovative LLC
Additional Benefits:
- The market estimate (ME) sheet in Excel format
- 3 months of analyst support
TABLE OF CONTENTS
1 INTRODUCTION
- 1.1 Study Assumptions and Market Definition
- 1.2 Scope of the Study
2 RESEARCH METHODOLOGY
3 EXECUTIVE SUMMARY
4 MARKET LANDSCAPE
- 4.1 Market Overview
- 4.2 Market Drivers
- 4.2.1 Extended producer-responsibility (EPR) laws surge in OECD and BRICS markets
- 4.2.2 Brand-owner pledges driving >25 % PCR content across portfolios
- 4.2.3 Retailer take-back and reuse pilots scaling in e-commerce logistics
- 4.2.4 AI-enabled sortation raising post-consumer recycling yields
- 4.2.5 Food-grade chemical recycling breakthroughs for polyolefins
- 4.2.6 Emerging mycelium and seaweed packaging securing venture capital
- 4.3 Market Restraints
- 4.3.1 Supply-demand gap in high-quality PCR resins
- 4.3.2 Inflation-driven cost premium vs. virgin substrates
- 4.3.3 Fragmented composting infrastructure in North America and APAC
- 4.3.4 "Greenwashing" litigation risk altering marketing claims
- 4.4 Supply-Chain Analysis
- 4.5 Regulatory Landscape
- 4.6 Technological Outlook
- 4.7 Porter's Five Forces Analysis
- 4.7.1 Bargaining Power of Suppliers
- 4.7.2 Bargaining Power of Buyers
- 4.7.3 Threat of New Entrants
- 4.7.4 Intensity of Competitive Rivalry
- 4.7.5 Threat of Substitutes
- 4.8 Assessment of Impact of Microeconomic Factors
5 MARKET SIZE AND GROWTH FORECASTS (VALUE)
- 5.1 By Process
- 5.1.1 Reusable Packaging
- 5.1.2 Recyclable Packaging
- 5.1.3 Compostable / Biodegradable Packaging
- 5.1.4 Edible Packaging
- 5.2 By Material Type
- 5.2.1 Paper and Paperboard
- 5.2.2 Plastics
- 5.2.3 Glass
- 5.2.4 Metal (Aluminum, Steel)
- 5.2.5 Plant-based Materials (Bagasse, Mushroom, etc.)
- 5.3 By Packaging Format
- 5.3.1 Rigid
- 5.3.2 Flexible
- 5.4 By Function
- 5.4.1 Primary Packaging
- 5.4.2 Secondary Packaging
- 5.4.3 Tertiary / Transport Packaging
- 5.5 By End User
- 5.5.1 Food and Beverage
- 5.5.2 Pharmaceutical and Healthcare
- 5.5.3 Cosmetics and Personal Care
- 5.5.4 E-commerce and Retail
- 5.5.5 Consumer Electronics
- 5.5.6 Other End User
- 5.6 By Geography
- 5.6.1 North America
- 5.6.1.1 United States
- 5.6.1.2 Canada
- 5.6.1.3 Mexico
- 5.6.2 Europe
- 5.6.2.1 Germany
- 5.6.2.2 United Kingdom
- 5.6.2.3 France
- 5.6.2.4 Italy
- 5.6.2.5 Spain
- 5.6.2.6 Russia
- 5.6.2.7 Rest of Europe
- 5.6.3 Asia-Pacific
- 5.6.3.1 China
- 5.6.3.2 India
- 5.6.3.3 Japan
- 5.6.3.4 South Korea
- 5.6.3.5 Australia and New Zealand
- 5.6.3.6 Rest of Asia-Pacific
- 5.6.4 Middle East and Africa
- 5.6.4.1 Middle East
- 5.6.4.1.1 United Arab Emirates
- 5.6.4.1.2 Saudi Arabia
- 5.6.4.1.3 Turkey
- 5.6.4.1.4 Rest of Middle East
- 5.6.4.2 Africa
- 5.6.4.2.1 South Africa
- 5.6.4.2.2 Nigeria
- 5.6.4.2.3 Egypt
- 5.6.4.2.4 Rest of Africa
- 5.6.4.1 Middle East
- 5.6.5 South America
- 5.6.5.1 Brazil
- 5.6.5.2 Argentina
- 5.6.5.3 Rest of South America
- 5.6.1 North America
6 COMPETITIVE LANDSCAPE
- 6.1 Market Concentration
- 6.2 Strategic Moves
- 6.3 Market Share Analysis
- 6.4 Company Profiles (includes Global level Overview, Market level overview, Core Segments, Financials as available, Strategic Information, Market Rank/Share for key companies, Products and Services, and Recent Developments)
- 6.4.1 Amcor plc
- 6.4.2 Smurfit WestRock Company
- 6.4.3 Tetra Pak International SA
- 6.4.4 Sonoco Products Company
- 6.4.5 Sealed Air Corporation
- 6.4.6 Mondi plc
- 6.4.7 Huhtamaki Oyj
- 6.4.8 BASF SE
- 6.4.9 Ardagh Group SA
- 6.4.10 Ball Corporation
- 6.4.11 Crown Holdings Inc.
- 6.4.12 Genpak LLC
- 6.4.13 International Paper Company
- 6.4.14 Stora Enso Oyj
- 6.4.15 Graphic Packaging Holding Co.
- 6.4.16 Uflex Ltd.
- 6.4.17 Novolex Holdings Inc.
- 6.4.18 Ecovative LLC
7 MARKET OPPORTUNITIES AND FUTURE OUTLOOK
- 7.1 White-space and Unmet-Need Assessment

 全球永續包裝市場規模、佔有率、趨勢和成長分析報告(2026-2034)
 永續食品服務包裝:市場佔有率分析、產業趨勢與統計及成長預測(2026-2031 年)永續材料市場規模、佔有率、成長率、全球產業分析、區域趨勢以及 2026 年至 2034 年的預測。
 生物基軟性包裝市場預測至2034年-全球原料、聚合物類型、包裝形式、材料特性、應用、最終用戶及地區分析
 永續包裝市場規模、佔有率、成長和行業分析:按類型、產品類型、最終用途和地區分類,預測至2034年
 永續包裝市場:按材料、永續性類型、應用和分銷管道分類-2026-2032年全球市場預測永續快速消費品包裝市場預測至2034年-按包裝類型、材料類型、永續發展措施、應用和最終用戶分類的全球分析健康永續包裝市場:預測(至2034年)-按材料類型、包裝類型、包裝流程、應用、分銷管道、最終用戶和地區分類的全球分析
 永續產品市場規模、佔有率和成長分析:按產品類型、原料來源、價格範圍、認證類型、分銷管道、最終用戶細分市場和地區分類-2026-2033年產業預測永續包裝材料市場預測至2034年—按材料類型、包裝形式、技術、應用、最終用戶和地區分類的全球分析