


 |
市場調查報告書
商品編碼
2123529
VOC氣體感測器:市場佔有率分析、行業趨勢和統計數據、成長預測(2026-2031年)Volatile Organic Compound Gas Sensor - Market Share Analysis, Industry Trends & Statistics, Growth Forecasts (2026 - 2031) |
||||||

※ 本網頁內容可能與最新版本有所差異。詳細情況請與我們聯繫。
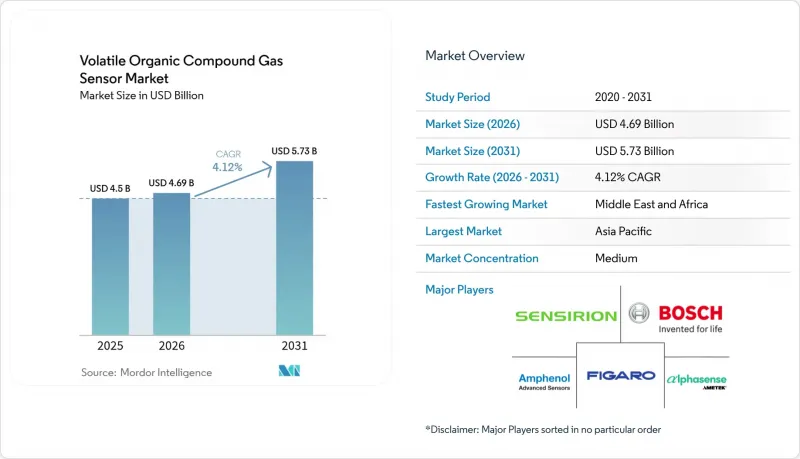
根據 Mordor Intelligence 預測,VOC 氣體感測器市場將從 2025 年的 45 億美元成長到 2026 年的 46.9 億美元,然後在 2031 年達到 57.3 億美元,2026 年至 2031 年的複合年成長率為 4.12%。
本報告依感測器技術(光電離檢測器、光學偵測器等)、設備外形規格(穿戴式徽章等)、連接方式(有線、無線)、終端應用產業(工業安全等)、偵測範圍(小於1ppm等)、銷售管道(直銷等)及地區進行細分。市場預測以美元計價。
全球VOC氣體感測器市場趨勢與洞察
北美和歐洲的室內空氣品質標準更加嚴格
建築物業主必須證明其持續符合甲醛、苯和其他揮發性有機化合物 (VOC) 的嚴格暴露限值。批量採購壁掛式固定偵測器和 BACnet 閘道正在推動醫院、學校和交通樞紐的快速維修。市場需求集中在符合 ASHRAE-62.1 和 EN-16798 標準的專案上,這支撐了 VOC 感測器市場的短期成長動能。
將VOC感測器整合到智慧家居物聯網平台
語音助理中心和連網恆溫器將VOC檢測定位為健康功能。功耗低於20 mW的MOS晶片透過I2C和BLE整合,而Matter 1.2互通性則實現了與供應商無關的配對。出貨量的成長正在擴大目標市場,而單價的下降則推動了VOC感測器市場在中期內的持續成長。
高濕度環境下PID感測器的校準漂移
在相對濕度超過 85% 的環境中,水分子會抑制光電離,可能導致 PID 輸出降低 15%。使用者需要額外支付校正演算法費用和頻繁重新校準費用,這將減緩其在東南亞和南美部分地區的食品加工廠和紙漿廠的短期部署。
細分市場分析
預計到2025年,MOS元件將佔VOC感測器市場銷售額的25.86%,憑藉其均衡的性價比,繼續保持最大的市場佔有率。光電離檢測器(PID)預計將超越整體VOC感測器市場,到2031年將維持7.85%的複合年成長率。高階工業用戶要求反應時間小於3秒,並能偵測多種化學物質,這推動了PID模組在VOC感測器市場規模的成長。未來的MOS藍圖將採用多像素陣列來增強材料選擇性,而PID供應商正在探索採用石墨烯視窗來實現亞ppm級的靈敏度。
在MOS領域,儘管細分應用領域正向PID和晶體微天平設計轉變,但由於晶圓成本下降和溫度調製演算法的進步,老牌製造商仍保持著市場佔有率。新參與企業必須克服與加熱器驅動模式相關的智慧財產權累積問題,這構成了VOC感測器市場的准入壁壘。
到2025年,壁掛式面板將佔總銷售額的41.12%,並將繼續在依賴PoE電纜的建築自動化維修中發揮核心作用。穿戴式徽章的複合年成長率最高,達到9.12%,這反映了監管機構對數位日誌中個人暴露資料的重視。與徽章相關的VOC感測器市場規模正在穩步擴大,MEMS-PID設計可實現8小時的電池續航力。
攜帶式手持檢測器對緊急應變人員仍然十分重要,但其銷售量正逐漸被支援合規性文件的連續式固定監測器所取代。多參數室內空氣品質監測模組面臨來自智慧恆溫器廠商的競爭,後者將各個感測器直接整合到主機板子卡中,但多參數室內空氣品質監測模組仍對揮發性有機化合物(VOC)感測器市場做出重要的貢獻。
區域分析
亞太地區受惠於中國、日本和韓國超級工廠和正極活性材料產能的擴張,預計到2025年將佔全球銷售額的31.55%。 PID感測器與邊緣分析盒結合,能夠實現快速合規性審計,並為各省環保部門提供即時儀錶板。對電池和半導體供應鏈的投資鞏固了亞太地區作為VOC感測器市場最重要區域的地位。
在北美,聯邦政府的稅額扣抵為高效節能的暖通空調系統(HVAC)提供補貼,並支持整合揮發性有機化合物(VOC)監測功能,從而推動了建築維修週期的發展。企業園區正在使用LoRaWAN室內空氣品質(IAQ)節點來追蹤職場的健康狀況,而加拿大綠色建築委員會(GBC)則為持續報告的VOC感測器授予LEED認證積分,這些都促進了VOC感測器市場的發展。
歐盟生態設計指令要求製造商揭露揮發性有機化合物(VOC)在使用過程中的表現。在德國一家汽車噴漆車間,固定監測器將丙酮蒸氣維持在10ppm以下。中東和非洲地區的VOC感測器市場正在快速成長,複合年成長率高達8.85%,其中沙烏地阿拉伯和阿拉伯聯合大公國的智慧城市試點計畫將室內空氣品質(IAQ)儀錶板整合到市政指揮中心,南非礦井正在測試用於井下工人的穿戴式徽章。
南美洲的成長更為穩定。巴西正努力使其國內揮發性有機化合物(VOC)暴露限值與美國政府工業衛生學家協會(ACGIH)的標準接軌,並促進從聖保羅附近的石化聯合企業採購VOC。在墨西哥,為了符合美墨加協定(USMCA)的環境要求,低成本的金屬氧化物半導體(MOS)感測器正在墨西哥加工出口走廊(Maquiladora Corridor)地區推廣,這推動了全部區域VOC感測器市場的發展。
其他好處:
- Excel格式的市場預測(ME)表
- 3個月的分析師支持
目錄
第1章:引言
- 研究假設和市場定義
- 調查範圍
第2章:調查方法
第3章執行摘要
第4章 市場狀況
- 市場概覽
- 市場促進因素
- 北美和歐洲的室內空氣品質標準更加嚴格
- 將VOC感測器整合到智慧家居物聯網平台
- 亞洲電動車電池生產線對溶劑外洩檢測設備的需求
- 採用低功耗MEMS-PID感測器實現穿戴式VOC徽章。
- 綠建築認證體係要求對揮發性有機化合物進行持續監測。
- 市場限制因素
- 高濕度環境下PID感測器的校準漂移
- 不同感測器品牌之間的兼容性協議尚未標準化。
- 大眾市場智慧家居領域的價格敏感性
- 半導體感測器材料供應鏈的波動性
- 價值供應鏈分析
- 監管和技術展望
- 波特五力分析
第5章 市場規模與成長預測
- 感測器技術
- 光電離檢測器(PID)
- 金屬-氧化物-半導體(MOS)
- 電化學感測器
- 光纖感測器
- 晶體微天平(QCM)
- 其他
- 按設備外形規格
- 桌面/壁掛式顯示器
- 手持/可攜式檢測器
- 穿戴式徽章
- 整合式多參數室內空氣品質(IAQ)監測器
- 嵌入式感測器模組
- 透過連接
- 有線(BACnet、Modbus、乙太網路、CAN)
- 無線的
- Wi-Fi
- Bluetooth/BLE
- Zigbee/Thread
- LoRaWAN/NB-IoT/LTE-M
- 按最終用途行業分類
- 工業製程安全
- 石油、天然氣和石化產品
- 汽車和運輸業
- 家用電子電器和智慧家居
- 商業大樓和辦公大樓
- 醫療和藥品
- 食品和飲料製造
- 學術和研發機構
- 其他
- 檢測範圍
- 低於1ppm
- 1~10 ppm
- 10~100 ppm
- 超過100ppm
- 透過分銷管道
- 直銷
- 分銷商/加值經銷商通路
- 電子商務
- 按地區
- 北美洲
- 美國
- 加拿大
- 墨西哥
- 歐洲
- 英國
- 德國
- 法國
- 義大利
- 其他歐洲國家
- 亞太地區
- 中國
- 日本
- 印度
- 韓國
- 其他亞太國家
- 中東
- 以色列
- 沙烏地阿拉伯
- 阿拉伯聯合大公國
- 土耳其
- 其他中東國家
- 非洲
- 南非
- 埃及
- 其他非洲國家
- 南美洲
- 巴西
- 阿根廷
- 其他南美國家
- 北美洲
第6章 競爭情勢
- 市場集中度
- 策略趨勢
- 市佔率分析
- 公司簡介
- ABB Ltd.
- Alphasense Ltd.
- Aeroqual Limited
- Ion Science Ltd.
- EcoSensors Inc.
- SGX Sensortech Ltd.
- Renesas Electronics Corp.
- Sensirion AG
- Amphenol Advanced Sensors
- Figaro Engineering Inc.
- Bosch Sensortec GmbH
- AMS OSRAM AG
- City Technology(Honeywell Intl.)
- GfG Europe Ltd.
- MicroJet Technology Co., Ltd.
- Riken Keiki Co., Ltd.
- Dragerwerk AG and Co. KGaA
- Kaiterra
- Siemens AG
- Spec Sensors LLC
- NevadaNano Inc.
- Zhengzhou Winsen Electronics Tech. Co., Ltd.
第7章 市場機會與未來展望
According to Mordor Intelligence, the vOC sensors market size is expected to grow from USD 4.5 billion in 2025 to USD 4.69 billion in 2026 and is forecast to reach USD 5.73 billion by 2031 at 4.12% CAGR over 2026-2031.
This report is Segmented by Sensor Technology (Photoionization Detector, Optical, and More), Device Form Factor (Wearable Badges, and More), Connectivity (Wired, Wireless), End-Use Industry (Industrial Safety, and More), Detection Range (Less Than 1 Ppm, and More), Distribution Channel (Direct Sales, and More), and Geography. The Market Forecasts are Provided in Terms of Value (USD).
Global Volatile Organic Compound Gas Sensor Market Trends and Insights
Stricter Indoor-Air-Quality Standards across North America & Europe
Building owners must demonstrate continuous compliance with tightened exposure limits for formaldehyde, benzene and other VOCs. Bulk procurement of fixed wall-mounted detectors and BACnet gateways supports rapid retrofits in hospitals, schools and transit hubs. Demand concentrates on projects governed by ASHRAE-62.1 and EN-16798 guidelines, anchoring short-term momentum for the VOC sensors market.
Integration of VOC Sensors into Smart-Home IoT Platforms
Voice-assistant hubs and connected thermostats position VOC sensing as a wellness feature. MOS chips drawing less than 20 mW integrate over I2C or BLE, while Matter 1.2 interoperability enables vendor-agnostic pairing. High shipment volumes widen the addressable base and lower unit prices, sustaining medium-term growth for the VOC sensors market.
Calibration Drift of PID Sensors in High-Humidity Climates
PID output can drop 15% in environments above 85% relative humidity as water molecules quench photoionisation. Users incur added costs for compensation algorithms and frequent recalibration, tempering near-term uptake in food-processing plants and pulp mills across Southeast Asia and parts of South America.
Other drivers and restraints analyzed in the detailed report include:
- Demand from EV Battery Manufacturing Lines in Asia
- Adoption of Low-Power MEMS-PID Sensors Enabling Wearable Badges
- Lack of Harmonised Interoperability Protocols among Sensor Brands
For complete list of drivers and restraints, kindly check the Table Of Contents.
Segment Analysis
MOS devices generated 25.86% of revenue in 2025, holding the largest VOC sensors market share because they balance price and performance. Photoionization detectors will post a 7.85% CAGR through 2031, outpacing the overall VOC sensors market. Premium industrial users require sub-3-second response times and wide chemical coverage, driving the VOC sensors market size for PID modules upward. Future MOS roadmaps incorporate multi-pixel arrays for species selectivity, while PID vendors explore graphene windows to reach sub-ppm sensitivity.
Across the MOS segment, falling wafer costs and temperature-modulation algorithms safeguard incumbent share even as niche applications shift to PID or quartz-crystal microbalance designs. Entrants must navigate intellectual-property clusters covering heater-drive patterns, which raise barriers in the VOC sensors market.
Wall-mounted panels captured 41.12% of 2025 revenue and remain core to building-automation retrofits that rely on PoE cabling. Wearable badges post the highest 9.12% CAGR, reflecting regulatory emphasis on personal exposure data in digital logbooks. The VOC sensors market size tied to badges climbs steadily as MEMS-PID designs prove eight-hour battery life.
Portable handheld detectors retain relevance for first responders but cede volume to continuous fixed monitors that support compliance documentation. Multi-parameter IAQ cubes face competition from smart-thermostat OEMs that integrate individual sensors directly onto motherboard daughtercards, yet they still contribute meaningfully to the VOC sensors market.
Complete Report Scope:
- By Sensor Technology
- Photoionization Detector (PID)
- Metal Oxide Semiconductor (MOS)
- Electrochemical Sensor
- Optical Fiber Sensor
- Quartz Crystal Microbalance (QCM)
- Others
- By Device Form Factor
- Fixed/Wall-Mounted Monitors
- Handheld/Portable Detectors
- Wearable Badges
- Integrated Multi-Parameter IAQ Monitors
- Embedded Sensor Modules
- By Connectivity
- Wired (BACnet, Modbus, Ethernet, CAN)
- Wireless
- Wi-Fi
- Bluetooth/BLE
- Zigbee/Thread
- LoRaWAN/NB-IoT/LTE-M
- By End-use Industry
- Industrial Process Safety
- Oil and Gas and Petrochemical
- Automotive and Transportation
- Consumer Electronics and Smart Homes
- Commercial Buildings and Offices
- Healthcare and Pharmaceuticals
- Food and Beverage Production
- Academic and RandD Laboratories
- Others
- By Detection Range
- Less than 1 ppm
- 1 - 10 ppm
- 10 - 100 ppm
- Greater than 100 ppm
- By Distribution Channel
- Direct Sales
- Distributor / VAR Channel
- E-commerce
- By Geography
- North America
- United States
- Canada
- Mexico
- Europe
- United Kingdom
- Germany
- France
- Italy
- Rest of Europe
- Asia-Pacific
- China
- Japan
- India
- South Korea
- Rest of Asia-Pacific
- Middle East
- Israel
- Saudi Arabia
- United Arab Emirates
- Turkey
- Rest of Middle East
- Africa
- South Africa
- Egypt
- Rest of Africa
- South America
- Brazil
- Argentina
- Rest of South America
- North America
Geography Analysis
Asia-Pacific contributed 31.55% of 2025 turnover, supported by gigafactory and cathode-active-material capacity expansions in China, Japan and South Korea. PID sensors pair with edge-analytics boxes to meet rapid compliance audits that require real-time dashboards delivered to provincial environmental bureaus. Investments in battery and semiconductor supply chains position Asia-Pacific as the foremost region within the VOC sensors market.
North America benefits from a building-retrofit cycle funded by federal tax credits that subsidize high-efficiency HVAC systems integrating VOC monitoring. Enterprise campuses use LoRaWAN IAQ nodes to track workplace wellness, and Canada's green-building council awards LEED points for continuous reporting, reinforcing the VOC sensors market.
Europe's Ecodesign directive pushes manufacturers to disclose VOC performance in use. Fixed monitors maintain acetone vapors below 10 ppm in German automotive paint shops. The Middle East and Africa post the quickest 8.85% CAGR as smart-city pilots in Saudi Arabia and the United Arab Emirates embed IAQ dashboards into municipal command centers, and South African mines trial wearable badges for underground crews, enlarging the regional VOC sensors market.
South America experiences steadier growth. Brazil aligns national exposure limits with ACGIH tables, driving procurement by petrochemical complexes near Sao Paulo. Mexico's maquiladora corridor adds low-cost MOS sensors to comply with USMCA environmental clauses, supporting the VOC sensors market across the region.
- ABB Ltd.
- Alphasense Ltd.
- Aeroqual Limited
- Ion Science Ltd.
- EcoSensors Inc.
- SGX Sensortech Ltd.
- Renesas Electronics Corp.
- Sensirion AG
- Amphenol Advanced Sensors
- Figaro Engineering Inc.
- Bosch Sensortec GmbH
- AMS OSRAM AG
- City Technology (Honeywell Intl.)
- GfG Europe Ltd.
- MicroJet Technology Co., Ltd.
- Riken Keiki Co., Ltd.
- Dragerwerk AG and Co. KGaA
- Kaiterra
- Siemens AG
- Spec Sensors LLC
- NevadaNano Inc.
- Zhengzhou Winsen Electronics Tech. Co., Ltd.
Additional Benefits:
- The market estimate (ME) sheet in Excel format
- 3 months of analyst support
TABLE OF CONTENTS
1 INTRODUCTION
- 1.1 Study Assumptions and Market Definition
- 1.2 Scope of the Study
2 RESEARCH METHODOLOGY
3 EXECUTIVE SUMMARY
4 MARKET LANDSCAPE
- 4.1 Market Overview
- 4.2 Market Drivers
- 4.2.1 Tightening Indoor Air-Quality Standards across North America and Europe
- 4.2.2 Integration of VOC Sensors into Smart-Home IoT Platforms
- 4.2.3 Demand from EV Battery Manufacturing Lines in Asia for Solvent-Leak Detection
- 4.2.4 Adoption of Low-Power MEMS-PID Sensors Enabling Wearable VOC Badges
- 4.2.5 Green-Building Certification Schemes Mandating Continuous VOC Monitoring
- 4.3 Market Restraints
- 4.3.1 Calibration Drift of PID Sensors in High-Humidity Climates
- 4.3.2 Lack of Harmonised Interoperability Protocols among Sensor Brands
- 4.3.3 Price Sensitivity in Mass-Market Smart-Home Segment
- 4.3.4 Supply-Chain Volatility for Semiconductor Sensor Materials
- 4.4 Value / Supply-Chain Analysis
- 4.5 Regulatory or Technological Outlook
- 4.6 Porter's Five Forces Analysis
- 4.6.1 Threat of New Entrants
- 4.6.2 Bargaining Power of Buyers
- 4.6.3 Bargaining Power of Suppliers
- 4.6.4 Threat of Substitute Products
- 4.6.5 Intensity of Competitive Rivalry
5 MARKET SIZE AND GROWTH FORECASTS (VALUE)
- 5.1 By Sensor Technology
- 5.1.1 Photoionization Detector (PID)
- 5.1.2 Metal Oxide Semiconductor (MOS)
- 5.1.3 Electrochemical Sensor
- 5.1.4 Optical Fiber Sensor
- 5.1.5 Quartz Crystal Microbalance (QCM)
- 5.1.6 Others
- 5.2 By Device Form Factor
- 5.2.1 Fixed/Wall-Mounted Monitors
- 5.2.2 Handheld/Portable Detectors
- 5.2.3 Wearable Badges
- 5.2.4 Integrated Multi-Parameter IAQ Monitors
- 5.2.5 Embedded Sensor Modules
- 5.3 By Connectivity
- 5.3.1 Wired (BACnet, Modbus, Ethernet, CAN)
- 5.3.2 Wireless
- 5.3.2.1 Wi-Fi
- 5.3.2.2 Bluetooth/BLE
- 5.3.2.3 Zigbee/Thread
- 5.3.2.4 LoRaWAN/NB-IoT/LTE-M
- 5.4 By End-use Industry
- 5.4.1 Industrial Process Safety
- 5.4.2 Oil and Gas and Petrochemical
- 5.4.3 Automotive and Transportation
- 5.4.4 Consumer Electronics and Smart Homes
- 5.4.5 Commercial Buildings and Offices
- 5.4.6 Healthcare and Pharmaceuticals
- 5.4.7 Food and Beverage Production
- 5.4.8 Academic and RandD Laboratories
- 5.4.9 Others
- 5.5 By Detection Range
- 5.5.1 Less than 1 ppm
- 5.5.2 1 - 10 ppm
- 5.5.3 10 - 100 ppm
- 5.5.4 Greater than 100 ppm
- 5.6 By Distribution Channel
- 5.6.1 Direct Sales
- 5.6.2 Distributor / VAR Channel
- 5.6.3 E-commerce
- 5.7 By Geography
- 5.7.1 North America
- 5.7.1.1 United States
- 5.7.1.2 Canada
- 5.7.1.3 Mexico
- 5.7.2 Europe
- 5.7.2.1 United Kingdom
- 5.7.2.2 Germany
- 5.7.2.3 France
- 5.7.2.4 Italy
- 5.7.2.5 Rest of Europe
- 5.7.3 Asia-Pacific
- 5.7.3.1 China
- 5.7.3.2 Japan
- 5.7.3.3 India
- 5.7.3.4 South Korea
- 5.7.3.5 Rest of Asia-Pacific
- 5.7.4 Middle East
- 5.7.4.1 Israel
- 5.7.4.2 Saudi Arabia
- 5.7.4.3 United Arab Emirates
- 5.7.4.4 Turkey
- 5.7.4.5 Rest of Middle East
- 5.7.5 Africa
- 5.7.5.1 South Africa
- 5.7.5.2 Egypt
- 5.7.5.3 Rest of Africa
- 5.7.6 South America
- 5.7.6.1 Brazil
- 5.7.6.2 Argentina
- 5.7.6.3 Rest of South America
- 5.7.1 North America
6 COMPETITIVE LANDSCAPE
- 6.1 Market Concentration
- 6.2 Strategic Moves
- 6.3 Market Share Analysis
- 6.4 Company Profiles {(includes Global level Overview, Market level overview, Core Segments, Financials as available, Strategic Information, Market Rank/Share for key companies, Products and Services, and Recent Developments)}
- 6.4.1 ABB Ltd.
- 6.4.2 Alphasense Ltd.
- 6.4.3 Aeroqual Limited
- 6.4.4 Ion Science Ltd.
- 6.4.5 EcoSensors Inc.
- 6.4.6 SGX Sensortech Ltd.
- 6.4.7 Renesas Electronics Corp.
- 6.4.8 Sensirion AG
- 6.4.9 Amphenol Advanced Sensors
- 6.4.10 Figaro Engineering Inc.
- 6.4.11 Bosch Sensortec GmbH
- 6.4.12 AMS OSRAM AG
- 6.4.13 City Technology (Honeywell Intl.)
- 6.4.14 GfG Europe Ltd.
- 6.4.15 MicroJet Technology Co., Ltd.
- 6.4.16 Riken Keiki Co., Ltd.
- 6.4.17 Dragerwerk AG and Co. KGaA
- 6.4.18 Kaiterra
- 6.4.19 Siemens AG
- 6.4.20 Spec Sensors LLC
- 6.4.21 NevadaNano Inc.
- 6.4.22 Zhengzhou Winsen Electronics Tech. Co., Ltd.
7 MARKET OPPORTUNITIES AND FUTURE OUTLOOK
- 7.1 White-Space and Unmet-Need Assessment


