

 |
市場調查報告書
商品編碼
1740968
揮發性有機化合物(VOC)氣體感測器市場機會、成長動力、產業趨勢分析及2025-2034年預測Volatile Organic Compound (VOC) Gas Sensor Market Opportunity, Growth Drivers, Industry Trend Analysis, and Forecast 2025 - 2034 |
||||||
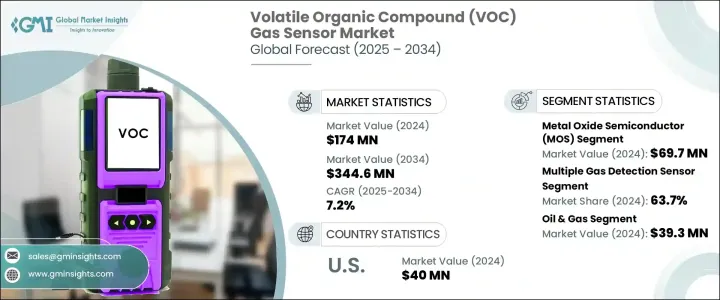
2024 年全球揮發性有機化合物氣體感測器市場價值為 1.74 億美元,預計到 2034 年將以 7.2% 的複合年成長率成長至 3.446 億美元。預計到預測期末,市場容量將達到 1.425 億台。這一成長主要得益於石油和天然氣等行業需求的不斷成長、全球空氣品質標準的日益嚴格以及氣體感測器日益融入物聯網 (IoT) 網路和智慧設備。隨著人們對空氣污染的擔憂日益加劇以及對準確即時監測的需求,VOC 氣體感測器的應用正在工業安全、建築自動化、環境監測和汽車系統等領域迅速擴展。這些感測器對於檢測有害氣體和採取主動安全措施至關重要,尤其是在高風險環境中。技術進步使氣體感測器更加緊湊、經濟高效、反應迅速,從而鼓勵其在消費和工業應用中被採用。此外,更嚴格的環境法規和對室內空氣品質的認知不斷提高,進一步加速了已開發經濟體和發展中經濟體的市場滲透。
近年來,市場經歷了顯著的動盪,尤其是貿易政策變化影響了全球供應鏈。對進口電子產品徵收的高額關稅導致依賴國際採購感測器組件的企業的生產成本上升。這些措施迫使許多製造商重新評估其採購策略,尋求替代供應途徑,或考慮擴大國內生產以減輕對進口的依賴。雖然這些轉變帶來了短期營運挑戰,但也引發了向更在地化的製造模式的逐步轉型。預計這種轉變將在長期內創造更穩定的供應鏈,並降低地緣政治風險的影響。
| 市場範圍 | |
|---|---|
| 起始年份 | 2024 |
| 預測年份 | 2025-2034 |
| 起始值 | 1.74億美元 |
| 預測值 | 3.446億美元 |
| 複合年成長率 | 7.2% |
從技術角度來看,市場分為光電離探測器 (PID)、金屬氧化物半導體 (MOS)、電化學感測器、紅外線探測和其他新興技術。金屬氧化物半導體領域在 2024 年引領市場,創造了 6,970 萬美元的收入。這種成長得益於 MOS 感測器能夠提供快速的響應時間,並且與其他技術相比價格更實惠。這些感測器透過檢測金屬氧化膜中的電阻變化來運作,使其成為持續空氣品質監測的理想選擇。它們適用於智慧家庭、工業環境和汽車安全應用,使其成為商業和消費者用例的熱門選擇。 MOS 感測器也因其能夠有效檢測各種揮發性有機化合物 (VOC)(例如甲醛、苯和甲苯)而被廣泛採用,這些揮發性有機化合物在室內和室外空氣中都很常見。
根據感測器類型,市場分為單氣體偵測感測器和多氣體偵測感測器。 2024年,多氣體偵測感測器佔據了全球63.7%的市場。這些感測器因其能夠檢測揮發性有機化合物(VOC)以外的多種氣體而備受青睞,包括二氧化碳 (CO2)、一氧化碳 (CO)、二氧化氮 (NO2) 和甲烷。它們的多功能性對於工業安全、全面的環境監測和智慧基礎設施系統至關重要。隨著各行各業持續重視多層偵測能力,對這些多功能感測器的需求持續成長,尤其是在各種危險氣體普遍存在的環境中。
依終端產業分類,市場細分為石油天然氣、農業、汽車、化學、製造業、食品飲料、金屬和採礦業等。 2024年,石油天然氣產業佔據市場主導地位,價值達3,930萬美元。該產業對VOC氣體感測器的需求旺盛,主要源自於對氣體檢測、排放監測和工作場所安全的迫切需求。此外,數位技術和基於物聯網的監測系統的日益普及,也促使這些感測器在預測性維護和法規遵循方面的應用得到更廣泛的應用。隨著石油天然氣營運向自動化和環保方向發展,VOC感測器的角色也變得越來越重要。
2024年,美國VOC氣體感測器市場規模達4,000萬美元。美國環保署(EPA)和職業安全與健康管理局(OSHA)等監管機構持續執行嚴格的工業和商業空間空氣品質監測準則,這推動了國內需求的成長。此外,人們對現代建築、醫療機構和車輛室內空氣品質的認知不斷提高,也推動了VOC感測器在暖通空調系統和其他室內環境中的整合。電動車和連網基礎設施的興起進一步推動了這一趨勢,空氣淨化和車內空氣監測正日益成為標準配備。
全球VOC氣體感測器市場仍然高度分散,眾多參與者在不同的細分領域提供多樣化的解決方案。包括多家跨國公司在內的主要產業參與者共佔約28.5%的市場。這些公司不斷推出新產品和改進產品,專注於提高檢測靈敏度、實現微型化以及與數位平台的無縫整合,所有這些都促進了市場的活躍度和競爭性。
目錄
第1章:方法論與範圍
第2章:執行摘要
第3章:行業洞察
- 產業生態系統分析
- 影響價值鏈的因素
- 利潤率分析
- 中斷
- 未來展望
- 製造商
- 經銷商
- 川普政府關稅
- 對貿易的影響
- 貿易量中斷
- 報復措施
- 對產業的影響
- 供給側影響(原料)
- 主要材料價格波動
- 供應鏈重組
- 生產成本影響
- 需求面影響(售價)
- 價格傳導至終端市場
- 市佔率動態
- 消費者反應模式
- 供給側影響(原料)
- 受影響的主要公司
- 策略產業反應
- 供應鏈重組
- 定價和產品策略
- 政策參與
- 展望與未來考慮
- 對貿易的影響
- 供應商格局
- 利潤率分析
- 重要新聞和舉措
- 監管格局
- 衝擊力
- 成長動力
- 石油和天然氣產業需求激增
- 政府和私人對智慧城市的投資不斷增加
- 實施嚴格的空氣品質法規
- 加強與物聯網和智慧設備的整合
- 人們對空氣中揮發性有機化合物 (VOC) 相關健康風險的認知不斷提高
- 產業陷阱與挑戰
- 現有基礎設施的整合挑戰
- 先進的VOC感測器成本高
- 成長動力
- 成長潛力分析
- 波特的分析
- PESTEL分析
第4章:競爭格局
- 介紹
- 公司市佔率分析
- 競爭定位矩陣
- 戰略展望矩陣
第5章:市場估計與預測:依技術,2021-2034 年
- 主要趨勢
- 光電離檢測器 (PID)
- 金屬氧化物半導體(MOS)
- 電化學感測器
- 紅外線檢測
- 其他
第6章:市場估計與預測:按類型,2021-2034
- 主要趨勢
- 單一氣體檢測感測器
- 多種氣體偵測感測器
第7章:市場估計與預測:按最終用途產業,2021-2034 年
- 主要趨勢
- 石油和天然氣
- 農業
- 汽車
- 化工
- 製造業
- 食品和飲料
- 金屬與礦業
- 其他
第8章:市場估計與預測:按地區,2021-2034
- 主要趨勢
- 北美洲
- 美國
- 加拿大
- 歐洲
- 英國
- 德國
- 法國
- 義大利
- 西班牙
- 俄羅斯
- 亞太地區
- 中國
- 印度
- 日本
- 韓國
- 澳洲
- 拉丁美洲
- 巴西
- 墨西哥
- MEA
- 南非
- 沙烏地阿拉伯
- 阿拉伯聯合大公國
第9章:公司簡介
- ABB Ltd.
- Acal BFi Holdings Limited.
- Aeroqual Limited
- Alphasense Ltd.
- Amphenol Corporation
- ams AG
- Bosch Sensortec GmbH
- Danfoss
- EcoSensors
- Figaro Engineering Inc.
- GfG Europe Ltd.
- Honeywell International Inc.
- Ion Science Ltd.
- MEMBRAPOR AG
- MicroJet Technology Co., Ltd.
- Renesas Electronics Corporation
- Sensirion AG
- SGX Sensortech Ltd
- Siemens AG
- Winsen
The Global Volatile Organic Compound Gas Sensor Market was valued at USD 174 million in 2024 and is estimated to grow at a CAGR of 7.2% to reach USD 344.6 million by 2034. The market volume is anticipated to hit 142.5 million units by the end of the forecast period. This growth is primarily driven by the increasing demand from industries such as oil and gas, the tightening of air quality standards worldwide, and the growing integration of gas sensors into Internet of Things (IoT) networks and smart devices. With rising concerns over air pollution and the need for accurate real-time monitoring, the application of VOC gas sensors is expanding rapidly across sectors including industrial safety, building automation, environmental monitoring, and automotive systems. These sensors are vital for detecting harmful gases and enabling proactive safety measures, particularly in high-risk environments. Technological advancements have made gas sensors more compact, cost-effective, and responsive, encouraging their adoption in both consumer and industrial applications. Furthermore, stricter environmental regulations and heightened awareness about indoor air quality are further accelerating market penetration across developed and developing economies.
The market has experienced notable disruptions in recent years, particularly due to trade policy changes that affected global supply chains. High tariffs imposed on imported electronic goods led to increased production costs for companies reliant on international sourcing for sensor components. These measures forced many manufacturers to reassess their procurement strategies and seek alternative supply routes or consider domestic production expansion to mitigate import dependency. Although these shifts posed short-term operational challenges, they also triggered a gradual transformation toward more localized manufacturing practices. This transition is expected to create more stable supply chains in the long term and reduce vulnerability to geopolitical risks.
| Market Scope | |
|---|---|
| Start Year | 2024 |
| Forecast Year | 2025-2034 |
| Start Value | $174 Million |
| Forecast Value | $344.6 Million |
| CAGR | 7.2% |
In terms of technology, the market is categorized into photoionization detectors (PID), metal oxide semiconductors (MOS), electrochemical sensors, infrared-based detection, and other emerging technologies. The metal oxide semiconductor segment led the market in 2024, generating USD 69.7 million in revenue. This growth is driven by MOS sensors' ability to deliver rapid response times and their affordability compared to other technologies. These sensors operate by detecting resistance changes in a metal oxide film, making them ideal for continuous air quality monitoring. Their suitability for smart homes, industrial environments, and automotive safety applications positions them as a popular choice across both commercial and consumer use cases. MOS sensors are also widely adopted for their efficiency in detecting various VOCs such as formaldehyde, benzene, and toluene, which are commonly found in both indoor and outdoor air.
Based on sensor type, the market is split into single gas detection sensors and multiple gas detection sensors. In 2024, multiple gas detection sensors accounted for 63.7% of the global market share. These sensors are favored for their ability to detect a variety of gases beyond VOCs, including carbon dioxide (CO2), carbon monoxide (CO), nitrogen dioxide (NO2), and methane. Their versatility is essential for industrial safety, comprehensive environmental monitoring, and smart infrastructure systems. As industries continue to prioritize multi-layered detection capabilities, the demand for these multifunctional sensors continues to grow, especially in environments where the presence of different hazardous gases is common.
By end-use industry, the market is segmented into oil and gas, agriculture, automotive, chemical, manufacturing, food and beverages, metals and mining, and others. The oil and gas sector dominated the market in 2024 with a value of USD 39.3 million. The high demand for VOC gas sensors in this industry is largely due to the critical need for gas detection, emissions monitoring, and workplace safety. Additionally, the increasing implementation of digital technologies and IoT-based monitoring systems has led to the broader deployment of these sensors for predictive maintenance and regulatory compliance. As oil and gas operations evolve to become more automated and environmentally responsible, the role of VOC sensors is becoming even more integral.
In 2024, the VOC gas sensor market in the United States reached USD 40 million. Regulatory bodies such as the Environmental Protection Agency (EPA) and the Occupational Safety and Health Administration (OSHA) continue to enforce stringent guidelines for air quality monitoring in industrial and commercial spaces, which is boosting domestic demand. Furthermore, rising awareness around indoor air quality in modern buildings, healthcare facilities, and vehicles is encouraging the integration of VOC sensors in HVAC systems and other indoor environments. This trend is further supported by the rise in electric vehicles and connected infrastructure, where air purification and in-cabin air monitoring are increasingly becoming standard.
The global VOC gas sensor market remains highly fragmented, with numerous players offering diverse solutions across different segments. Major industry participants, including several multinational corporations, collectively hold around 28.5% of the market share. These companies are continuously introducing new and improved products, focusing on enhanced detection sensitivity, miniaturization, and seamless integration with digital platforms, all of which are contributing to the dynamic and competitive nature of the market.
Table of Contents
Chapter 1 Methodology & Scope
- 1.1 Market scope & definitions
- 1.2 Base estimates & calculations
- 1.3 Forecast calculations
- 1.4 Data sources
- 1.4.1 Primary
- 1.4.2 Secondary
- 1.4.2.1 Paid sources
- 1.4.2.2 Public sources
Chapter 2 Executive Summary
- 2.1 Industry synopsis, 2021-2034
Chapter 3 Industry Insights
- 3.1 Industry ecosystem analysis
- 3.1.1 Factor affecting the value chain
- 3.1.2 Profit margin analysis
- 3.1.3 Disruptions
- 3.1.4 Future outlook
- 3.1.5 Manufacturers
- 3.1.6 Distributors
- 3.2 Trump administration tariffs
- 3.2.1 Impact on trade
- 3.2.1.1 Trade volume disruptions
- 3.2.1.2 Retaliatory measures
- 3.2.1.3 Impact on the industry
- 3.2.1.3.1 Supply-side impact (raw materials)
- 3.2.1.3.1.1 Price volatility in key materials
- 3.2.1.3.1.2 Supply chain restructuring
- 3.2.1.3.1.3 Production cost implications
- 3.2.1.3.2 Demand-side impact (selling price)
- 3.2.1.3.2.1 Price transmission to end markets
- 3.2.1.3.2.2 Market share dynamics
- 3.2.1.3.2.3 Consumer response patterns
- 3.2.1.3.1 Supply-side impact (raw materials)
- 3.2.1.4 Key companies impacted
- 3.2.1.5 Strategic industry responses
- 3.2.1.5.1 Supply chain reconfiguration
- 3.2.1.5.2 Pricing and product strategies
- 3.2.1.5.3 Policy engagement
- 3.2.1.6 Outlook and future considerations
- 3.2.1 Impact on trade
- 3.3 Supplier landscape
- 3.4 Profit margin analysis
- 3.5 Key news & initiatives
- 3.6 Regulatory landscape
- 3.7 Impact forces
- 3.7.1 Growth drivers
- 3.7.1.1 Surge in demand across oil & gas sector
- 3.7.1.2 Rising government & private investments in smart cities
- 3.7.1.3 Imposition of stringent air quality regulations
- 3.7.1.4 Increasing integration with IoT & smart devices
- 3.7.1.5 Growing awareness about airborne VOC-related health risks
- 3.7.2 Industry pitfalls & challenges
- 3.7.2.1 Integration challenges in existing infrastructure
- 3.7.2.2 High cost of advanced VOC sensors
- 3.7.1 Growth drivers
- 3.8 Growth potential analysis
- 3.9 Porter's analysis
- 3.10 PESTEL analysis
Chapter 4 Competitive Landscape, 2024
- 4.1 Introduction
- 4.2 Company market share analysis
- 4.3 Competitive positioning matrix
- 4.4 Strategic outlook matrix
Chapter 5 Market Estimates & Forecast, By Technology, 2021-2034 (USD Million & Units)
- 5.1 Key trends
- 5.2 Photoionization Detectors (PID)
- 5.3 Metal Oxide Semiconductor (MOS)
- 5.4 Electrochemical sensors
- 5.5 Infrared-based detection
- 5.6 Others
Chapter 6 Market Estimates & Forecast, By Type, 2021-2034 (USD Million & Units)
- 6.1 Key trends
- 6.2 Single gas detection sensor
- 6.3 Multiple gas detection sensor
Chapter 7 Market Estimates & Forecast, By End Use Industry, 2021-2034 (USD Million & Units)
- 7.1 Key trends
- 7.2 Oil & gas
- 7.3 Agriculture
- 7.4 Automotive
- 7.5 Chemical industry
- 7.6 Manufacturing
- 7.7 Food & beverages
- 7.8 Metals & mining
- 7.9 Others
Chapter 8 Market Estimates & Forecast, By Region, 2021-2034 (USD Million & Units)
- 8.1 Key trends
- 8.2 North America
- 8.2.1 U.S.
- 8.2.2 Canada
- 8.3 Europe
- 8.3.1 UK
- 8.3.2 Germany
- 8.3.3 France
- 8.3.4 Italy
- 8.3.5 Spain
- 8.3.6 Russia
- 8.4 Asia Pacific
- 8.4.1 China
- 8.4.2 India
- 8.4.3 Japan
- 8.4.4 South Korea
- 8.4.5 Australia
- 8.5 Latin America
- 8.5.1 Brazil
- 8.5.2 Mexico
- 8.6 MEA
- 8.6.1 South Africa
- 8.6.2 Saudi Arabia
- 8.6.3 UAE
Chapter 9 Company Profiles
- 9.1 ABB Ltd.
- 9.2 Acal BFi Holdings Limited.
- 9.3 Aeroqual Limited
- 9.4 Alphasense Ltd.
- 9.5 Amphenol Corporation
- 9.6 ams AG
- 9.7 Bosch Sensortec GmbH
- 9.8 Danfoss
- 9.9 EcoSensors
- 9.10 Figaro Engineering Inc.
- 9.11 GfG Europe Ltd.
- 9.12 Honeywell International Inc.
- 9.13 Ion Science Ltd.
- 9.14 MEMBRAPOR AG
- 9.15 MicroJet Technology Co., Ltd.
- 9.16 Renesas Electronics Corporation
- 9.17 Sensirion AG
- 9.18 SGX Sensortech Ltd
- 9.19 Siemens AG
- 9.20 Winsen


