


 |
市場調查報告書
商品編碼
2123489
過氧乙酸:市場佔有率分析、產業趨勢與統計、成長預測(2026-2031)Peracetic Acid - Market Share Analysis, Industry Trends & Statistics, Growth Forecasts (2026 - 2031) |
||||||

※ 本網頁內容可能與最新版本有所差異。詳細情況請與我們聯繫。
根據 Mordor Intelligence 預測,過氧乙酸市場規模將從 2025 年的 358.16 千噸成長到 2026 年的 379.26 千噸,到 2031 年達到 504.91 千噸,2026 年至 2031 年的複合年成長率為 5.89%。
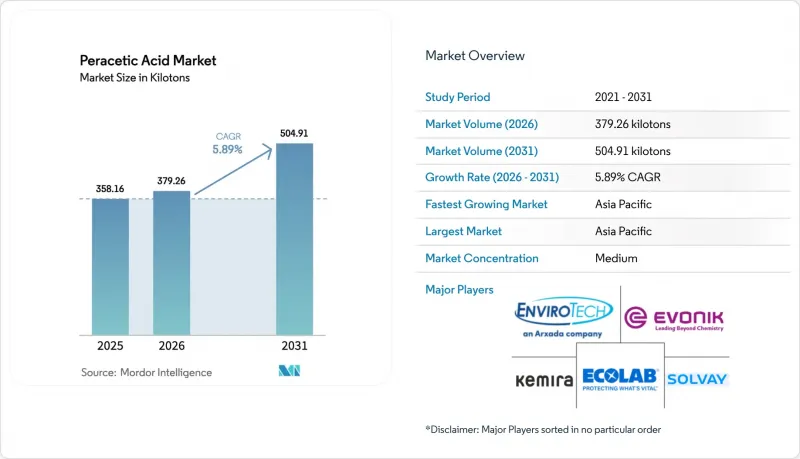
本報告按產品形態(液體、粉末/顆粒、水性混合物)、濃度等級(PAA <5%、5-15%、>15%)、應用(消毒劑、氧化劑、其他應用)、終端用戶行業(食品飲料、水處理等)和地區(亞太地區、北美地區等)進行細分。市場預測以噸為單位。
全球過氧乙酸市場趨勢與洞察
食品安全法規支持食品和飲料的衛生管理。
2024年至2025年間,監管機構修訂了直接接觸消毒劑的相關規定,要求加工商在第三方審核期間提供檢驗的細菌減少數據。美國農業部食品安全檢驗局(FSIS)現要求提供肉類肉製品表面對李斯特菌有效的證明。同時,歐盟除生物劑法規對工廠中過氧乙酸(PAA)的使用量設定了限制,以適應免沖洗生產線。為減少因腐敗造成的損失,印度食品標準與安全局(FSSAI)已批准在採後農產品中使用過氧乙酸(PAA)。這些法規通常傾向於液態產品,因為液態產品允許加工商直接在生產線上使用,而無需昂貴的稀釋設備。鑑於這些趨勢,設備製造商正在整合即時感測器來監測PAA濃度,以幫助工廠應對審核挑戰,並加速這種消毒劑在高產能設施中的應用。
市政和工業水處理領域的需求快速成長。
2024年,美國環保署(EPA)降低了餘氯的允許限值,敦促供水事業改用分解成氧氣和乙酸而非鹵代副產物的化學品。歐盟和中國沿海地區也出現了類似的趨勢,水產養殖廢水與都市污水混合日益增多,使得人們更加關注非鹵代消毒劑。過氧乙酸(PAA)在與氯相同的接觸時間內,可抑制隱孢子蟲達3個數量級,同時避免了三鹵甲烷的基準值。紙漿廠和食品加工廠等工業用戶也傾向於在冷卻塔迴路中使用PAA,因為二氧化氯的儲存有爆炸風險。這些因素綜合起來,預計到2031年,消毒劑的使用量將以6.45%的複合年成長率成長。
職業危害及應對挑戰
根據美國職業安全與健康管理局 (OSHA) 的規定,過氧乙酸 (PAA) 濃度超過 15% 即被視為具有腐蝕性,需要採取二級防護措施並使用個人防護設備。由於高溫會加速 PAA 的分解,維修通風儲存槽可能成本高昂。這些經濟和安全的挑戰對新興經濟體的小規模加工企業而言尤其沉重,阻礙了它們的全球擴張。
細分市場分析
至2025年,液態溶液將佔總出貨量的68.44%。這反映了其與食品加工廠和污水處理廠廣泛使用的傳統計量泵的兼容性。這項優勢支撐了工廠層級的過氧乙酸市場規模,因為設備維修僅限於調整計量速率。由於水性混合物中的穩定劑能夠減少無菌包裝生產線中不銹鋼的腐蝕,因此對水性混合物的需求正以6.12%的複合年成長率成長。
新建設的乳製品廠、果汁廠和製藥廠在安裝整合式監測設備時,更傾向於使用水溶液。粉末和顆粒狀溶液則佔了一定的市場,主要用於災害救援衛生和季節性池塘水處理。在這些應用中,較低的運輸成本比現場溶解的需求更為重要。供應商持續致力於研發,以延長混合產品的保存期限,因為更長的保存期限更適合全球運輸路線和偏遠地區的用戶。因此,預計液體溶液將繼續保持大部分市場佔有率,但隨著新用戶傾向於選擇具有緩蝕性能的化學品,混合產品的市場佔有率將逐漸萎縮。
預計到2025年,中等濃度範圍(PAA 5-15%)的產品將佔總銷售量的54.31%,並在2031年之前以6.23%的複合年成長率成長,從而在該濃度範圍內佔據過氧乙酸市場的最大佔有率。此濃度的產品能夠快速殺滅微生物,並規避了適用於濃度高於15%的濃縮液的嚴格操作規定。 2024年,美國食品藥物管理局(FDA)發布指南指出,加工商使用該濃度的產品只需60秒即可達到檢驗的滅菌效果,凸顯了該濃度產品在快節奏的肉類和乳製品加工廠中的吸引力。
在配備自動稀釋系統的市政加工設施中,主要使用高濃度產品。另一方面,由於低濃度產品無需沖洗且運輸法規較為寬鬆,因此更受農產品收穫後清洗的青睞。然而,高濃度產品的廣泛應用仍面臨挑戰。額外的通風設備和儲存空間需求會降低實際的成本優勢,從而削弱其吸引力。整體而言,中濃度產品預計仍將是主流,但使用者在根據具體應用選擇產品時,也越來越傾向於選擇稀釋液和濃縮液等極端濃度的產品。
區域分析
預計到2025年,亞太地區將佔全球銷售量的38.67%,年複合成長率達6.80%,是所有地區中成長最快的。古吉拉突邦和上海新增的過氧化氫產能縮短了供應路線,降低了當地生產商的運輸成本。中國對生化需氧量(BOD)的嚴格監管,使得沿海城市,尤其是水產養殖廢水與都市污水交匯的地區,更傾向於使用過氧乙酸(PAA)而非次氯酸鈉。印度食品監管機構已批准在果蔬加工中使用過氧乙酸,這在冷鏈供應鏈不完善導致兩位數損耗的情況下,為印度開闢了高容量市場。在日本,過氧乙酸在製藥領域的應用範圍已擴大,目前也被用於無塵室消毒。
北美和歐洲市場成熟且穩定。美國環保署 (EPA) 將於 2024 年收緊餘氯限值,這刺激了對注入式漂白設備的投資,但由於基礎設施更新周期有限,成長率仍維持在個位數中段。歐洲供應商正面臨與能源價格相關的成本上漲,對價格敏感的紙漿漂白行業的轉型速度正在放緩,但歐盟除生物劑法規第 95 條的納入增強了市場的長期信心。兩大洲的精釀啤酒廠透過採用冷過氧乙酸 (PAA) 進行原位清洗 (CIP),提高了效率並降低了能源和水的消耗。
在南美洲、中東和非洲,預算限制使得更經濟的氯處理方法成為首選,導致其應用率較低。在巴西的高檔桉樹紙漿產業,為了滿足關注森林砍伐問題的歐洲買家的需求,過氧乙酸(PAA)的試點應用正在進行中,但確保價格合理的原料供應對於全面商業化至關重要。在海灣國家的海水淡化項目中,已撥款用於注入基於過氧乙酸的除生物劑,並且隨著零能耗消毒和低溫逆滲透預處理技術的結合應用,預計將逐步取得成果。在全部區域,監管不力和資金短缺正在減緩逆滲透的應用速度。
其他好處:
- Excel格式的市場預測(ME)表
- 3個月的分析師支持
目錄
第1章:引言
- 研究假設和市場定義
- 調查範圍
第2章:調查方法
第3章執行摘要
第4章 市場狀況
- 市場概覽
- 市場促進因素
- 食品安全法規旨在促進食品和飲料的衛生管理。
- 市政和工業水處理領域的需求快速成長。
- 從氯基漂白劑過渡到環保紙漿漂白劑。
- 醫療設備低溫滅菌技術的擴展
- 在精釀啤酒廠引進「冷態CIP(點火前清洗)」循環
- 市場限制因素
- 職業風險及其應對挑戰
- 高成本與氯基替代品的比較
- 主要前驅物(乙酸酐、H2O2)的價格波動
- 價值鏈分析
- 波特五力模型
第5章 市場規模與成長預測
- 按產品形式
- 液體溶液
- 粉末/顆粒
- 水性混合物
- 按塑膠等級
- PAA含量低於5%(低濃度)
- PAA含量5-15%(中等濃度)
- PAA含量15%或以上(高濃度)
- 透過使用
- 消毒劑
- 氧化劑
- 消毒劑
- 其他用途(漂白、消毒等)
- 按最終用戶行業分類
- 食品/飲料加工
- 水處理
- 紙漿和造紙
- 醫療保健(包括藥品)
- 化學品
- 其他終端用戶產業(農業、漁業等)
- 按地區
- 亞太地區
- 中國
- 印度
- 日本
- 韓國
- 其他亞太國家
- 北美洲
- 美國
- 加拿大
- 墨西哥
- 歐洲
- 德國
- 英國
- 法國
- 義大利
- 其他歐洲國家
- 南美洲
- 巴西
- 阿根廷
- 其他南美國家
- 中東和非洲
- 沙烏地阿拉伯
- 南非
- 其他中東和非洲國家
- 亞太地區
第6章 競爭情勢
- 市場集中度
- 策略趨勢
- 市佔率和排名分析
- 公司簡介
- ACURO ORGANICS LIMITED
- Aditya Birla Chemicals
- Airedale Group
- Biosan
- Brainerd Chemical
- Christeyns
- Diversey, Inc.
- Ecolab
- Enviro Tech Chemical Services, Inc.
- Evonik Industries AG
- Hydrite Chemical
- Jubilant Pharmova Limited
- Kemira
- MITSUBISHI GAS CHEMICAL COMPANY, INC.
- Solvay
- STOCKMEIER Group
第7章 市場機會與未來展望
According to Mordor Intelligence, the peracetic acid market size is expected to increase from 358.16 kilotons in 2025 to 379.26 kilotons in 2026 and reach 504.91 kilotons by 2031, growing at a CAGR of 5.89% over 2026-2031.
This report is Segmented by Product Form (Liquid Solutions, Powder/Granules, and Aqueous Blends), Concentration Grade (Less Than 5% PAA, 5-15% PAA, and More Than 15% PAA), Application (Disinfectant, Oxidizer, and Other Applications), End-User Industry (Food and Beverage, Water Treatment, and More), and Geography (Asia-Pacific, North America, and More). Market Forecasts are Provided in Terms of Volume (Tons).
Global Peracetic Acid Market Trends and Insights
Food-Safety Regulations Boosting Food and Beverage Sanitation
In 2024-2025, regulators revised rules for direct-contact sanitizers, mandating processors to present validated log-reduction data during third-party audits. The USDA's Food Safety and Inspection Service has now mandated proof of efficacy against Listeria on the surfaces of ready-to-eat meats. Meanwhile, the EU's Biocidal Products Regulation has set a cap on in-plant PAA usage, aligning with no-rinse lines. Addressing spoilage losses, India's FSSAI has approved PAA for post-harvest produce. These collective regulations lean toward favoring liquid grades, as processors can utilize them in-line without the need for costly dilution equipment. In light of these developments, equipment manufacturers have integrated real-time sensors to monitor PAA strength, aiding plants in bridging audit gaps and accelerating the adoption of the disinfectant in high-throughput facilities.
Demand Surge from Municipal and Industrial Water Treatment
The U.S. Environmental Protection Agency lowered allowable chlorine residuals in 2024, pushing utilities toward a chemistry that breaks down into oxygen and acetic acid rather than halogenated by-products. Parallel moves in the EU and coastal China added momentum as aquaculture discharge began mixing with urban effluent, making non-halogenated disinfectants attractive. PAA offers 3-log Cryptosporidium control at contact times that match chlorine yet sidesteps trihalomethane limits. Industrial adopters in pulp and food plants also prefer PAA in cooling-tower loops where chlorine dioxide storage generates explosion risks. These factors jointly underpin the 6.45% CAGR projected for disinfectant use through 2031.
Occupational Hazards and Handling Challenges
Under OSHA rules, PAA concentrations exceeding 15% are deemed corrosive, necessitating secondary containment and personal protective equipment. Heat speeds up PAA decomposition, and retrofitting with vented storage tanks can inflate budgets. Such financial and safety challenges are particularly burdensome for small processors in emerging economies, hindering their global expansion.
Other drivers and restraints analyzed in the detailed report include:
- Shift from Chlorine to Eco-Friendly Pulp Bleaching Agents
- Growth in Low-Temperature Sterilization of Medical Devices
- High Cost Versus Chlorine-Based Substitutes
For complete list of drivers and restraints, kindly check the Table Of Contents.
Segment Analysis
Liquid solutions accounted for 68.44% volume in 2025, reflecting compatibility with legacy dosing pumps across food plants and wastewater treatment works. This dominance anchors the peracetic acid market size at the plant-level because retrofits involve little more than adjusting metering rates. Demand for aqueous blends is rising at a 6.12% CAGR because stabilizers inside these blends reduce corrosion on stainless steel in aseptic packaging lines.
Aqueous formats appeal to greenfield dairy, juice, and pharmaceutical plants that order integrated monitoring hardware. Powder and granule forms hold a niche share, mainly disaster-relief sanitation and seasonal pond treatment, where lower freight cost outweighs the need for on-site dissolution. Suppliers continue to focus research and development on extending blend shelf life, because longer storage pairs well with global shipping lanes and remote users. Consequently, liquid solutions will keep a majority share, though gains for blends will chip away at the margin as new installations favor corrosion-mitigated chemistries.
Medium Range (5-15% PAA) held 54.31% volume in 2025 and is projected to grow at a 6.23% CAGR through 2031, ensuring the highest peracetic acid market share among concentration tiers. The grade achieves a rapid microbial kill, sidestepping the stringent handling rules that come into play for concentrates exceeding 15%. In 2024, the FDA issued guidance indicating that processors can attain validated reductions in just 60 seconds with this concentration, underscoring its appeal for fast-paced meat and dairy operations.
Municipal plants, equipped with automated dilution skids, predominantly utilize high-concentration products. Lower-concentration grades are favored for washing post-harvest produce, thanks to their no-rinse properties and lenient transportation regulations. However, widespread adoption of high-concentration products faces hurdles; the need for additional ventilation and storage drives up net savings, making them less attractive. In the grand scheme, while medium concentrations are set to maintain their dominance, users are increasingly gravitating towards either end of the spectrum-dilute or concentrate-tailoring their choice to specific applications.
Complete Report Scope:
- By Product Form
- Liquid Solutions
- Powder / Granules
- Aqueous Blends
- By Concentration Grade
- Less than 5% PAA (Low)
- 5-15% PAA (Medium)
- More than 15% PAA (High)
- By Application
- Disinfectant
- Oxidizer
- Sterilant
- Other Applications (Bleaching Agent, Sanitizer, etc.)
- By End-user Industry
- Food and Beverage Processing
- Water Treatment
- Pulp and Paper
- Healthcare (including Pharmaceutical)
- Chemical
- Other End-user Industries (Agriculture and Aquaculture, etc.)
- By Geography (Volume)
- Asia-Pacific
- China
- India
- Japan
- South Korea
- Rest of Asia-Pacific
- North America
- United States
- Canada
- Mexico
- Europe
- Germany
- United Kingdom
- France
- Italy
- Rest of Europe
- South America
- Brazil
- Argentina
- Rest of South America
- Middle-East and Africa
- Saudi Arabia
- South Africa
- Rest of Middle-East and Africa
- Asia-Pacific
Geography Analysis
Asia-Pacific captured 38.67% of the 2025 volume and is growing at a 6.80% CAGR, the fastest regional trajectory. New hydrogen-peroxide capacity in Gujarat and Shanghai shortens supply lines and trims delivered costs for local formulators. China's tougher biochemical-oxygen-demand limits push coastal cities to favor PAA over sodium hypochlorite, especially where aquaculture discharge merges with municipal wastewater. India's food regulators backed PAA for fruit and vegetable treatment, opening a high-volume channel because cold-chain gaps cause double-digit spoilage losses. Japan broadened pharmaceutical approvals, moving the chemistry into cleanroom disinfection work.
North America and Europe represent mature but steady terrain. The U.S. EPA's tighter residual-chlorine ceiling in 2024 triggered spending on injection skids, yet infrastructure turnover limits growth to mid-single digits. European suppliers face energy-linked cost inflation, slowing switches in price-sensitive pulp bleaching, although Article 95 listing under the EU Biocidal Products Regulation reinforces long-term confidence. Craft breweries on both continents improved efficiency by embracing cold PAA CIP, cutting energy and water use.
South America, the Middle East, and Africa remain volume laggards because budget constraints favor cheaper chlorination. Brazil's premium eucalyptus pulp segment is piloting PAA to satisfy European buyers wary of deforestation, yet full commercialization depends on affordable feedstock. Gulf State desalination projects allocated funds for PAA biocide dosing, indicating incremental gains where energy-free disinfection aligns with low-temperature reverse-osmosis pretreatment. Across these regions, regulatory gaps and capital scarcity temper the pace of adoption.
- ACURO ORGANICS LIMITED
- Aditya Birla Chemicals
- Airedale Group
- Biosan
- Brainerd Chemical
- Christeyns
- Diversey, Inc.
- Ecolab
- Enviro Tech Chemical Services, Inc.
- Evonik Industries AG
- Hydrite Chemical
- Jubilant Pharmova Limited
- Kemira
- MITSUBISHI GAS CHEMICAL COMPANY, INC.
- Solvay
- STOCKMEIER Group
Additional Benefits:
- The market estimate (ME) sheet in Excel format
- 3 months of analyst support
TABLE OF CONTENTS
1 Introduction
- 1.1 Study Assumptions and Market Definition
- 1.2 Scope of the Study
2 Research Methodology
3 Executive Summary
4 Market Landscape
- 4.1 Market Overview
- 4.2 Market Drivers
- 4.2.1 Food-safety regulations boosting food and beverage sanitation
- 4.2.2 Demand surge from municipal and industrial water treatment
- 4.2.3 Shift from chlorine to eco-friendly pulp bleaching agents
- 4.2.4 Growth in low-temperature sterilisation of medical devices
- 4.2.5 Craft-brewery adoption in cold-clean-in-place (CIP) cycles
- 4.3 Market Restraints
- 4.3.1 Occupational hazards and handling challenges
- 4.3.2 High cost versus chlorine-based substitutes
- 4.3.3 Volatility of key precursors (acetic anhydride, H2O2)
- 4.4 Value Chain Analysis
- 4.5 Porter's Five Forces
- 4.5.1 Bargaining Power of Suppliers
- 4.5.2 Bargaining Power of Buyers
- 4.5.3 Threat of New Entrants
- 4.5.4 Threat of Substitute Products and Services
- 4.5.5 Degree of Competition
5 Market Size and Growth Forecasts (Volume)
- 5.1 By Product Form
- 5.1.1 Liquid Solutions
- 5.1.2 Powder / Granules
- 5.1.3 Aqueous Blends
- 5.2 By Concentration Grade
- 5.2.1 Less than 5% PAA (Low)
- 5.2.2 5-15% PAA (Medium)
- 5.2.3 More than 15% PAA (High)
- 5.3 By Application
- 5.3.1 Disinfectant
- 5.3.2 Oxidizer
- 5.3.3 Sterilant
- 5.3.4 Other Applications (Bleaching Agent, Sanitizer, etc.)
- 5.4 By End-user Industry
- 5.4.1 Food and Beverage Processing
- 5.4.2 Water Treatment
- 5.4.3 Pulp and Paper
- 5.4.4 Healthcare (including Pharmaceutical)
- 5.4.5 Chemical
- 5.4.6 Other End-user Industries (Agriculture and Aquaculture, etc.)
- 5.5 By Geography (Volume)
- 5.5.1 Asia-Pacific
- 5.5.1.1 China
- 5.5.1.2 India
- 5.5.1.3 Japan
- 5.5.1.4 South Korea
- 5.5.1.5 Rest of Asia-Pacific
- 5.5.2 North America
- 5.5.2.1 United States
- 5.5.2.2 Canada
- 5.5.2.3 Mexico
- 5.5.3 Europe
- 5.5.3.1 Germany
- 5.5.3.2 United Kingdom
- 5.5.3.3 France
- 5.5.3.4 Italy
- 5.5.3.5 Rest of Europe
- 5.5.4 South America
- 5.5.4.1 Brazil
- 5.5.4.2 Argentina
- 5.5.4.3 Rest of South America
- 5.5.5 Middle-East and Africa
- 5.5.5.1 Saudi Arabia
- 5.5.5.2 South Africa
- 5.5.5.3 Rest of Middle-East and Africa
- 5.5.1 Asia-Pacific
6 Competitive Landscape
- 6.1 Market Concentration
- 6.2 Strategic Moves
- 6.3 Market Share(%)/Ranking Analysis
- 6.4 Company Profiles (includes Global-level Overview, Market-level Overview, Core Segments, Financials as available, Strategic Information, Products and Services, and Recent Developments)
- 6.4.1 ACURO ORGANICS LIMITED
- 6.4.2 Aditya Birla Chemicals
- 6.4.3 Airedale Group
- 6.4.4 Biosan
- 6.4.5 Brainerd Chemical
- 6.4.6 Christeyns
- 6.4.7 Diversey, Inc.
- 6.4.8 Ecolab
- 6.4.9 Enviro Tech Chemical Services, Inc.
- 6.4.10 Evonik Industries AG
- 6.4.11 Hydrite Chemical
- 6.4.12 Jubilant Pharmova Limited
- 6.4.13 Kemira
- 6.4.14 MITSUBISHI GAS CHEMICAL COMPANY, INC.
- 6.4.15 Solvay
- 6.4.16 STOCKMEIER Group
7 Market Opportunities and Future Outlook
- 7.1 White-space and Unmet-Need Assessment
- 7.2 Increasing Usage in Aseptic Packaging Applications

 2026-2034年食品加工領域過氧乙酸(PAA)全球市場規模、佔有率、趨勢和成長分析報告
 過氧乙酸市場:2026-2032年全球市場預測(依等級、配方類型、濃度等級、功能、終端用途產業及分銷通路分類)
 2026-2035 年食品加工用過氧乙酸 (PAA) 的市場機會、成長要素、產業趨勢和預測。
 過氧乙酸市場:市場規模、佔有率和趨勢分析(按等級、應用、最終用途和地區分類),細分市場預測(2026-2033 年)全球過氧乙酸市場規模、佔有率、趨勢和成長分析報告(2026-2034年)
 過氧乙酸市場:依等級、應用、最終用戶和地區分類
 過氧乙酸市場分析及預測(至2035年):類型、產品、應用、終端用戶、形態、技術、製程、材料類型、功能、設備
 過氧乙酸市場報告:依等級、應用、終端用戶產業及地區分類(2026-2034年)
 2026年過氧乙酸全球市場報告
 過氧乙酸市場 - 全球產業規模、佔有率、趨勢、機會及預測(按等級、應用、最終用途產業、地區和競爭格局分類,2021-2031年)