


 |
市場調查報告書
商品編碼
2101882
2026-2035 年食品加工用過氧乙酸 (PAA) 的市場機會、成長要素、產業趨勢和預測。Peracetic Acid (PAA) for Food Processing Market Opportunity, Growth Drivers, Industry Trend Analysis, and Forecast 2026 - 2035 |
||||||

預計到 2025 年,全球食品加工用過氧乙酸 (PAA) 市場規模將達到 5.061 億美元,年複合成長率為 5.5%,到 2035 年將達到 8.645 億美元。
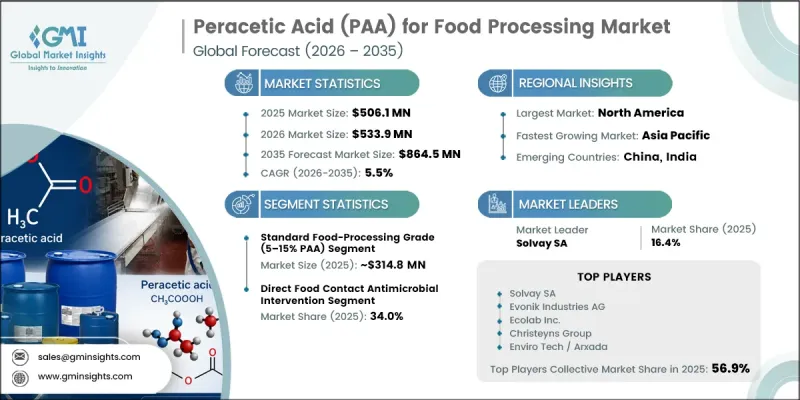
食品加工領域過氧乙酸 (PAA) 市場的成長並非由暫時的需求波動所驅動,而是由工業衛生實踐的長期變革所驅動。隨著製造商擴大採用先進的衛生解決方案,這些方案不僅具有強大的抗菌性能,還能滿足不斷變化的監管環境和永續性目標,PAA 產業在更廣泛的食品加工化學品和工業消毒劑市場中的地位也日益鞏固。對食品安全、營運效率和環保加工方法的日益重視,正促使食品製造企業更廣泛地採用基於 PAA 的衛生產品。食品加工操作的持續現代化、國際市場監管的日益協調以及全球食品供應鏈品質期望的不斷提高,都進一步推動了市場擴張。儘管北美和歐洲仍然是成熟的市場,但新興經濟體對食品加工基礎設施的加大投資預計將創造更多成長機會。
| 市場範圍 | |
|---|---|
| 開始年份 | 2025 |
| 預測期 | 2026-2035 |
| 上市時的市場規模 | 5.061億美元 |
| 預計金額 | 8.645億美元 |
| 複合年成長率 | 5.5% |
預計到2025年,標準食品加工級(PAA含量5-15%)產品將佔62.2%的市場佔有率,銷售額達3.148億美元。該產品憑藉其在性能、操作安全性、法規核准以及與食品加工要求廣泛兼容性方面的出色平衡,保持著主導地位。其在各種食品生產環境中的通用性以及支持檢驗的衛生管理方案的能力,使其成為尋求可靠抗菌解決方案的商業食品生產商的首選產品類型。
預計2025年,直接接觸食品的抗菌處理市佔率將達到34%。該應用領域的市場成長主要得益於抗菌處理解決方案的日益普及,這些方案不僅能提升食品安全,還能幫助加工商滿足不斷變化的監管要求。此外,向替代衛生管理技術的轉變以及對無殘留加工方法的日益重視,進一步增強了對該應用領域的需求,並推動了全球食品加工行業的長期發展。
至2025年,北美食品加工用過氧乙酸(PAA)市佔率將達到38.5%。該地區市場已趨於成熟,這得益於嚴格的食品安全法規、環保衛生技術的廣泛應用以及對無殘留抗菌解決方案的強勁需求。預計在預測期內,食品加工現代化改造的持續投資、高衛生標準以及清潔和衛生管理技術的不斷改進將支撐該地區市場的成長。
目錄
第1章:調查方法和範圍
第2章執行摘要
第3章 行業洞察
- 產業生態系分析
- 供應商情況
- 利潤率
- 每個階段增加的價值
- 影響價值鏈的因素
- 中斷
- 影響產業的因素
- 促進因素
- 加強全球食品安全法規,強制所有食品加工商實施HACCP。
- 在美國農業部 (USDA) 和歐盟政策的推動下,肉類和家禽加工產業逐步淘汰氯的使用正在加速。
- 包裝食品和加工食品需求的成長正在推動對無菌包裝生產線的投資。
- 產業潛在風險與挑戰
- 職業暴露與工人安全問題-刺激性氣味、腐蝕性和職業暴露限值標準的變化
- 與次氯酸鈉和季銨鹽消毒劑相比,其使用成本更高。
- 市場機遇
- 現場過氧乙酸 (PAA) 生成技術可降低物流成本和與運輸危險物質相關的責任。
- 進入有機食品加工領域-協調美國農業部國家有機計畫(NOP)和歐盟有機認證標準
- 促進因素
- 成長潛力分析
- 監理情勢
- 波特的分析
- PESTLE分析
- 價格趨勢
- 按地區
- 按塑膠等級
- 未來市場趨勢
- 技術與創新展望
- 最新科技趨勢
- 新興技術
- 專利趨勢
- 貿易統計
- 主要進口國
- 主要出口國
- 永續性和環境方面
- 永續計劃
- 減少廢棄物策略
- 生產中的能源效率
- 具有環保意識的舉措
- 考慮碳足跡
第4章 競爭情勢
- 介紹
- 企業市佔率分析
- 按地區
- 北美洲
- 歐洲
- 亞太地區
- 拉丁美洲
- 中東和非洲
- 按地區
- 主要市場公司的競爭分析
- 競爭定位矩陣
- 主要進展
- 併購
- 夥伴關係和聯盟
- 新產品發布
- 業務拓展計劃
第5章 市場估算與預測:依集中度等級分類,2022-2035年
- 低等級(<5% PAA)
- 標準食品加工級(5-15% PAA)
- 高濃度等級(PAA 超過 15%)
第6章 市場估計與預測:依功能類型分類,2022-2035年
- 採用CIP/SIP系統的衛生管理
- 與食品直接接觸的抗菌處理
- 處理水和冰以進行該過程
- 包裝材料的滅菌
- 其他
第7章 市場估計與預測:依最終用戶分類,2022-2035年
- 肉類和紅肉的加工
- 牛肉/小牛肉加工
- 豬肉加工
- 羊肉及其他紅肉的加工
- 家禽加工
- 肉雞加工
- 土耳其加工
- 鴨子和其他家禽的加工
- 海產品加工
- 乳製品加工
- 液態奶和奶油的加工
- 乳酪和發酵乳製品
- 冰淇淋和冷凍乳製品的加工
- 飲料加工
- 釀造(啤酒和精釀啤酒)
- 葡萄酒釀造和蘋果酒生產
- 軟性飲料、果汁和瓶裝水的加工
- 新鮮農產品、水果和蔬菜的加工
- 其他
第8章 市場估計與預測:依地區分類,2022-2035年
- 北美洲
- 美國
- 加拿大
- 歐洲
- 德國
- 英國
- 法國
- 西班牙
- 義大利
- 其他歐洲國家
- 亞太地區
- 中國
- 印度
- 日本
- 澳洲
- 韓國
- 其他亞太國家
- 拉丁美洲
- 巴西
- 墨西哥
- 阿根廷
- 其他拉丁美洲國家
- 中東和非洲
- 沙烏地阿拉伯
- 南非
- UAE
- 其他中東和非洲國家
第9章:公司簡介
- Acuro Organics Limited
- Airedale Group
- Belinka Perkemija
- BioSafe Systems LLC
- Biosan LLC
- Christeyns Group
- EcoCare Technologies
- Ecolab Inc
- Enviro Tech/Arxada
- Evonik Industries AG
- Hydrite Chemical Co.
- Solvay SA
The Global Peracetic Acid (PAA) for Food Processing Market was valued at USD 506.1 million in 2025 and is estimated to grow at a CAGR of 5.5% to reach USD 864.5 million by 2035.
Growth in the peracetic acid (PAA) for food processing market is driven by a long-term transformation in industrial sanitation practices rather than temporary fluctuations in demand. The industry continues to strengthen its position within the broader food processing chemicals and industrial biocides landscape as manufacturers increasingly adopt advanced sanitation solutions that offer strong antimicrobial performance while supporting evolving regulatory and sustainability objectives. Rising emphasis on food safety, operational efficiency, and environmentally responsible processing methods is encouraging wider adoption of PAA-based sanitizing products across food manufacturing facilities. Continued modernization of food processing operations, increasing regulatory alignment across international markets, and higher quality expectations throughout global food supply chains are further supporting market expansion. While North America and Europe remain well-established markets, increasing investments in food processing infrastructure across emerging economies are expected to create additional growth opportunities.
| Market Scope | |
|---|---|
| Start Year | 2025 |
| Forecast Year | 2026-2035 |
| Start Value | $506.1 Million |
| Forecast Value | $864.5 Million |
| CAGR | 5.5% |
The standard food-processing grade (5-15% PAA) segment accounted for 62.2% share in 2025, generating USD 314.8 million. The segment maintains its leading position because it offers an effective balance of performance, operational safety, regulatory acceptance, and broad compatibility with food processing requirements. Its versatility across multiple food production environments and its ability to support validated sanitation programs continue to make it the preferred product category for commercial food manufacturers seeking reliable antimicrobial solutions.
The direct food contact antimicrobial intervention segment held 34% share in 2025. Market growth within this application is being supported by increasing adoption of antimicrobial treatment solutions that improve food safety while helping processors comply with evolving regulatory requirements. The transition toward alternative sanitation technologies and greater emphasis on residue-free processing methods continue to strengthen demand for this application segment, supporting its long-term expansion across the global food processing industry.
North America Peracetic Acid (PAA) for Food Processing Market accounted for 38.5% share in 2025. The region continues to represent a mature market, supported by strict food safety regulations, widespread adoption of environmentally responsible sanitation technologies, and strong demand for residue-free antimicrobial solutions. Ongoing investments in food processing modernization, high hygiene standards, and continuous improvements in cleaning and sanitation practices are expected to sustain regional market growth throughout the forecast period.
Major companies operating in the global peracetic acid (PAA) for food processing market include Acuro Organics Limited, Airedale Group, Belinka Perkemija, BioSafe Systems LLC, Biosan LLC, Christeyns Group, EcoCare Technologies, Ecolab Inc., Enviro Tech / Arxada, Evonik Industries AG, Hydrite Chemical Co., and Solvay SA. Companies operating in the peracetic acid (PAA) for food processing market are strengthening their market presence by expanding production capacity, investing in advanced formulation technologies, and improving product performance to meet evolving food safety requirements. Many manufacturers are focusing on research and development to enhance antimicrobial efficiency while supporting environmentally responsible sanitation practices. Strategic partnerships, distribution agreements, and geographic expansion initiatives are helping companies increase customer reach across developed and emerging markets. Businesses are also emphasizing regulatory compliance, quality assurance, and sustainable manufacturing processes to strengthen customer confidence and maintain long-term competitiveness.
Table of Contents
Chapter 1 Methodology & Scope
- 1.1 Research approach
- 1.2 Quality Commitments
- 1.2.1 GMI AI policy & data integrity commitment
- 1.2.1.1 Source consistency protocol
- 1.2.1 GMI AI policy & data integrity commitment
- 1.3 Research Trail & Confidence Scoring
- 1.3.1 Research Trail Components
- 1.3.2 Scoring Components
- 1.4 Data Collection
- 1.4.1 Partial list of primary sources
- 1.5 Data mining sources
- 1.5.1 Paid sources
- 1.5.1.1 Sources, by region
- 1.5.1 Paid sources
- 1.6 Base estimates and calculations
- 1.6.1 Base year calculation for any one approach
- 1.7 Forecast model
- 1.7.1 Quantified market impact analysis
- 1.7.1.1 Mathematical impact of growth parameters on forecast
- 1.7.1 Quantified market impact analysis
- 1.8 Research transparency addendum
- 1.8.1 Source attribution framework
- 1.8.2 Quality assurance metrics
- 1.8.3 Our commitment to trust
Chapter 2 Executive Summary
- 2.1 Industry 360° synopsis
- 2.2 Key market trends
- 2.2.1 Regional
- 2.2.2 Concentration grade
- 2.2.3 Function type
- 2.2.4 End user
- 2.3 TAM Analysis, 2026-2035
Chapter 3 Industry Insights
- 3.1 Industry ecosystem analysis
- 3.1.1 Supplier landscape
- 3.1.2 Profit margin
- 3.1.3 Value addition at each stage
- 3.1.4 Factor affecting the value chain
- 3.1.5 Disruptions
- 3.2 Industry impact forces
- 3.2.1 Growth drivers
- 3.2.1.1 Tightening global food safety regulations & mandatory HACCP implementation across processors
- 3.2.1.2 Accelerating chlorine phase-out in meat & poultry processing driven by USDA & EU Policy
- 3.2.1.3 Growth of packaged & processed food demand driving aseptic packaging line investments
- 3.2.2 Industry pitfalls and challenges
- 3.2.2.1 Occupational exposure & worker safety concerns - pungent odor, corrosivity & evolving OEL standards
- 3.2.2.2 Higher cost-in-use relative to sodium hypochlorite & quaternary ammonium disinfectants
- 3.2.3 Market opportunities
- 3.2.3.1 On-Site PAA generation technology reducing logistics costs & hazardous transport liabilities
- 3.2.3.2 Expansion into organic food processing - USDA NOP & EU organic certification alignment
- 3.2.1 Growth drivers
- 3.3 Growth potential analysis
- 3.4 Regulatory landscape
- 3.4.1 North America
- 3.4.2 Europe
- 3.4.3 Asia Pacific
- 3.4.4 Latin America
- 3.4.5 Middle East & Africa
- 3.5 Porter's analysis
- 3.6 PESTEL analysis
- 3.7 Price trends
- 3.7.1 By region
- 3.7.2 By concetration grade
- 3.8 Future market trends
- 3.9 Technology and innovation landscape
- 3.9.1 Current technological trends
- 3.9.2 Emerging technologies
- 3.10 Patent Landscape
- 3.11 Trade statistics (HS code)
- 3.11.1 Major importing countries
- 3.11.2 Major exporting countries
- 3.12 Sustainability and environmental aspects
- 3.12.1 Sustainable practices
- 3.12.2 Waste reduction strategies
- 3.12.3 Energy efficiency in production
- 3.12.4 Eco-friendly initiatives
- 3.13 Carbon footprint consideration
Chapter 4 Competitive Landscape, 2025
- 4.1 Introduction
- 4.2 Company market share analysis
- 4.2.1 By region
- 4.2.1.1 North America
- 4.2.1.2 Europe
- 4.2.1.3 Asia Pacific
- 4.2.1.4 LATAM
- 4.2.1.5 MEA
- 4.2.1 By region
- 4.3 Competitive analysis of major market players
- 4.4 Competitive positioning matrix
- 4.5 Key developments
- 4.5.1 Mergers & acquisitions
- 4.5.2 Partnerships & collaborations
- 4.5.3 New Product Launches
- 4.5.4 Expansion Plans
Chapter 5 Market Estimates and Forecast, By Concentration Grade, 2022-2035 (USD Million) (Kilo Tons)
- 5.1 Key trends
- 5.2 Low grade (<5% PAA)
- 5.3 Standard food-processing grade (5-15% PAA)
- 5.4 High concentration grade (>15% PAA)
Chapter 6 Market Estimates and Forecast, By Function Type, 2022-2035 (USD Million) (Kilo Tons)
- 6.1 Key trends
- 6.2 CIP/SIP system sanitation
- 6.3 Direct food contact antimicrobial intervention
- 6.4 Process water & ice treatment
- 6.5 Packaging material sterilization
- 6.6 Others
Chapter 7 Market Estimates and Forecast, By End User, 2022-2035 (USD Million) (Kilo Tons)
- 7.1 Key trends
- 7.2 Meat & red meat processing
- 7.2.1 Beef & veal processing
- 7.2.2 Pork processing
- 7.2.3 Lamb & other red meat processing
- 7.3 Poultry processing
- 7.3.1 Broiler (chicken) processing
- 7.3.2 Turkey processing
- 7.3.3 Duck & other poultry processing
- 7.4 Seafood processing
- 7.5 Dairy processing
- 7.5.1 Fluid milk & cream processing
- 7.5.2 Cheese & fermented dairy processing
- 7.5.3 Ice cream & frozen dairy processing
- 7.6 Beverage processing
- 7.6.1 Brewing (beer & craft beer)
- 7.6.2 Winemaking & cider production
- 7.6.3 Soft drink, juice & bottled water processing
- 7.7 Fresh produce & fruits/vegetables processing
- 7.8 Others
Chapter 8 Market Estimates and Forecast, By Region, 2022-2035 (USD Million) (Kilo Tons)
- 8.1 Key trends
- 8.2 North America
- 8.2.1 U.S.
- 8.2.2 Canada
- 8.3 Europe
- 8.3.1 Germany
- 8.3.2 UK
- 8.3.3 France
- 8.3.4 Spain
- 8.3.5 Italy
- 8.3.6 Rest of Europe
- 8.4 Asia Pacific
- 8.4.1 China
- 8.4.2 India
- 8.4.3 Japan
- 8.4.4 Australia
- 8.4.5 South Korea
- 8.4.6 Rest of Asia Pacific
- 8.5 Latin America
- 8.5.1 Brazil
- 8.5.2 Mexico
- 8.5.3 Argentina
- 8.5.4 Rest of Latin America
- 8.6 Middle East and Africa
- 8.6.1 Saudi Arabia
- 8.6.2 South Africa
- 8.6.3 UAE
- 8.6.4 Rest of Middle East and Africa
Chapter 9 Company Profiles
- 9.1 Acuro Organics Limited
- 9.2 Airedale Group
- 9.3 Belinka Perkemija
- 9.4 BioSafe Systems LLC
- 9.5 Biosan LLC
- 9.6 Christeyns Group
- 9.7 EcoCare Technologies
- 9.8 Ecolab Inc
- 9.9 Enviro Tech / Arxada
- 9.10 Evonik Industries AG
- 9.11 Hydrite Chemical Co.
- 9.12 Solvay SA

 2026-2034年食品加工領域過氧乙酸(PAA)全球市場規模、佔有率、趨勢和成長分析報告
 過氧乙酸:市場佔有率分析、產業趨勢與統計、成長預測(2026-2031)
 過氧乙酸市場:2026-2032年全球市場預測(依等級、配方類型、濃度等級、功能、終端用途產業及分銷通路分類)
 過氧乙酸市場:市場規模、佔有率和趨勢分析(按等級、應用、最終用途和地區分類),細分市場預測(2026-2033 年)全球過氧乙酸市場規模、佔有率、趨勢和成長分析報告(2026-2034年)
 過氧乙酸市場:依等級、應用、最終用戶和地區分類
 過氧乙酸市場分析及預測(至2035年):類型、產品、應用、終端用戶、形態、技術、製程、材料類型、功能、設備
 過氧乙酸市場報告:依等級、應用、終端用戶產業及地區分類(2026-2034年)
 2026年過氧乙酸全球市場報告
 過氧乙酸市場 - 全球產業規模、佔有率、趨勢、機會及預測(按等級、應用、最終用途產業、地區和競爭格局分類,2021-2031年)