


 |
市場調查報告書
商品編碼
2123412
清潔機器人:市場佔有率分析、產業趨勢與統計、成長預測(2026-2031)Cleaning Robot - Market Share Analysis, Industry Trends & Statistics, Growth Forecasts (2026 - 2031) |
||||||

※ 本網頁內容可能與最新版本有所差異。詳細情況請與我們聯繫。
根據 Mordor Intelligence 預測,清潔機器人市場規模預計在 2025 年達到 168.9 億美元,2026 年達到 196.8 億美元,2031 年達到 385.2 億美元,2026 年至 2031 年的複合年成長率為 14.38%。
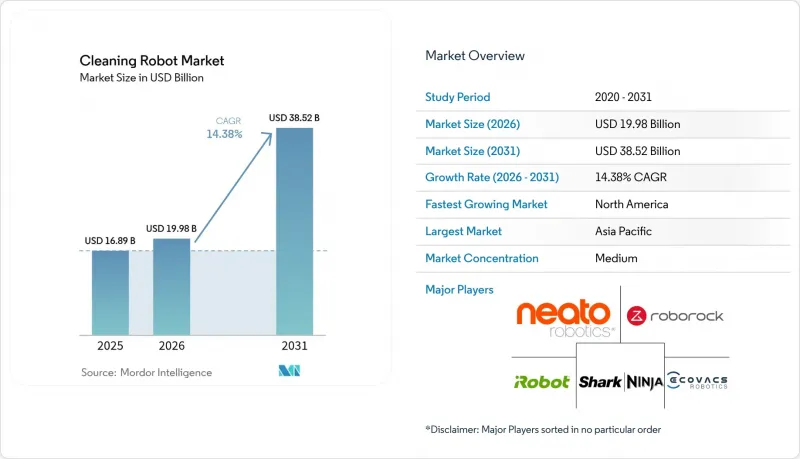
本報告按機器人類型(家用機器人[草坪清潔、泳池清潔等]和商用機器人[水箱、管道清潔等])、最終用戶(住宅、商業[酒店、醫療機構等]和工業)、銷售管道(線上、線下和機器人即服務)以及地區進行細分。市場預測以美元計價。
全球清潔機器人市場趨勢及洞察
疫情後商業場所衛生標準提高
在機場、飯店和醫院,持續且可見的清潔如今已被視為一項必不可少的設施。倫敦希思羅機場計畫在2025年引進50台自動地面清潔機,在實現全天候地面消毒的同時,減少了40%的人工時間。設施管理人員將符合審計要求的消毒記錄和病原體清除指標視為競標企業租戶時的重要優勢。商用清潔機器人價格通常高達3萬至12萬美元,但在人流量大的場所,其投資回收期不到18個月,因此其高昂的價格也越來越物有所值。更嚴格的感染控制標準鞏固了對紫外線C波段和靜電噴霧型清潔機器人的持續需求,確保了清潔機器人市場的持續成長。將合規性報告直接整合到車隊管理儀錶板中的供應商,正在增強其對規避風險的營運商的價值提案。
智慧家庭的快速普及和可支配收入的增加
在北美和西歐的家庭中,掃地機器人已從新奇產品轉變為必需品,這一轉變也體現在中國和東南亞都市區不斷上升的擁有率上。在2025年柏林國際消費電子展(IFA 2025)上,新發表的智慧家庭清潔設備中,94%是掃地機器人。根據Parks Associates的一份報告顯示,到2024年,42%的美國家庭將至少擁有一台智慧家居設備,其中掃地機器人的普及率位居第三。人工智慧避障、自動集塵盒以及吸塵拖地一體功能等功能創新,推動了掃地機器人每三到四年的更換。亞太地區可支配所得的成長擴大了顧客群體,使得300至800美元價位的產品能夠被日益壯大的中產階級所接受。這種人口結構的變化推動了掃地機器人市場兩位數的出貨量成長,即使在較成熟的地區,市場成長也趨於平緩。
與傳統設備相比,初始成本較高
商用機器人的價格通常是人工洗地機的10到40倍,這對預算緊張的企業來說無疑是一筆不小的開銷。雖然機器人即服務(RaaS)允許分期付款,但隱性成本、耗材、軟體訂閱和定期調整等費用加起來,每年會使總擁有成本(TCO)增加高達25%。在南美洲和非洲,由於家庭和企業的購買力落後於已開發地區,這一障礙尤為突出。供應商提供融資方案和預測性維護保障來減輕這一負擔,但許多企業仍在等待零件成本進一步下降才考慮採用機器人,這導致清潔機器人市場短期成長放緩。
細分市場分析
預計到2025年,家用機器人將佔總銷售量的71.32%,反映出它們作為智慧家庭必備產品的穩固地位;而商用機型預計將在2031年超越家用機型,年複合成長率將達到15.23%。吸塵器細分市場依然是核心,這主要得益於自動集塵底座和人工智慧避障等功能的升級換代。泳池清潔器構成了一個高利潤的細分市場,太陽能設計可將能耗降低高達80%。科沃斯(ECOVACS)累計售出150萬台窗戶清潔機器人,並擁有278項與吸力和邊緣檢測技術相關的專利。配備RTK-GPS的割草機器人正在郊區市場流行起來,例如Husqvarna的CEORA等商用機型售價在15,000歐元至20,000歐元(約合16,950美元至22,600美元)之間。
雖然商用機器人的銷售量可能較低,但它們的單一盈利很高,並且能夠深度整合到工作流程中。例如,一組地面清潔機器人可以與設施管理控制面板整合,單次充電即可清潔 20,000 平方英尺的面積,並即時傳輸使用指標。紫外線消毒設備目前已在日本和韓國的醫院中常規使用,可在 15 分鐘內減少 99.9% 的病原體。儲槽清潔機器人的價格在 50,000 美元到 200,000 美元之間,可最大限度地降低石油、化學和供水事業進入密閉空間的風險。訂閱模式正在加速其普及。根據國際機器人聯合會 (IFR) 的記錄,預計到 2024 年,機器人即服務 (RaaS) 的部署數量將成長 31%,這凸顯了向計量收費經濟模式的結構性轉變。
區域分析
由於採用智慧家庭的早期普及和嚴格的職場安全標準,北美預計將在2025年佔據全球39.41%的市場佔有率。美國處於主導地位,智慧家庭普及率在2024年達到42%,掃地機器人擁有率位居第三。同時,在加拿大,與感染控制相關的建築規範正在推動紫外線消毒機器人的普及。墨西哥的出口型製造商正在採用自動地面清潔設備以滿足ISO 14001認證的要求。然而,由於對中國製造的機器人徵收更高的關稅,導致零售價格上漲,價格彈性受到擠壓,一些買家正在轉向翻新產品和訂閱模式。
亞太地區預計將以15.07%的複合年成長率實現最高成長,主要受都市化和可支配收入成長的推動。中國領先的生物製藥公司科沃斯和石頭科技(Roborock)公佈,以當前外匯計算,2024年兩家公司的總合銷售額將超過10.9億美元,凸顯了中國國內市場的規模。日本累計50億日圓(約4,550萬美元)補貼醫院在2025年購買紫外線消毒機器人。在印度,電子商務的成長正在推動二線城市市場的發展,而新加坡的「ROBIN」計畫已使公共交通樞紐的病原體數量減少了60%。韓國和澳洲的特點是人均汽車擁有率高,這得益於緊湊的生活空間和精通技術的消費者群體。
歐洲、南美洲以及中東和非洲構成了清潔機器人市場。歐洲的《一般資料保護規則》(GDPR) 推動了對設備內建地圖功能的需求,這為該地區領先企業開發的結合雷射雷達和視覺技術的混合系統帶來了利好。預計2025年,英國窗戶清潔機器人市場規模將達到6,421萬英鎊(7,320萬美元)。德國和法國的汽車製造商正在其製造工廠部署機器人,以符合職業安全標準。南美市場對價格仍然高度敏感,導致分銷商選擇從中國分期付款進口中端機型。中東的主權財富基金正在資助公共場所的機器人部署,而非洲雖然仍面臨基礎設施的挑戰,但在南非的購物中心和奈及利亞的機場等場所,機器人的應用已經開始。
其他好處:
- Excel格式的市場預測(ME)表
- 3個月的分析師支持
目錄
第1章:引言
- 研究假設和市場定義
- 調查範圍
第2章:調查方法
第3章執行摘要
第4章 市場狀況
- 市場概覽
- 市場促進因素
- 疫情後如何提高商業設施的衛生標準
- 智慧家庭的快速普及和可支配收入的增加
- LiDAR和感測器套件的平均售價 (ASP) 下降,將減少物料清單 (BOM)。
- 電子商務通路的擴張正在加速全球擴張。
- 設施管理合約正朝著「機器人即服務」的方向轉變。
- 政府採購用於公共基礎設施的紫外線消毒機器人
- 市場限制因素
- 與傳統設備相比,初始成本較高
- 攝影機相關資料隱私問題/vSLAM地圖
- 固體LiDAR組件供應鏈中的脆弱性
- 對中國機器人出口徵收新的貿易關稅
- 產業價值鏈分析
- 監理情勢
- 技術展望
- 導航技術
- LiDAR SLAM
- 視覺SLAM(vSLAM)
- 混合式(雷射雷達+視覺)
- 隨機/紅外線法
- AI感測器融合套件
- 其他導航技術
- 導航技術
- 波特五力分析
- 宏觀經濟因素對市場的影響
第5章 市場規模與成長預測
- 按機器人類型
- 家用機器人
- 地板清潔機器人
- 泳池清潔
- 窗戶清潔機器人
- 草坪護理
- 其他家用/家庭機器人(用於清潔)
- 商用機器人
- 地板清潔
- 清洗儲槽、管道和管線
- 消毒機器人
- 其他商用清潔機器人
- 家用機器人
- 最終用戶
- 住宅
- 商業
- 飯店業
- 零售商店和購物中心
- 醫療機構
- 機場和交通樞紐
- 辦公室和企業設施
- 其他商業設施
- 工業(製造和倉儲)
- 按銷售管道
- 線上
- 離線
- 機器人即服務
- 按地區
- 北美洲
- 美國
- 加拿大
- 墨西哥
- 南美洲
- 巴西
- 阿根廷
- 其他南美國家
- 歐洲
- 德國
- 英國
- 法國
- 義大利
- 西班牙
- 其他歐洲國家
- 亞太地區
- 中國
- 日本
- 印度
- 新加坡
- 韓國
- 澳洲
- 其他亞太國家
- 中東
- 沙烏地阿拉伯
- 阿拉伯聯合大公國
- 土耳其
- 其他中東國家
- 非洲
- 南非
- 奈及利亞
- 其他非洲國家
- 北美洲
第6章 競爭情勢
- 市場集中度
- 策略趨勢
- 市佔率分析
- 公司簡介
- iRobot Corporation
- Ecovacs Robotics Co., Ltd.
- Roborock Technology Co., Ltd.
- Neato Robotics Inc.
- Dreame Technology(Suzhou)Co., Ltd.
- Narwal Robotics Inc.
- SharkNinja Operating LLC
- ILIFE Innovation Ltd.
- Cecotec Innovaciones SL
- bObsweep Inc.
- Proscenic Technology Co., Ltd.
- Anker Innovations Ltd.(Eufy)
- SoftBank Robotics Corp.
- Tennant Company
- Alfred Karcher SE and Co. KG
- Nilfisk A/S
- Avidbots Corp.
- Gaussian Robotics Co., Ltd.(Gausium)
- Midea Group Co., Ltd.(Eureka)
- Tineco Intelligent Technology Co., Ltd.
第7章 市場機會與未來展望
According to Mordor Intelligence, the cleaning robot market size is projected to be USD 16.89 billion in 2025, USD 19.68 billion in 2026, and reach USD 38.52 billion by 2031, growing at a CAGR of 14.38% from 2026 to 2031.
This report is Segmented by Robot Type (Domestic and Household Robots [Lawn Cleaning, Pool Cleaning, and More], and Professional Robots [Tank, Tube and Pipe Cleaning, and More]), End-User (Residential, Commercial [Hospitality, Healthcare Facilities, and More], and Industrial), Sales Channel (Online, Offline, and Robots-As-A-Service), and Geography. The Market Forecasts are Provided in Terms of Value (USD).
Global Cleaning Robot Market Trends and Insights
Rising Post-Pandemic Hygiene Standards in Commercial Spaces
Airports, hotels, and hospitals now treat continuous, highly visible cleaning as a non-negotiable amenity. At London Heathrow Airport, 50 autonomous scrubbers deployed in 2025 delivered a 40% reduction in labor hours while enabling 24/7 floor sanitization. Facility managers view audit-ready disinfection logs and pathogen-removal metrics as differentiators when bidding for corporate tenants. The premium commanded by professional cleaning robots, typically priced between USD 30,000 and USD 120,000, is increasingly justified by payback periods of under 18 months in high-traffic venues. Heightened infection-control standards lock in recurring demand for UV-C and electrostatic-spray variants, ensuring sustained growth in the cleaning robot market. Vendors that integrate compliance reporting directly into the fleet-management dashboard strengthen their value proposition to risk-averse operators.
Rapid Smart-Home Penetration and Disposable-Income Growth
Robot vacuums have graduated from novelty to necessity in North American and Western European households, a shift mirrored by rising ownership in Chinese and Southeast Asian urban centers. At IFA 2025, 94% of new smart-home cleaning launches were robotic vacuums. Parks Associates reported that 42% of U.S. homes owned at least one smart-home device in 2024, with robot vacuums ranking third in adoption. Feature innovation, AI obstacle avoidance, self-emptying docks, and combined vacuum-mop capability, encourages replacement purchases every three to four years. Disposable-income gains in Asia-Pacific expand the buyer pool, with units priced between USD 300 and USD 800 now within reach of the growing middle class. This demographic tailwind sustains double-digit unit growth for the cleaning robot market even as mature regions plateau.
High Upfront Cost Versus Conventional Equipment
Professional robots often carry price tags ten to forty times higher than manual scrubbers, creating sticker shock for budget-constrained operators. While robots-as-a-service spreads payments over time, hidden expenses, consumables, software subscriptions, and periodic recalibration, add up to 25% per year to total cost of ownership. The hurdle is most acute in South America and Africa, where household and enterprise purchasing power lags developed regions. Vendors bundle financing and predictive-maintenance guarantees to soften the blow, yet many facilities delay adoption until component costs fall further, tempering near-term growth in the cleaning robot market.
Other drivers and restraints analyzed in the detailed report include:
- Falling LiDAR and Sensor ASPs Reduce Bill of Materials Cost
- Facility-Management Contracts Shifting to Robots-As-A-Service
- Data-Privacy Concerns Over Camera/VSLAM Mapping
For complete list of drivers and restraints, kindly check the Table Of Contents.
Segment Analysis
Domestic robots accounted for 71.32% of revenue in 2025, reflecting their entrenched status as smart-home staples, but professional units are forecast to outpace them at a 15.23% CAGR to 2031. The vacuum sub-segment remains the cornerstone, benefiting from self-emptying docks and AI obstacle avoidance that spur upgrade cycles. Pool cleaners form a high-margin niche as solar-powered designs slash electricity use by up to 80%. ECOVACS has sold 1.5 million window-cleaning units cumulatively and holds 278 patents in suction and edge detection. Lawn-mowing robots equipped with RTK-GPS are scaling in suburban markets, with commercial models such as Husqvarna CEORA priced at EUR 15,000-20,000 (USD 16,950-22,600).
Professional robots, though smaller in unit volume, deliver higher revenue per device and deeper workflow integration. Floor-scrubber fleets connect to facility dashboards, covering 20,000 square feet per charge and sending real-time utilization metrics. UV-C disinfection units, now routine in Japanese and South Korean hospitals, achieve 99.9% pathogen reduction in 15-minute cycles. Tank-cleaning robots priced between USD 50,000 and USD 200,000 minimize confined-space entry risks in oil, chemical, and water utilities. Subscription models are accelerating adoption: the International Federation of Robotics recorded a 31% jump in robots-as-a-service fleets in 2024, underscoring the structural shift toward pay-per-use economics.
Complete Report Scope:
- By Robot Type
- Domestic and Household Robots
- Vacuum Floor Cleaner
- Pool Cleaning
- Window Cleaning
- Lawn Cleaning
- Other Domestic and Household Cleaning
- Professional Robots
- Floor Cleaning
- Tank, Tube and Pipe Cleaning
- Disinfection Robots
- Other Professional Cleaning
- Domestic and Household Robots
- By End-User
- Residential
- Commercial
- Hospitality
- Retail and Shopping Centres
- Healthcare Facilities
- Airports and Transportation Hubs
- Office and Corporate Facilities
- Other Commercial Facilities
- Industrial (Manufacturing and Warehousing)
- By Sales Channel
- Online
- Offline
- Robots-as-a-Service
- By Geography
- North America
- United States
- Canada
- Mexico
- South America
- Brazil
- Argentina
- Rest of South America
- Europe
- Germany
- United Kingdom
- France
- Italy
- Spain
- Rest of Europe
- Asia-Pacific
- China
- Japan
- India
- Singapore
- South Korea
- Australia
- Rest of Asia-Pacific
- Middle East
- Saudi Arabia
- United Arab Emirates
- Turkey
- Rest of Middle East
- Africa
- South Africa
- Nigeria
- Rest of Africa
- North America
Geography Analysis
North America generated 39.41% of 2025 revenue, underpinned by early smart-home adoption and stringent workplace-safety codes. The United States leads, with 42% household smart-home penetration in 2024 and robot vacuums ranking third in ownership, while Canada's infection-control building codes spur UV-robot uptake. Mexico's export-oriented manufacturing sector installs autonomous scrubbers to meet ISO 14001 compliance. Yet escalating tariffs on Chinese robots inflate retail prices, pressuring elasticity and nudging some buyers toward refurbished units or subscription models.
Asia-Pacific is expected to record the fastest 15.07% CAGR, fueled by urbanization and rising disposable incomes. Chinese giants Ecovacs and Roborock posted combined 2024 revenue exceeding USD 1.09 billion at prevailing exchange rates, underscoring domestic scale. Japan earmarked JPY 5 billion (USD 45.5 million) in subsidies for hospital UV-robot purchases in 2025. India's e-commerce growth opens tier-2 cities, while Singapore's ROBIN program showed a 60% pathogen-count reduction in public transport hubs. South Korea and Australia boast high per-capita ownership, aided by compact living spaces and tech-savvy consumers.
Europe, South America, Middle East, and Africa round out the cleaning robot market. Europe's GDPR drives demand for on-device mapping, a boon for hybrid LiDAR-plus-vision systems from regional leaders. The United Kingdom's window-robot segment reached GBP 64.21 million (USD 73.2 million) in 2025. German and French automakers deploy shop-floor robots for occupational safety compliance. South America remains highly price-sensitive, leading distributors to import mid-tier Chinese models with installment financing. Middle Eastern sovereign funds finance public-space fleets, while Africa's nascent adoption is visible in South African malls and Nigerian airports despite infrastructural challenges.
- iRobot Corporation
- Ecovacs Robotics Co., Ltd.
- Roborock Technology Co., Ltd.
- Neato Robotics Inc.
- Dreame Technology (Suzhou) Co., Ltd.
- Narwal Robotics Inc.
- SharkNinja Operating LLC
- ILIFE Innovation Ltd.
- Cecotec Innovaciones S.L.
- bObsweep Inc.
- Proscenic Technology Co., Ltd.
- Anker Innovations Ltd. (Eufy)
- SoftBank Robotics Corp.
- Tennant Company
- Alfred Karcher SE and Co. KG
- Nilfisk A/S
- Avidbots Corp.
- Gaussian Robotics Co., Ltd. (Gausium)
- Midea Group Co., Ltd. (Eureka)
- Tineco Intelligent Technology Co., Ltd.
Additional Benefits:
- The market estimate (ME) sheet in Excel format
- 3 months of analyst support
TABLE OF CONTENTS
1 INTRODUCTION
- 1.1 Study Assumptions and Market Definition
- 1.2 Scope of the Study
2 RESEARCH METHODOLOGY
3 EXECUTIVE SUMMARY
4 MARKET LANDSCAPE
- 4.1 Market Overview
- 4.2 Market Drivers
- 4.2.1 Rising Post-Pandemic Hygiene Standards in Commercial Spaces
- 4.2.2 Rapid Smart-Home Penetration and Disposable-Income Growth
- 4.2.3 Falling LiDAR and Sensor-Suite ASPs Reduce BOM Cost
- 4.2.4 E-Commerce Channel Scaling Accelerates Global Reach
- 4.2.5 Facility-Management Contracts Shifting to Robots-as-a-Service
- 4.2.6 Government Procurement of UV-Disinfection Bots for Public Infrastructure
- 4.3 Market Restraints
- 4.3.1 High Upfront Cost Versus Conventional Equipment
- 4.3.2 Data-Privacy Concerns over Camera / vSLAM Mapping
- 4.3.3 Supply-Chain Fragility for Solid-State LiDAR Components
- 4.3.4 Emerging Trade Tariffs on Chinese Robot Exports
- 4.4 Industry Value Chain Analysis
- 4.5 Regulatory Landscape
- 4.6 Technological Outlook
- 4.6.1 Navigation Technology
- 4.6.1.1 LiDAR SLAM
- 4.6.1.2 Visual SLAM (vSLAM)
- 4.6.1.3 Hybrid (LiDAR + Vision)
- 4.6.1.4 Random / Infra-Red Based
- 4.6.1.5 AI Sensor-Fusion Suites
- 4.6.1.6 Other Navigation Technologies
- 4.6.1 Navigation Technology
- 4.7 Porter's Five Forces Analysis
- 4.7.1 Bargaining Power of Suppliers
- 4.7.2 Bargaining Power of Buyers
- 4.7.3 Threat of New Entrants
- 4.7.4 Threat of Substitutes
- 4.7.5 Intensity of Competitive Rivalry
- 4.8 Impact of Macroeconomic Factors on the Market
5 MARKET SIZE AND GROWTH FORECASTS (VALUE)
- 5.1 By Robot Type
- 5.1.1 Domestic and Household Robots
- 5.1.1.1 Vacuum Floor Cleaner
- 5.1.1.2 Pool Cleaning
- 5.1.1.3 Window Cleaning
- 5.1.1.4 Lawn Cleaning
- 5.1.1.5 Other Domestic and Household Cleaning
- 5.1.2 Professional Robots
- 5.1.2.1 Floor Cleaning
- 5.1.2.2 Tank, Tube and Pipe Cleaning
- 5.1.2.3 Disinfection Robots
- 5.1.2.4 Other Professional Cleaning
- 5.1.1 Domestic and Household Robots
- 5.2 By End-User
- 5.2.1 Residential
- 5.2.2 Commercial
- 5.2.2.1 Hospitality
- 5.2.2.2 Retail and Shopping Centres
- 5.2.2.3 Healthcare Facilities
- 5.2.2.4 Airports and Transportation Hubs
- 5.2.2.5 Office and Corporate Facilities
- 5.2.2.6 Other Commercial Facilities
- 5.2.3 Industrial (Manufacturing and Warehousing)
- 5.3 By Sales Channel
- 5.3.1 Online
- 5.3.2 Offline
- 5.3.3 Robots-as-a-Service
- 5.4 By Geography
- 5.4.1 North America
- 5.4.1.1 United States
- 5.4.1.2 Canada
- 5.4.1.3 Mexico
- 5.4.2 South America
- 5.4.2.1 Brazil
- 5.4.2.2 Argentina
- 5.4.2.3 Rest of South America
- 5.4.3 Europe
- 5.4.3.1 Germany
- 5.4.3.2 United Kingdom
- 5.4.3.3 France
- 5.4.3.4 Italy
- 5.4.3.5 Spain
- 5.4.3.6 Rest of Europe
- 5.4.4 Asia-Pacific
- 5.4.4.1 China
- 5.4.4.2 Japan
- 5.4.4.3 India
- 5.4.4.4 Singapore
- 5.4.4.5 South Korea
- 5.4.4.6 Australia
- 5.4.4.7 Rest of Asia-Pacific
- 5.4.5 Middle East
- 5.4.5.1 Saudi Arabia
- 5.4.5.2 United Arab Emirates
- 5.4.5.3 Turkey
- 5.4.5.4 Rest of Middle East
- 5.4.6 Africa
- 5.4.6.1 South Africa
- 5.4.6.2 Nigeria
- 5.4.6.3 Rest of Africa
- 5.4.1 North America
6 COMPETITIVE LANDSCAPE
- 6.1 Market Concentration
- 6.2 Strategic Moves
- 6.3 Market Share Analysis
- 6.4 Company Profiles (includes Global Level Overview, Market Level Overview, Core Segments, Financials as available, Strategic Information, Market Rank / Share, Products and Services, Recent Developments)
- 6.4.1 iRobot Corporation
- 6.4.2 Ecovacs Robotics Co., Ltd.
- 6.4.3 Roborock Technology Co., Ltd.
- 6.4.4 Neato Robotics Inc.
- 6.4.5 Dreame Technology (Suzhou) Co., Ltd.
- 6.4.6 Narwal Robotics Inc.
- 6.4.7 SharkNinja Operating LLC
- 6.4.8 ILIFE Innovation Ltd.
- 6.4.9 Cecotec Innovaciones S.L.
- 6.4.10 bObsweep Inc.
- 6.4.11 Proscenic Technology Co., Ltd.
- 6.4.12 Anker Innovations Ltd. (Eufy)
- 6.4.13 SoftBank Robotics Corp.
- 6.4.14 Tennant Company
- 6.4.15 Alfred Karcher SE and Co. KG
- 6.4.16 Nilfisk A/S
- 6.4.17 Avidbots Corp.
- 6.4.18 Gaussian Robotics Co., Ltd. (Gausium)
- 6.4.19 Midea Group Co., Ltd. (Eureka)
- 6.4.20 Tineco Intelligent Technology Co., Ltd.
7 MARKET OPPORTUNITIES AND FUTURE OUTLOOK
- 7.1 White-Space and Unmet-Need Assessment

 船舶清潔機器人市場:依清潔方法、應用、最終用戶、技術、國家及地區分類-全球產業分析、市場規模、市場佔有率及2026年至2033年預測
 清潔設備及用品市場規模、佔有率及成長分析:依產品類型、通路、最終用戶及地區分類-2026-2033年產業預測
 全球機器人吸塵器市場規模、佔有率、趨勢和成長分析報告(2026-2034)
 自主清潔機器人市場預測至2034年—按清潔類型、導航、技術、應用、最終用戶和地區分類的全球分析
 機器人吸塵器市場-2026-2032年全球市場預測
 水下清潔機器人市場分析及預測(至2035年):類型、產品、技術、組件、應用、最終用戶、功能、安裝配置、設備
 清潔機器人市場商機、成長要素、產業趨勢分析及2026-2035年預測。
 智慧清潔與衛生市場規模、佔有率、趨勢及預測:按產品、應用和地區分類,2026-2034年
 2026-2030年全球機器人擦窗機市場泳池清潔機器人市場預測至2034年:全球分析(按泳池類型、動力來源、清潔類型、驅動機制、分銷管道、最終用戶和地區分類)