


 |
市場調查報告書
商品編碼
2123332
光調變器:市場佔有率分析、產業趨勢與統計、成長預測(2026-2031)Optical Modulators - Market Share Analysis, Industry Trends & Statistics, Growth Forecasts (2026 - 2031) |
||||||

※ 本網頁內容可能與最新版本有所差異。詳細情況請與我們聯繫。
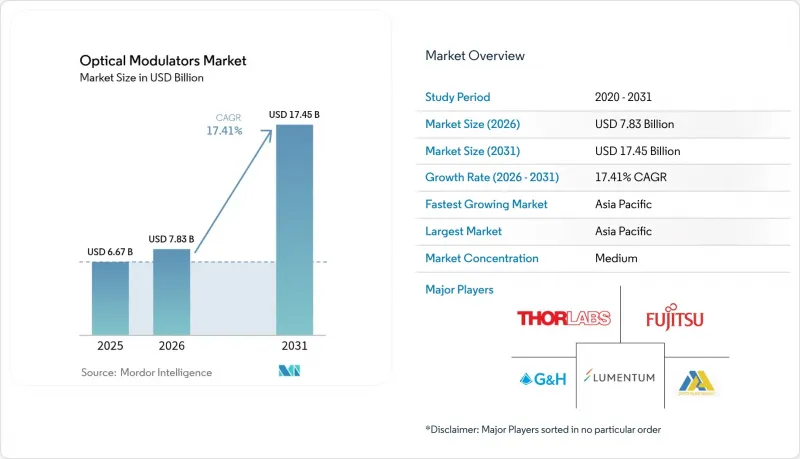
根據 Mordor Intelligence 預測,光調變器市場規模將從 2025 年的 66.7 億美元成長到 2026 年的 78.3 億美元,到 2031 年將達到 174.5 億美元,2026 年至 2031 年的複合年成長率為 17.41%。
本報告按產品類型(幅度調變器、偏振調變器等)、材料平台(鈮酸鋰、磷化銦等)、資料速率等級(低於 25 Gbps、25–50 Gbps 及其他)、應用(光纖通訊、光纖感測器等)和地區進行細分。市場預測以美元計價。
全球光調變器市場趨勢與洞察
加大對光纖通訊基礎設施的投資
隨著雲端服務供應商不斷降低每比特成本,人工智慧叢集建設已達到歷史新高,預計到2024年,800G收發器的出貨量將超過2,000萬台。從400G到800G的過渡,以及早期1.6T演示(例如Ciena公司使用224G SerDes的1.6T連貫光演示),都要求調製器在不超出功耗限制的情況下實現100 Gbaud的符號速率。線性可插拔光元件市場預計將從2024年的50億美元成長到2026年的100億美元以上,這將進一步推動對緊湊型、低Vπ架構的短期需求。共封裝光元件的熱設計裕度正變得越來越小,這有利於那些能夠在同一基板聯合最佳化驅動IC和調製器波導管的整合供應商。隨著交換器ASIC藍圖最終確定51T和102T架構,光引擎的搭載率正在加速,進一步增強了促進因素對短期複合年成長率的正面影響。
加速新興國家的 5G 和 FTTH 部署
在印度,隨著5G的推出,每月光纖鋪設里程飆升至101,550公里,是5G推出前的六倍。這清楚地表明,諸如通訊塔70%光纖覆蓋率等政策目標正在轉化為對光元件的實際需求。由於每個小型基地台至少需要一條25G或50G光纖去程傳輸鏈路,因此對兼顧成本和耐熱性的調製器需求旺盛。中國雲端營運商正在打造一個價值20-30億美元的國內收發器市場(預計2024年),這將強化區域採購週期,並對調製器製造工廠產生連鎖反應。能夠在各種環境條件下獲得設備認證的供應商,可以在公共電信業者的競標中獲得優先供應商地位,從而提升其中期成長前景。
設計複雜性與溫度控管限制超過 100 Gbaud
將符號速率提高到 100 Gbaud 以上會增加熱負載,使得微波和光訊號之間的速度匹配成為一項挑戰。麻省理工學院林肯實驗室的電感可調電極可以將頻寬擴展到 100 GHz 以上,同時保持 50 歐姆的電阻,但將這種創新技術整合到可製造的模組中仍然困難重重。專用基板和液態金屬導熱通孔會增加物料清單 (BOM) 的成本,延長認證週期,限制短期供應的靈活性,並降低複合年成長率 (CAGR)。
細分市場分析
相位調製器作為連貫檢測的基礎,預計到2025年將佔據光調變器市場37.65%的佔有率。然而,整合式調變器晶片預計將以18.05%的最高複合年成長率成長,因為共封裝光學元件採用基板設計來降低功耗和延遲。隨著Tower Semiconductor等晶圓代工廠推進400G/通道單元的認證,整合晶片相關的光調變器市場規模正在不斷擴大。
傳統的振幅和偏振裝置仍然廣泛應用於直接檢測和感測領域。類比調製器在光纖無線電(RoF)領域佔據著獨特的地位,在該領域,線性度比速度更為重要。晶圓級測試的普及正在降低平均售價(ASP),吸引在光電和電子學領域擁有專業知識的新參與企業。
由於鈮酸鋰具有優異的電光係數和溫度穩定性,其市佔率高達43.55%。然而,隨著CMOS晶圓廠實現大規模生產並降低成本,矽光電正以18.25%的複合年成長率快速成長。隨著大規模雲端服務供應商要求從單一供應商獲得端到端的光子積體電路,矽光電光調變器的市場規模正在不斷擴大。磷化銦在整合雷射至關重要的領域仍然佔據一定地位,而電光聚合物適用於100 GHz以上的微波光電,儘管其可靠性仍面臨挑戰。
區域分析
預計到2025年,亞太地區將佔據光調變器市場38.35%的佔有率。這主要得益於中國垂直整合的收發器生態系統以及印度快速推進通訊塔光纖化建設。該地區強大的製造業基礎降低了物料清單(BOM)成本,從而能夠快速部署到5G和FTTH服務區域。政府補貼計劃和在地採購義務進一步鞏固了生產。在北美,儘管市場已趨於成熟,但創新主導的需求仍然強勁。超大規模營運商和國防巨頭正在採用尖端的薄膜鈮酸鋰(LiNbO3)和矽光電來支援人工智慧架構和量子研究。在歐洲,都會區網路的持續升級仍在進行,汽車LiDAR和工業感測技術正在為模擬調製器和偏振調製器開闢新的相關市場。與新興經濟體以銷售主導成長不同,這些成熟地區的光調變器市場規模正透過技術創新不斷擴大。
其他好處:
- Excel格式的市場預測(ME)表
- 3個月的分析師支持
目錄
第1章:引言
- 研究假設和市場定義
- 調查範圍
第2章:調查方法
第3章執行摘要
第4章 市場狀況
- 市場概覽
- 市場促進因素
- 加大對光纖通訊基礎設施的投資
- 超大規模資料中心擴展和 800 G/1.6T光纖通訊藍圖
- 加速新興國家的 5G 和 FTTH 部署
- 在城域/長途網路中過渡到 400G 或更高速率的連貫光纖通訊
- 絕緣體上鈮酸鋰(LNOI)調製器的商業化
- 對量子光電和低溫互連技術的需求
- 市場限制因素
- 超過 100 Gbaud 時,設計複雜性和溫度控管的限制會增加。
- InP/LiNbO3晶圓和輪詢製程的物料清單成本較高
- 高速光電封裝領域技術純熟勞工短缺
- 上游鋰礦供應鏈中的風險集中
- 產業供應鏈分析
- 監理情勢
- 宏觀經濟因素的影響
- 技術展望
- 波特五力分析
第5章 市場規模與成長預測
- 依產品類型
- 幅度調製器
- 偏振調製器
- 相位調製器
- 類比調製器
- 整合(SiPh/InP/LNOI)調製器晶片
- 透過材料平台
- 鈮酸鋰(LiNbO3)
- 磷化銦(InP)
- 矽光電(SiPh)
- 電光聚合物
- 其他
- 按數據速率等級
- 25 Gbps 或更低
- 25~50 Gbps
- 50~100 Gbps
- 超過 100 Gbps
- 透過使用
- 光纖通訊
- 資料中心互連
- 5G去程傳輸/回程傳輸
- 海底電纜
- 地鐵/長途
- 光纖感測器
- 工業和結構健康監測
- 石油和天然氣監測
- 太空與國防
- 測試和測量設備
- 量子計算與低溫技術的關係
- 光纖通訊
- 按地區
- 北美洲
- 美國
- 加拿大
- 墨西哥
- 南美洲
- 巴西
- 阿根廷
- 其他南美國家
- 歐洲
- 德國
- 英國
- 法國
- 義大利
- 西班牙
- 俄羅斯
- 其他歐洲國家
- 亞太地區
- 中國
- 日本
- 印度
- 韓國
- 東南亞
- 其他亞太國家
- 中東和非洲
- 中東
- 沙烏地阿拉伯
- 阿拉伯聯合大公國
- 土耳其
- 其他中東國家
- 非洲
- 南非
- 奈及利亞
- 其他非洲國家
- 中東
- 北美洲
第6章 競爭情勢
- 市場集中度
- 策略趨勢
- 市佔率分析
- 公司簡介
- Lumentum Holdings Inc.
- Fujitsu Optical Components Ltd.
- Thorlabs Inc.
- Hamamatsu Photonics KK
- Lightwave Logic Inc.
- Gooch and Housego PLC
- APE Angewandte Physik and Elektronik GmbH
- AA Opto-Electronic SAS
- Conoptics Inc.
- L3Harris Technologies Inc.
- AMS Technologies AG
- Sumitomo Electric Device Innovations USA Inc.
- iXblue Photonics(Exail)
- Ciena Corporation
- Civicom Photonics
- HyperLight Corp.
- Keysight Technologies Inc.
- ThinkPhotonics Ltd.
- Optilab LLC
- Mellanox Technologies(NVIDIA Photonics)
第7章 市場機會與未來展望
According to Mordor Intelligence, the optical modulators market size is expected to grow from USD 6.67 billion in 2025 to USD 7.83 billion in 2026 and is forecast to reach USD 17.45 billion by 2031 at 17.41% CAGR over 2026-2031.
This report is Segmented by Product Type (Amplitude Modulators, Polarization Modulators, and More), Material Platform (Lithium Niobate, Indium Phosphide, and More), Data-Rate Class (Less Than or Equal To 25 Gbps, 25 - 50 Gbps, and More), Application (Optical Communication, Fiber-Optic Sensors, and More), and Geography. The Market Forecasts are Provided in Terms of Value (USD).
Global Optical Modulators Market Trends and Insights
Rising investments in optical-fiber communication infrastructure
Record AI cluster build-outs lifted 800 G transceiver shipments past 20 million units in 2024 as cloud providers chased lower cost-per-bit metrics. The pivot from 400 G to 800 G, and early 1.6 T proof-points such as Ciena's 1.6 T coherent-lite demo using 224 G SerDes, compel modulators to hit 100 Gbaud symbol rates without breaking power budgets. Linear pluggable optics are doubling from USD 5 billion in 2024 to more than USD 10 billion by 2026, amplifying short-term demand for compact, low-Vπ architectures. Thermal design margins tighten inside co-packaged optics, rewarding integrated suppliers that can co-optimize driver ICs and modulator waveguides on the same substrate. As switch ASIC roadmaps lock in 51 T and 102 T fabrics, optical-engine attach rates accelerate, reinforcing the driver's positive impact on near-term CAGR.
Accelerated 5G and FTTH rollout in emerging economies
India's monthly fiber deployment spiked to 101,550 km after 5G launch, six times the pre-5G run-rate, underlining how policy targets such as 70% tower fiberization translate into real optical component pull-through. Each small cell needs at least one 25 G or 50 G optical fronthaul link, so modulators tuned for cost and temperature resilience see large-volume orders. Chinese cloud operators generated a USD 2-3 billion domestic transceiver market in 2024, reinforcing regional procurement cycles that ripple through modulator fabs. Vendors able to qualify devices under wide environmental ranges win preferred-supplier status in public-telecom tenders, elevating medium-term growth prospects.
Design complexity and thermal-management limits above 100 Gbaud
Pushing symbol rates past 100 Gbaud inflates thermal load and challenges velocity matching between microwave and optical signals. MIT Lincoln Laboratory's inductance-tuned electrodes stretch bandwidth beyond 100 GHz while holding 50-ohm impedance, but packaging such innovations into manufacturable modules remains difficult. Exotic substrates and liquid-metal thermal vias raise BOM and lengthen qualification cycles, limiting short-term supply diversity and depressing CAGR.
Other drivers and restraints analyzed in the detailed report include:
- Move to coherent optics >= 400 G on metro/long-haul links
- Commercialization of lithium-niobate-on-insulator (LNOI) modulators
- High BOM cost of InP/LiNbO3 wafers and poling processes
For complete list of drivers and restraints, kindly check the Table Of Contents.
Segment Analysis
Phase modulators owned 37.65% of the optical modulators market share in 2025 as they remain fundamental for coherent detection. Integrated modulator chips, however, will post the strongest 18.05% CAGR because co-packaged optics depends on single-substrate designs that trim power and latency. The optical modulators market size tied to integrated chips expands as foundries like Tower Semiconductor qualify 400 G-per-lane units.
Established amplitude and polarization devices continue serving direct-detection and sensing. Analog modulators keep niche radio-over-fiber footholds where linearity trumps speed. The shift toward wafer-level test drives ASP reduction, inviting new entrants that master photonic-electronic co-design.
Lithium niobate held a 43.55% share thanks to its superior electro-optic coefficient and temperature stability. Yet silicon photonics is accelerating at 18.25% CAGR because CMOS fabs unlock high-volume, low-cost runs. The optical modulators market size attributable to silicon photonics rises as large cloud buyers demand single-supplier photonic ICs end-to-end. Indium phosphide retains a foothold where integrated lasers are mandatory, while electro-optic polymers address >100 GHz microwave photonics, though reliability hurdles persist.
Complete Report Scope:
- By Product Type
- Amplitude Modulators
- Polarization Modulators
- Phase Modulators
- Analog Modulators
- Integrated (SiPh/InP/LNOI) Modulator Chips
- By Material Platform
- Lithium Niobate (LiNbO?)
- Indium Phosphide (InP)
- Silicon Photonics (SiPh)
- Electro-optic Polymer
- Others
- By Data-Rate Class
- Less than or Equal to 25 Gbps
- 25 - 50 Gbps
- 50 - 100 Gbps
- Greater than 100 Gbps
- By Application
- Optical Communication
- Datacentre Interconnect
- 5 G Fronthaul / Backhaul
- Sub-sea Cables
- Metro / Long-haul
- Fiber-optic Sensors
- Industrial and Structural Health
- Oil and Gas Monitoring
- Space and Defence
- Test and Measurement Equipment
- Quantum Computing and Cryogenic Links
- Optical Communication
- By Geography
- North America
- United States
- Canada
- Mexico
- South America
- Brazil
- Argentina
- Rest of South America
- Europe
- Germany
- United Kingdom
- France
- Italy
- Spain
- Russia
- Rest of Europe
- Asia-Pacific
- China
- Japan
- India
- South Korea
- South-East Asia
- Rest of Asia-Pacific
- Middle East and Africa
- Middle East
- Saudi Arabia
- United Arab Emirates
- Turkey
- Rest of Middle East
- Africa
- South Africa
- Nigeria
- Rest of Africa
- Middle East
- North America
Geography Analysis
Asia-Pacific accounted for 38.35% of the optical modulators market share in 2025, fueled by China's vertically integrated transceiver ecosystem and India's sprint to fiberize towers. Regional manufacturing depth keeps BOM low, allowing rapid deployment across 5G and FTTH footprints. Government subsidy programs and local sourcing mandates further anchor production. North America shows mature but innovation-led demand, with hyperscale operators and defense primes adopting cutting-edge thin-film LiNbO3 and silicon photonics to support AI fabrics and quantum research. Europe maintains steady upgrades in metro networks while automotive LiDAR and industrial sensing open adjacencies for analog and polarization modulators. The optical modulators market size in these mature regions grows via technology refresh, contrasting with volume-driven expansion in emerging economies.
- Lumentum Holdings Inc.
- Fujitsu Optical Components Ltd.
- Thorlabs Inc.
- Hamamatsu Photonics K.K.
- Lightwave Logic Inc.
- Gooch and Housego PLC
- APE Angewandte Physik and Elektronik GmbH
- AA Opto-Electronic SAS
- Conoptics Inc.
- L3Harris Technologies Inc.
- AMS Technologies AG
- Sumitomo Electric Device Innovations USA Inc.
- iXblue Photonics (Exail)
- Ciena Corporation
- Civicom Photonics
- HyperLight Corp.
- Keysight Technologies Inc.
- ThinkPhotonics Ltd.
- Optilab LLC
- Mellanox Technologies (NVIDIA Photonics)
Additional Benefits:
- The market estimate (ME) sheet in Excel format
- 3 months of analyst support
TABLE OF CONTENTS
1 INTRODUCTION
- 1.1 Study Assumptions and Market Definition
- 1.2 Scope of the Study
2 RESEARCH METHODOLOGY
3 EXECUTIVE SUMMARY
4 MARKET LANDSCAPE
- 4.1 Market Overview
- 4.2 Market Drivers
- 4.2.1 Rising investments in optical-fiber communication infrastructure
- 4.2.2 Hyperscale datacenter expansion and 800 G/1.6 T optics road-map
- 4.2.3 Accelerated 5 G and FTTH rollout in emerging economies
- 4.2.4 Move to coherent optics greater than or equal to?400 G on metro/long-haul links
- 4.2.5 Commercialisation of lithium-niobate-on-insulator (LNOI) modulators
- 4.2.6 Quantum photonics and cryogenic interconnect demand
- 4.3 Market Restraints
- 4.3.1 Design complexity and thermal-management limits above 100 Gbaud
- 4.3.2 High BOM cost of InP/LiNbO? wafers and poling processes
- 4.3.3 Skilled-labour shortage in high-speed photonics packaging
- 4.3.4 Upstream lithium-ore supply-chain concentration risk
- 4.4 Industry Supply-Chain Analysis
- 4.5 Regulatory Landscape
- 4.6 Impact of Macroeconomic Factors
- 4.7 Technological Outlook
- 4.8 Porter's Five Forces Analysis
- 4.8.1 Bargaining Power of Suppliers
- 4.8.2 Bargaining Power of Consumers
- 4.8.3 Threat of New Entrants
- 4.8.4 Threat of Substitutes
- 4.8.5 Intensity of Competitive Rivalry
5 MARKET SIZE AND GROWTH FORECASTS (VALUE)
- 5.1 By Product Type
- 5.1.1 Amplitude Modulators
- 5.1.2 Polarization Modulators
- 5.1.3 Phase Modulators
- 5.1.4 Analog Modulators
- 5.1.5 Integrated (SiPh/InP/LNOI) Modulator Chips
- 5.2 By Material Platform
- 5.2.1 Lithium Niobate (LiNbO?)
- 5.2.2 Indium Phosphide (InP)
- 5.2.3 Silicon Photonics (SiPh)
- 5.2.4 Electro-optic Polymer
- 5.2.5 Others
- 5.3 By Data-Rate Class
- 5.3.1 Less than or Equal to 25 Gbps
- 5.3.2 25 - 50 Gbps
- 5.3.3 50 - 100 Gbps
- 5.3.4 Greater than 100 Gbps
- 5.4 By Application
- 5.4.1 Optical Communication
- 5.4.1.1 Datacentre Interconnect
- 5.4.1.2 5 G Fronthaul / Backhaul
- 5.4.1.3 Sub-sea Cables
- 5.4.1.4 Metro / Long-haul
- 5.4.2 Fiber-optic Sensors
- 5.4.2.1 Industrial and Structural Health
- 5.4.2.2 Oil and Gas Monitoring
- 5.4.3 Space and Defence
- 5.4.4 Test and Measurement Equipment
- 5.4.5 Quantum Computing and Cryogenic Links
- 5.4.1 Optical Communication
- 5.5 By Geography
- 5.5.1 North America
- 5.5.1.1 United States
- 5.5.1.2 Canada
- 5.5.1.3 Mexico
- 5.5.2 South America
- 5.5.2.1 Brazil
- 5.5.2.2 Argentina
- 5.5.2.3 Rest of South America
- 5.5.3 Europe
- 5.5.3.1 Germany
- 5.5.3.2 United Kingdom
- 5.5.3.3 France
- 5.5.3.4 Italy
- 5.5.3.5 Spain
- 5.5.3.6 Russia
- 5.5.3.7 Rest of Europe
- 5.5.4 Asia-Pacific
- 5.5.4.1 China
- 5.5.4.2 Japan
- 5.5.4.3 India
- 5.5.4.4 South Korea
- 5.5.4.5 South-East Asia
- 5.5.4.6 Rest of Asia-Pacific
- 5.5.5 Middle East and Africa
- 5.5.5.1 Middle East
- 5.5.5.1.1 Saudi Arabia
- 5.5.5.1.2 United Arab Emirates
- 5.5.5.1.3 Turkey
- 5.5.5.1.4 Rest of Middle East
- 5.5.5.2 Africa
- 5.5.5.2.1 South Africa
- 5.5.5.2.2 Nigeria
- 5.5.5.2.3 Rest of Africa
- 5.5.5.1 Middle East
- 5.5.1 North America
6 COMPETITIVE LANDSCAPE
- 6.1 Market Concentration
- 6.2 Strategic Moves
- 6.3 Market Share Analysis
- 6.4 Company Profiles (includes Global-level Overview, Market-level Overview, Core Segments, Financials as available, Strategic Information, Market Rank/Share, Products and Services, Recent Developments)
- 6.4.1 Lumentum Holdings Inc.
- 6.4.2 Fujitsu Optical Components Ltd.
- 6.4.3 Thorlabs Inc.
- 6.4.4 Hamamatsu Photonics K.K.
- 6.4.5 Lightwave Logic Inc.
- 6.4.6 Gooch and Housego PLC
- 6.4.7 APE Angewandte Physik and Elektronik GmbH
- 6.4.8 AA Opto-Electronic SAS
- 6.4.9 Conoptics Inc.
- 6.4.10 L3Harris Technologies Inc.
- 6.4.11 AMS Technologies AG
- 6.4.12 Sumitomo Electric Device Innovations USA Inc.
- 6.4.13 iXblue Photonics (Exail)
- 6.4.14 Ciena Corporation
- 6.4.15 Civicom Photonics
- 6.4.16 HyperLight Corp.
- 6.4.17 Keysight Technologies Inc.
- 6.4.18 ThinkPhotonics Ltd.
- 6.4.19 Optilab LLC
- 6.4.20 Mellanox Technologies (NVIDIA Photonics)
7 MARKET OPPORTUNITIES AND FUTURE OUTLOOK
- 7.1 White-space and Unmet-need Assessment


