


 |
市場調查報告書
商品編碼
2123323
資產追蹤:市場佔有率分析、產業趨勢與統計、成長預測(2026-2031)Asset Tracking - Market Share Analysis, Industry Trends & Statistics, Growth Forecasts (2026 - 2031) |
||||||

※ 本網頁內容可能與最新版本有所差異。詳細情況請與我們聯繫。
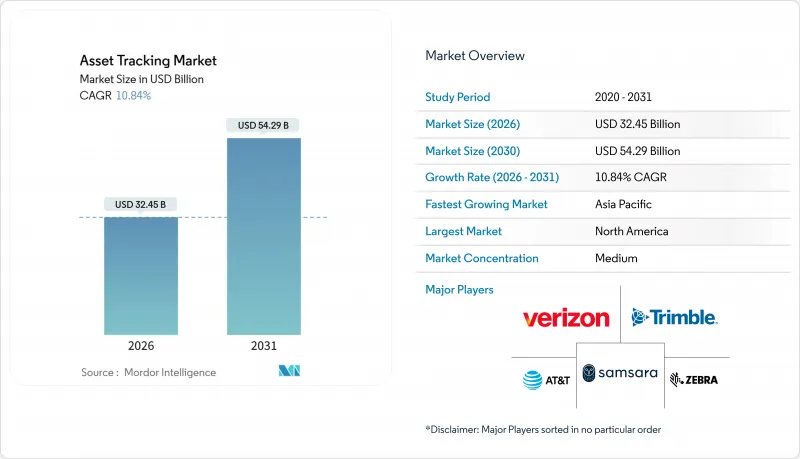
根據 Mordor Intelligence 預測,資產追蹤市場規模預計將在 2026 年達到 324.5 億美元,到 2031 年將擴大到 542.9 億美元,預測期內複合年成長率為 10.84%。
本報告按組件(硬體和軟體)、部署模式(雲端和本地部署)、技術類型(RFID、GPS/GNSS 等)、終端用戶行業(運輸和物流、航空、醫療等)、資產類型(車輛、無動力拖車和貨櫃、重型機械和設備等)以及地區進行細分。市場預測以美元計價。
全球資產追蹤市場趨勢與洞察
第三方物流和電子商務物流的擴張需要即時可視性。
目前,第三方物流(3PL) 供應商正在為向終端用戶提供即時配送地圖的電商平台處理激增的小包裹量。亞馬遜強制要求每次配送都必須提供 GPS 座標,迫使本地承運商維修車輛,否則將面臨失去合約的風險。沃爾瑪要求托盤在離開碼頭後 15 分鐘內進行 RFID 掃描,並對未能遵守規定的供應商處以每季超過 5 萬美元的扣回爭議帳款。東南亞海關當局正在試行將區塊鏈連接的 GPS 追蹤數據應用於海關申報自動化,以縮短清關時間。此外,由於企業已以持續審計取代了季度對賬,基於雲端的儀錶板的持續使用已使發票糾紛減少了 30%。這些視覺化要求已將資產追蹤市場融入線上零售的核心服務承諾中,確保即使運費下降,相關支出也能保持永續。
降低物聯網感測器和GPS追蹤器的成本
得益於6奈米半導體製程的轉變,矽晶圓面積減半,整合GPS和溫度感測器的蜂巢式物聯網模組預計到2025年將降至4.80美元。低功耗藍牙(BLE)信標的零售價低於3美元,在超市試點項目中實現了箱級標籤化,並減少了18%的食物廢棄物。被動式超高頻射頻識別(UHF RFID)標籤的價格現已降至0.06美元,使服裝公司能夠追蹤每一件服裝。沃達豐將NB-IoT設備與五年數據合約捆綁銷售,無需預付費用,將資本投資轉化為可預測的營運成本。硬體准入門檻的降低正在擴大小型營運商的市場基礎,並推動整體資產追蹤市場的擴張。
中小企業初始硬體和整合成本高昂
對於車隊規模小於 50 輛車的企業,追蹤器、佈線和系統整合的實施成本通常超過 5 萬美元。人事費用平均每輛車 300 美元,而與 ERP 平台進行 API 整合則需要超過 200 小時的諮詢服務,每小時 150 美元。每月 SaaS 費用為每輛車 25 至 40 美元。由於拉丁美洲和東南亞貨運的利潤率僅為 6% 至 9%,投資回報期超過兩年,減緩了小規模企業採用該系統的步伐。
細分市場分析
到2025年,硬體將佔總收入的58.14%,佔據資產追蹤市場最大佔有率。然而,隨著供應商轉向捆綁分析、API連接器和監管報告工具的訂閱模式,軟體收入正以11.20%的複合年成長率成長。這種轉變使得供應商無需額外硬體成本即可將單一軟體授權提升銷售至新的資產類別,從而提高毛利率。預計這一趨勢將推動資產追蹤市場整體成長至2031年。藍牙信標價格的下降迫使硬體供應商透過無線韌體更新和邊緣分析來實現差異化,這些技術可將蜂窩數據使用量降低高達30%。同時,車隊管理人員越來越傾向於使用能夠根據利用率和維護風險自動對資產進行排名的儀表板。預測性維護演算法已將建築車隊的意外停機時間減少了28%,產生的間接成本節約超過了初始許可費用,並提高了合約續約率。
經常性收入也正在改變供應商和客戶之間的權力模式。由於客戶可以取消月度合約,平台現在更加重視用戶體驗指標,例如五分鐘快速上手和單螢幕管理混合車隊。自動化合規模組,包括數位交貨證書和電子駕駛記錄,進一步將軟體層融入日常營運。獨立軟體供應商正在整合電子簽章採集功能並簡化FDA 21 CFR Part 11文件流程——這是純硬體競爭對手無法複製的功能。這些高度根深蒂固的工作流程使軟體成為資產追蹤市場的策略性成長引擎,而商品化設備只是相容的終端。
預計到2025年,雲端服務將佔總收入的63.15%,複合年成長率達11.38%,反映出中型貨運代理商避免在資料中心進行資本投資的趨勢。計量型收費系統意味著支出根據貨運量而定,客戶在假期季節增加季節性拖車時,只需購買額外的設備額度,而無需購買新的許可證。每週發布的新功能會立即透過多租戶架構反映出來,使用戶能夠在無需計劃停機的情況下利用地理圍欄模板、即時異常警報和承運商API整合。因此,雲端服務在資產追蹤市場中佔據最大佔有率,並且沒有飽和的徵兆。
在國防、飛機維修和製藥等冷鏈產業,本地部署解決方案仍然普遍存在,因為資料主權和檢驗的運算環境至關重要。然而,即使是受監管的企業也開始採用混合拓撲結構,將敏感資料儲存在本地,同時將不太重要的遙測資料傳輸到公共雲端進行分析。這種模式透過將報告和機器學習工作負載轉移異地,從而降低了純粹的本地部署支出,推動了雲端市場佔有率的成長。歐洲和北美部分地區不斷上漲的電力和冷卻成本進一步強化了雲端訂閱在總體擁有成本 (TCO) 分析中的優勢。在整個預測期內,雲端架構的靈活性將確保其繼續成為資產追蹤市場的主要成長要素。
區域分析
預計到2025年,亞太地區將佔全球銷售額的40.28%,該地區的資產追蹤市場預計到2031年將以11.56%的複合年成長率成長。中國的「一帶一路」計劃要求文件必須包含記錄的GPS位置資訊以加快通關程序;印度的電子運單系統強制要求對超過50公里的跨州運輸車輛進行即時追蹤。日本的智慧物流計畫將自動駕駛卡車與物聯網標籤貨物結合,展現了政府對視覺化技術的支持。預計到2025年,中國宅配處理量將達到1,350億件,將使使用RFID掃描器實現自動化分類的承運商受益。
北美市場仍然成熟,這主要得益於美國聯邦機動車輛運輸安全管理局 (FMCSA) 對 350 萬輛卡車強制實施的電子駕駛員日誌制度。亞馬遜對賣家的要求也正逐步影響區域第三方物流 (3PL) 服務商。加州和德克薩斯州的高貨物竊盜率促使保險公司提高了追蹤要求,從而推高了基礎物流需求。加拿大的遠端採礦業者正在採用衛星和物聯網技術來彌補行動電話網路訊號盲區,這為供應商擴大了潛在收入。
在歐洲,如何在《一般資料保護規則》(GDPR) 嚴格的同意要求與汽車製造業對工業4.0的投資之間取得平衡至關重要。大眾和寶馬正在利用RFID技術同步準時交付(JIS),從而降低合規方面的複雜性。東部走廊的竊盜風險推動了隱蔽式信標的部署,而ESG報告則促進了運轉率運行時間儀錶板的普及。這些趨勢共同推動了歐洲資產追蹤市場穩定但緩慢的成長。
其他好處:
- Excel格式的市場預測(ME)表
- 3個月的分析師支持
目錄
第1章:引言
- 研究假設和市場定義
- 調查範圍
第2章:調查方法
第3章執行摘要
第4章 市場狀況
- 市場概覽
- 市場促進因素
- 第三方物流和電子商務物流的擴張需要即時可視性。
- 降低物聯網感測器和GPS追蹤器的成本
- 貨物竊盜造成的損失日益增加,促使保險公司採用追蹤設備。
- AI賦能的多感測器融合技術提高了室內外測量精度。
- 衛星物聯網衛星群能夠實現偏遠地區資產的可視化。
- 基於ESG的資產利用KPI能夠提升生命週期透明度。
- 市場限制因素
- 中小企業硬體和系統整合的初始成本較高。
- 全球導航衛星系統干擾和欺騙事件會增加責任風險。
- 資料隱私法限制了位置資料的貨幣化利用。
- LPWAN 和衛星通訊頻寬的頻帶擁塞
- 產業價值鏈分析
- 監理情勢
- 技術展望
- 波特五力分析
- 宏觀經濟因素對市場的影響
第5章 市場規模與成長預測
- 按組件
- 硬體
- 軟體
- 按部署模式
- 雲
- 現場
- 依技術類型
- RFID
- GPS/GNSS
- Bluetooth Low Energy
- Wi-Fi
- NB-IoT 和 LTE-M
- 超寬頻
- 衛星和混合低功耗廣域網
- 按最終用戶行業分類
- 運輸/物流
- 航空
- 衛生保健
- 製造業
- 食品/飲料
- 其他終端使用者產業(例如建築業)
- 按資產類型分類
- 車隊車輛
- 無動力拖車和貨櫃
- 重型機械和設備
- 可退回的運輸材料
- 高價值攜帶式資產
- 牲畜和農業資產
- 按地區
- 北美洲
- 美國
- 加拿大
- 墨西哥
- 南美洲
- 巴西
- 阿根廷
- 其他南美國家
- 歐洲
- 德國
- 英國
- 法國
- 義大利
- 西班牙
- 俄羅斯
- 其他歐洲國家
- 亞太地區
- 中國
- 印度
- 日本
- 韓國
- 東南亞
- 澳洲和紐西蘭
- 其他亞太國家
- 中東
- 沙烏地阿拉伯
- 阿拉伯聯合大公國
- 土耳其
- 其他中東國家
- 非洲
- 南非
- 奈及利亞
- 其他非洲國家
- 北美洲
第6章 競爭情勢
- 市場集中度
- 策略趨勢
- 市佔率分析
- 公司簡介
- Verizon Communications Inc.
- Zebra Technologies Corporation
- AT&T Inc.
- Trimble Inc.
- Samsara Inc.
- ORBCOMM Inc.
- CalAmp Corp.
- Fleet Complete
- Spireon Inc.
- OnAsset Intelligence Inc.
- Asset Panda LLC
- Ubisense Ltd.
- Trackunit A/S
- Semtech Corporation
- Link Labs Inc.
- Tive Inc.
- Geoforce Inc.
- Tenna LLC
- Queclink Wireless Solutions Co. Ltd.
- Sensitech Inc.
- Project44 Inc.
- Qualcomm Technologies Inc.
- IBM Corporation
- Oracle Corporation
第7章 市場機會與未來展望
According to Mordor Intelligence, the asset tracking market size reached USD 32.45 billion in 2026 and is projected to climb to USD 54.29 billion by 2031, reflecting a CAGR of 10.84% over the forecast window.
This report is Segmented by Component (Hardware, and Software), Deployment Model (Cloud, and On-Premise), Technology Type (RFID, GPS/GNSS, and More), End-User Industry (Transportation and Logistics, Aviation, Healthcare, and More), Asset Type (Fleet Vehicles, Non-Powered Trailers and Containers, Heavy Equipment and Machinery, and More), and Geography. The Market Forecasts are Provided in Terms of Value (USD).
Global Asset Tracking Market Trends and Insights
Expansion of 3PL and E-commerce Logistics Requiring Real-Time Visibility
Third-party logistics providers now manage surging parcel volumes for marketplaces that publish live shipment maps to end customers. Amazon requires every handoff to include GPS coordinates, forcing regional carriers to retrofit fleets or risk contract loss. Walmart imposes pallet-level RFID scans within 15 minutes of dock departure, with chargebacks topping USD 50,000 per quarter for non-compliant suppliers. Southeast Asian customs pilots blockchain-anchored GPS trails to auto-populate duty declarations, shortening clearance times. Continuous, cloud-based dashboards cut invoice disputes by 30% as operators replace quarterly reconciliations with perpetual audits. These visibility mandates embed the asset tracking market in the core service promise of online retail, ensuring sustained spending even when freight rates soften.
Falling IoT Sensor and GPS-Tracker Costs
Cellular IoT modules incorporating GPS and temperature sensors fell to USD 4.80 in 2025 as semiconductor migrations to 6-nanometer nodes halved silicon area. Bluetooth Low Energy beacons retail below USD 3, enabling crate-level tagging that reduces food waste 18% in grocery pilots. Passive UHF RFID tags now cost USD 0.06, letting apparel firms track every garment. Vodafone bundles NB-IoT devices at zero upfront cost under five-year data contracts that convert capital expenditure into predictable operating fees. Lower hardware barriers widen the addressable base of small carriers, expanding the overall asset tracking market.
High Upfront Hardware and Integration Costs for SMEs
Fleets under 50 vehicles often face installation bills exceeding USD 50,000 for trackers, wiring, and systems integration. Labor averages USD 300 per vehicle, while API work with ERP platforms consumes 200-plus consulting hours at USD 150 each. Monthly SaaS fees add USD 25-40 per asset. With freight margins at 6-9% in Latin America and Southeast Asia, payback stretches beyond two years, slowing penetration among small operators.
Other drivers and restraints analyzed in the detailed report include:
- Escalating Cargo-Theft Losses Driving Insurer-Mandated Tracking
- AI-Powered Multi-Sensor Fusion Improves Accuracy
- GNSS Jamming and Spoofing Incidents Raise Liability Risk
For complete list of drivers and restraints, kindly check the Table Of Contents.
Segment Analysis
Hardware delivered 58.14% of 2025 revenue, giving it the largest asset tracking market share, yet software revenue is expanding at an 11.20% CAGR as vendors pivot toward subscriptions that bundle analytics, application-programming-interface connectors, and regulatory reporting tools. This shift improves gross margins because a single software license can be upsold across new asset classes without further hardware costs, a dynamic that will increase the overall asset tracking market size through 2031. Price erosion in Bluetooth beacons forces hardware suppliers to differentiate through over-the-air firmware and edge analytics that reduce cellular data usage by up to 30%, while fleet managers gravitate to dashboards that auto-rank assets by utilization or maintenance risk. Predictive-maintenance algorithms already cut unplanned downtime 28% in construction fleets, creating a soft cost saving that outweighs initial license fees and strengthens renewal rates.
Recurring revenue also changes vendor-customer power dynamics. Because clients can cancel month-to-month contracts, platforms now focus on user-experience metrics such as five-minute onboarding and single-pane management of mixed fleets. Automated compliance modules, including digital proof-of-delivery and electronic driver logs, further embed the software layer in daily operations. Independent software vendors integrate electronic signature capture to streamline FDA 21 CFR Part 11 documentation, a feature hardware-only competitors cannot replicate. These sticky workflows make software the strategic growth engine of the asset tracking market, while commoditized devices become interchangeable endpoints.
Cloud services held 63.15% of 2025 revenue and are expanding at an 11.38% CAGR, reflecting the preference of mid-market freight forwarders to avoid data-center capital expenditure. Consumption-based fees align outlays with shipment volumes, so customers who add seasonal trailers during holiday peaks simply pay for more device credits instead of buying new licenses outright. Because weekly feature releases flow instantly through multitenant architectures, users gain geofence templates, real-time anomaly alerts, and carrier-API integrations without planned downtime. Consequently, the cloud segment commands the largest slice of the asset tracking market size and shows no sign of saturation.
On-premise solutions persist in defense, aviation maintenance, and pharmaceutical cold chains, where data sovereignty and validated computing environments remain non-negotiable. Yet even regulated entities adopt hybrid topologies that store sensitive payloads locally while forwarding non-critical telemetry to public clouds for analytics. Such models erode pure on-premise spending by shifting report generation and machine-learning workloads off-site, reinforcing the cloud's share gains. Rising electricity and cooling costs in Europe and parts of North America further tip total-cost-of-ownership analyses in favor of cloud subscriptions. Over the forecast period, cloud's architectural agility will keep it the principal growth lever in the asset tracking market.
Complete Report Scope:
- By Component
- Hardware
- Software
- By Deployment Model
- Cloud
- On-Premise
- By Technology Type
- RFID
- GPS / GNSS
- Bluetooth Low Energy
- Wi-Fi
- NB-IoT and LTE-M
- Ultra-Wideband
- Satellite and Hybrid LPWAN
- By End-user Industry
- Transportation and Logistics
- Aviation
- Healthcare
- Manufacturing
- Food and Beverage
- Other End-user Industry (Construction etc.)
- By Asset Type
- Fleet Vehicles
- Non-powered Trailers and Containers
- Heavy Equipment and Machinery
- Returnable Transport Items
- High-value Portable Assets
- Livestock and Agriculture Assets
- By Geography
- North America
- United States
- Canada
- Mexico
- South America
- Brazil
- Argentina
- Rest of South America
- Europe
- Germany
- United Kingdom
- France
- Italy
- Spain
- Russia
- Rest of Europe
- Asia Pacific
- China
- India
- Japan
- South Korea
- Southeast Asia
- Australia and New Zealand
- Rest of Asia Pacific
- Middle East
- Saudi Arabia
- United Arab Emirates
- Turkey
- Rest of Middle East
- Africa
- South Africa
- Nigeria
- Rest of Africa
- North America
Geography Analysis
Asia Pacific accounted for 40.28% revenue in 2025, and its asset tracking market size is projected to expand at an 11.56% CAGR through 2031. China's Belt and Road corridors require GPS-stamped documentation to speed customs clearances, and India's e-way bill system mandates real-time vehicle tracking for interstate loads exceeding 50 kilometers. Japan's smart-logistics projects integrate autonomous trucks with IoT-tagged cargo, demonstrating government support for visibility tech. Express parcel deliveries in China reached 135 billion in 2025, rewarding carriers that automate sorting with RFID scanners.
North America remains mature, anchored by Federal Motor Carrier Safety Administration electronic logging mandates for 3.5 million trucks. Amazon's seller requirements ripple across regional 3PLs. Cargo-theft hot spots in California and Texas trigger insurer tracking mandates that shore up baseline demand. Canada's remote mining operators adopt satellite-IoT links to bridge cellular gaps, broadening supplier addressable revenue.
Europe balances stringent General Data Protection Regulation consent rules with Industry 4.0 investment in automotive manufacturing. Volkswagen and BMW synchronize just-in-sequence deliveries via RFID, offsetting compliance complexity. Eastern corridor theft risks spur rollout of covert beacons, while ESG reporting drives adoption of utilization dashboards. Combined, these dynamics sustain moderate but steady asset tracking market growth across the continent.
- Verizon Communications Inc.
- Zebra Technologies Corporation
- AT&T Inc.
- Trimble Inc.
- Samsara Inc.
- ORBCOMM Inc.
- CalAmp Corp.
- Fleet Complete
- Spireon Inc.
- OnAsset Intelligence Inc.
- Asset Panda LLC
- Ubisense Ltd.
- Trackunit A/S
- Semtech Corporation
- Link Labs Inc.
- Tive Inc.
- Geoforce Inc.
- Tenna LLC
- Queclink Wireless Solutions Co. Ltd.
- Sensitech Inc.
- Project44 Inc.
- Qualcomm Technologies Inc.
- IBM Corporation
- Oracle Corporation
Additional Benefits:
- The market estimate (ME) sheet in Excel format
- 3 months of analyst support
TABLE OF CONTENTS
1 INTRODUCTION
- 1.1 Study Assumptions and Market Definition
- 1.2 Scope of the Study
2 RESEARCH METHODOLOGY
3 EXECUTIVE SUMMARY
4 MARKET LANDSCAPE
- 4.1 Market Overview
- 4.2 Market Drivers
- 4.2.1 Expansion of 3PL and e-commerce logistics requiring real-time visibility
- 4.2.2 Falling IoT sensor and GPS-tracker costs
- 4.2.3 Escalating cargo-theft losses driving insurer-mandated tracking
- 4.2.4 AI-powered multi-sensor fusion boosts indoor and outdoor accuracy
- 4.2.5 Satellite-IoT constellations unlock remote-area asset visibility
- 4.2.6 ESG-driven asset-utilization KPIs push lifecycle transparency
- 4.3 Market Restraints
- 4.3.1 High upfront hardware and integration costs for SMEs
- 4.3.2 GNSS jamming and spoofing incidents raise liability risk
- 4.3.3 Data-privacy laws limit location-data monetization
- 4.3.4 Spectrum congestion for LPWAN and satellite bands
- 4.4 Industry Value-Chain Analysis
- 4.5 Regulatory Landscape
- 4.6 Technological Outlook
- 4.7 Porter's Five Forces Analysis
- 4.7.1 Bargaining Power of Suppliers
- 4.7.2 Bargaining Power of Buyers
- 4.7.3 Threat of New Entrants
- 4.7.4 Threat of Substitutes
- 4.7.5 Intensity of Competitive Rivalry
- 4.8 Impact of Macroeconomic Factors on the Market
5 MARKET SIZE AND GROWTH FORECASTS (VALUE)
- 5.1 By Component
- 5.1.1 Hardware
- 5.1.2 Software
- 5.2 By Deployment Model
- 5.2.1 Cloud
- 5.2.2 On-Premise
- 5.3 By Technology Type
- 5.3.1 RFID
- 5.3.2 GPS / GNSS
- 5.3.3 Bluetooth Low Energy
- 5.3.4 Wi-Fi
- 5.3.5 NB-IoT and LTE-M
- 5.3.6 Ultra-Wideband
- 5.3.7 Satellite and Hybrid LPWAN
- 5.4 By End-user Industry
- 5.4.1 Transportation and Logistics
- 5.4.2 Aviation
- 5.4.3 Healthcare
- 5.4.4 Manufacturing
- 5.4.5 Food and Beverage
- 5.4.6 Other End-user Industry (Construction etc.)
- 5.5 By Asset Type
- 5.5.1 Fleet Vehicles
- 5.5.2 Non-powered Trailers and Containers
- 5.5.3 Heavy Equipment and Machinery
- 5.5.4 Returnable Transport Items
- 5.5.5 High-value Portable Assets
- 5.5.6 Livestock and Agriculture Assets
- 5.6 By Geography
- 5.6.1 North America
- 5.6.1.1 United States
- 5.6.1.2 Canada
- 5.6.1.3 Mexico
- 5.6.2 South America
- 5.6.2.1 Brazil
- 5.6.2.2 Argentina
- 5.6.2.3 Rest of South America
- 5.6.3 Europe
- 5.6.3.1 Germany
- 5.6.3.2 United Kingdom
- 5.6.3.3 France
- 5.6.3.4 Italy
- 5.6.3.5 Spain
- 5.6.3.6 Russia
- 5.6.3.7 Rest of Europe
- 5.6.4 Asia Pacific
- 5.6.4.1 China
- 5.6.4.2 India
- 5.6.4.3 Japan
- 5.6.4.4 South Korea
- 5.6.4.5 Southeast Asia
- 5.6.4.6 Australia and New Zealand
- 5.6.4.7 Rest of Asia Pacific
- 5.6.5 Middle East
- 5.6.5.1 Saudi Arabia
- 5.6.5.2 United Arab Emirates
- 5.6.5.3 Turkey
- 5.6.5.4 Rest of Middle East
- 5.6.6 Africa
- 5.6.6.1 South Africa
- 5.6.6.2 Nigeria
- 5.6.6.3 Rest of Africa
- 5.6.1 North America
6 COMPETITIVE LANDSCAPE
- 6.1 Market Concentration
- 6.2 Strategic Moves
- 6.3 Market Share Analysis
- 6.4 Company Profiles (includes Global Level Overview, Market Level Overview, Core Segments, Financials as Available, Strategic Information, Market Rank/Share for Key Companies, Products and Services, and Recent Developments)
- 6.4.1 Verizon Communications Inc.
- 6.4.2 Zebra Technologies Corporation
- 6.4.3 AT&T Inc.
- 6.4.4 Trimble Inc.
- 6.4.5 Samsara Inc.
- 6.4.6 ORBCOMM Inc.
- 6.4.7 CalAmp Corp.
- 6.4.8 Fleet Complete
- 6.4.9 Spireon Inc.
- 6.4.10 OnAsset Intelligence Inc.
- 6.4.11 Asset Panda LLC
- 6.4.12 Ubisense Ltd.
- 6.4.13 Trackunit A/S
- 6.4.14 Semtech Corporation
- 6.4.15 Link Labs Inc.
- 6.4.16 Tive Inc.
- 6.4.17 Geoforce Inc.
- 6.4.18 Tenna LLC
- 6.4.19 Queclink Wireless Solutions Co. Ltd.
- 6.4.20 Sensitech Inc.
- 6.4.21 Project44 Inc.
- 6.4.22 Qualcomm Technologies Inc.
- 6.4.23 IBM Corporation
- 6.4.24 Oracle Corporation
7 MARKET OPPORTUNITIES AND FUTURE OUTLOOK
- 7.1 White-space and Unmet-need Assessment

 2026年全球資產追蹤人工智慧(AI)市場報告
 2026-2030年全球資產追蹤軟體市場
 資產追蹤市場-2026-2032年全球市場預測
 全球資產追蹤市場(2026-2030 年):按基礎設施(平台、軟體和服務)、連接性、移動性(固定、可攜式和行動)、定位方法(GPS、信標、RFID 及其他)、解決方案類型、底層技術和產業分類。基於物聯網的資產追蹤與監控市場:2026-2032年全球市場預測2026年全球珠寶櫃系統市場報告
 資產追蹤市場規模、佔有率、趨勢和預測:按組件、部署類型、組織規模、最終用戶行業和地區分類,2026-2034 年
 資產追蹤:物聯網技術與市場資產追蹤:物聯網技術與市場-市場數據概覽(2026 年第一季)
 2026年T型玻璃纖維供不應求:人工智慧機架用玻璃纖維的發展趨勢