


 |
市場調查報告書
商品編碼
2123316
機器人領域的人工智慧:市場佔有率分析、產業趨勢與統計數據及成長預測(2026-2031)Artificial Intelligence In Robotics - Market Share Analysis, Industry Trends & Statistics, Growth Forecasts (2026 - 2031) |
||||||

※ 本網頁內容可能與最新版本有所差異。詳細情況請與我們聯繫。
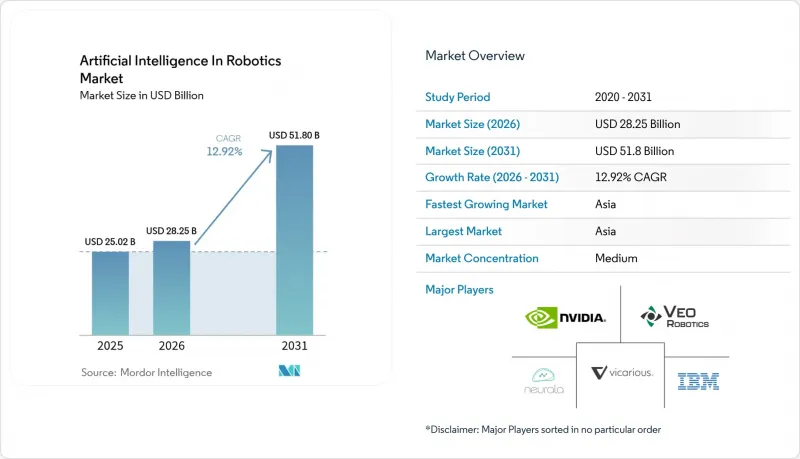
據 Mordor Intelligence 稱,2025 年機器人人工智慧 (AI) 市場價值為 250.2 億美元,預計從 2026 年的 282.5 億美元成長到 2031 年的 518 億美元,預測期(2026-2031 年)的複合年成長率為 12.92%。
本報告按組件(硬體等)、機器人類型(工業機器人、服務機器人等)、應用(製造和組裝、物流和倉儲、醫療和外科手術等)、最終用戶行業(汽車、電子和半導體等)以及地區進行分類。
全球機器人人工智慧(AI)市場趨勢及洞察。
邊緣人工智慧晶片的整合使機器人能夠進行即時決策。
邊緣AI處理器將決策延遲從秒級縮短至毫秒級,使自主移動機器人(AMR)能夠在動態生產車間自主導航,而無需依賴雲端。研華科技在2025年的產品展示中重點介紹了透過將NVIDIA Jetson Thor模組整合到AMR集群中,響應時間縮短了75%。深圳和樹原的電子製造商報告稱,透過在本地處理視覺和運動數據,提高了首批良率並縮短了週期時間,從而獲得了顯著的效益。延遲的降低也縮短了預測性維護的回饋週期,減少了精密組裝線上的非計劃性停機時間。隨著針對邊緣最佳化的AI模型日趨成熟,處理器成本不斷下降,這促使中型供應商維修現有機器人而非購買新設備。反過來,這又推動了各種工廠環境中AI技術的應用,並對機器人AI市場產生了正面影響。
人口快速老化正在加速對護理機器人的需求。
到2025年,日本65歲及以上居民的比例將超過29%,這將進一步加劇預計37.7萬名護理人員的缺口。松下、軟銀以及日本政府支持的新創公司正在部署移動輔助機器人和社交互動機器人,這些機器人利用深度神經網路來檢測跌倒、提醒服藥時間並透過自然對話進行互動。臨床試驗表明,機器人可以透過承擔重複性的搬運和監測任務來提高醫護人員的工作效率,使護理人員能夠更專注於直接的病患照護。韓國也面臨類似的人口結構挑戰,並透過其「機器人產業願景2030」計畫投資人工智慧護理機器人,該計畫為醫院部署和家庭護理試點計畫提供津貼。這兩個地區在人工智慧護理機器人領域的早期成功將為歐洲老齡化人口的醫療保健機構樹立標桿,並擴大未來對人工智慧機器人技術的潛在需求。
缺乏針對特定機器人感知任務的高品質領域數據。
《機器人與人工智慧前沿》指出,不一致和不完整的資料集會降低人機協作機器人之間的可靠性,尤其是在機器人必須識別特殊物體的情況下。例如,農業收割機難以判斷不同作物品種的成熟度,這限制了其在試點農場以外的商業部署。資料匱乏也會阻礙安全檢驗,迫使供應商過度設計其感知系統,進而延長產品上市時間。專有資料集賦予大型成熟企業競爭優勢,使小規模創新者難以趕上效能基準。雖然合成資料產生和遷移學習正在緩解這一障礙,但資料稀缺仍然是人工智慧在機器人領域市場整體擴張的瓶頸。
細分市場分析
預計到2025年,硬體將佔市場佔有率的61.20%,這主要體現在賦予機器人物理形態的感測器、執行器、驅動裝置和結構框架等方面。整合力矩感測器的資本密集型工業機械手臂仍然是焊接、噴塗和精密物料輸送的必備組件。供應商目前提供的模組化設計允許製造商在不改造整個系統的情況下更換夾爪、攝影機或AI邊緣模組,從而降低整體擁有成本(TCO)並延長設備使用壽命。硬體發展藍圖強調節能伺服控制器和輕量化複合材料關節,以實現高負載容量重量比,這對於在狹窄工廠通道中穿梭的移動機器人至關重要。機器學習和深度學習軟體正以23.10%的複合年成長率快速成長,並擴大以預訓練感知和運動規劃庫的形式捆綁銷售。這些技術堆疊無需外部編程即可實現缺陷檢測、預測性維護和自適應抓取,從而進一步提升現有機器的價值。早期用戶報告稱,僅軟體升級就能將整體設備效率 (OEE) 提升兩位數,這解釋了為什麼軟體的成長速度超過了硬體投資,儘管其基準相對較小。隨著客戶對生命週期支援的需求增加,涵蓋整合、遠端監控和持續模型重學習的服務正成為供應商日益成長的經常性收入來源。這種轉變凸顯出,在市場上,競爭對手之間的差異化因素不再是機械面,而是智慧。
到2025年,工業機器人將佔據67.30%的市場佔有率,這主要得益於汽車和電子產品生產設施中部署的多關節臂。目前全球工廠部署超過428萬台工業機器人,年增率達10%,市場需求穩固。人工智慧驅動的升級改造提高了資產運轉率,使這些系統能夠處理各種形狀的零件,而無需停機重新學習。協作機器人雖然出貨量仍佔少數,但隨著靈活自動化在多品種、小批量生產環境中變得至關重要,其市場正經歷顯著成長。醫療保健機器人是成長最快的類別,預計2026年至2031年的複合年成長率將達到24.85%。融合電腦視覺和力回饋技術的輔助手術系統正在幫助臨床醫生進行微創手術,從而減少術後併發症並縮短住院時間。醫院物流機器人利用整合人工智慧決策引擎的同步定位與地圖建構(SLAM)技術,自主穿梭於擁擠的走廊,並運輸床單和藥品。消費者對人工智慧機器人的接受度也不斷提高,家用護理機器人的普及便是明證,這些機器人能夠幫助老年人更好地生活。這些趨勢正透過拓展收入來源和緩解目前以汽車產業為中心的周期性需求,對人工智慧機器人市場產生正面影響。
區域分析
亞太地區在中國、日本和韓國大規模自動化計畫的推動下,預計到2025年將佔全球收入的46.55%。光是中國在2023年就部署了276,288台工業機器人,佔全球出貨量的51%。這部分歸功於地方政府提供稅收優惠和低利率貸款,以增強製造業的競爭力。韓國電子公司正在將邊緣人工智慧視覺技術應用於拾取放置工藝,以控制以微米為單位的晶圓級公差。同時,日本汽車製造商正在部署人工智慧協作機器人,用於需要類似人類靈巧度的最終修整任務。該地區預計17.45%的複合年成長率不僅反映了其製造業的主導地位,也反映了醫療和服務機器人領域快速湧現的先導計畫。北美排名第二,其中美國是核心,其人工智慧軟體的專業知識正在推動新創企業的蓬勃發展和創業融資。大型物流公司正在將人工智慧驅動的移動機器人引入現有的輸送機網路中,以實現兩小時內送達的目標。汽車製造商正在加速採用人工智慧技術,改造工廠以生產電池式電動車(BEV),並利用人工智慧監控新開發的輕質材料的焊接品質。在加拿大採礦業,自動駕駛卡車正在測試中,這些卡車利用人工智慧感知技術,即使在GPS訊號較弱的露天礦環境中也能導航,從而將人工智慧在機器人市場的滲透範圍擴展到工廠車間之外。同樣,墨西哥的工業區也在利用人工智慧技術維修設備,以符合美墨加協定(USMCA)的在地採購規定,並保持競爭力。在歐洲,人們關注的是合乎倫理、安全可靠的人工智慧,這正在影響技術發展和法規結構。德國在政府對中型企業自動化專案補貼的支持下,機器人密度領先,2023年新增安裝量達28,355台。歐盟「地平線歐洲」津貼正在農業技術、醫療保健和綠色製造等領域促進機器人產業的產學研叢集發展。然而,跨境部署,特別是協作機器人(cobot)的部署,受到CE認證和人工智慧責任認定標準解讀差異的阻礙。由於勞動力短缺推動了工廠投資的成長,中東歐地區仍具有巨大的成長潛力。南美、中東和非洲等市場規模相對小規模,仍在發展中,但它們正受益於承包機器人即服務(RaaS)契約,這些契約降低了初始投資門檻,從而促進了人工智慧在機器人領域的全球應用。
其他好處:
- Excel格式的市場預測(ME)表
- 3個月的分析師支持
目錄
第1章:引言
- 研究假設和市場定義
- 調查範圍
第2章:調查方法
第3章執行摘要
第4章 市場狀況
- 市場概覽
- 市場促進因素
- 將邊緣人工智慧晶片整合到亞洲電子製造業中,使機器人能夠進行即時決策。
- 人口快速老化正在加速日本和韓國對護理機器人的需求。
- 歐盟「地平線歐洲」計畫的資助正在提高人工智慧和協作機器人研究聯盟的效率。
- 北美電子商務履約的蓬勃發展正在推動倉庫利用人工智慧實現自動化。
- 德國汽車組裝線上自主移動機器人數量激增。
- 視覺感測器成本的降低,導致全球中小企業廣泛採用人工智慧改造套件來升級傳統機器人。
- 市場限制因素
- 缺乏針對特定機器人感知任務的高品質領域數據。
- 安全標準的差異阻礙了協作機器人的跨國部署。
- 對於利潤率較低的食品加工企業而言,實施人工智慧處理器模組的初始成本相對較高。
- 網路實體安全問題限制了雲端連線服務機器人在醫院的應用。
- 市場促進因素
- 價值供應鏈分析
- 監管和標準展望
- 技術展望
- 波特五力模型
- 投資分析
第5章 市場規模與成長預測
- 按組件
- 硬體
- 感應器
- 執行器
- 電力系統
- 控制系統
- 軟體
- 機器學習和深度學習
- 電腦視覺
- 自然語言處理
- 情境感知/決策
- 服務
- 整合與部署
- 支援與維護
- 硬體
- 按機器人類型
- 工業機器人
- 關節機器人
- SCARA機器人
- 笛卡兒坐標機器人
- 協作機器人(cobots)
- 服務機器人
- 商用服務機器人
- 物流機器人
- 醫療和保健機器人
- 國防與安全機器人
- 田間機器人(農業和採礦)
- 個人和家用機器人
- 家用機器人
- 娛樂和陪伴機器人
- 商用服務機器人
- 工業機器人
- 透過使用
- 製造和組裝
- 物流/倉儲
- 醫療和外科手術
- 零售與電子商務
- 食品/飲料加工
- 檢查和維護
- 其他
- 按最終用戶行業分類
- 車
- 電子和半導體
- 零售與電子商務
- 衛生保健
- 食品/飲料
- 航太/國防
- 其他
- 按地區
- 北美洲
- 美國
- 加拿大
- 墨西哥
- 南美洲
- 巴西
- 阿根廷
- 其他南美國家
- 歐洲
- 德國
- 英國
- 法國
- 義大利
- 西班牙
- 北歐的
- 其他歐洲國家
- 中東
- 阿拉伯聯合大公國
- 沙烏地阿拉伯
- 土耳其
- 其他中東國家
- 非洲
- 南非
- 奈及利亞
- 埃及
- 其他非洲國家
- 亞太地區
- 中國
- 日本
- 韓國
- 印度
- ASEAN
- 其他亞太國家
- 北美洲
第6章 競爭情勢
- 市場集中度
- 策略趨勢
- 市佔率分析
- 公司簡介
- NVIDIA Corporation
- IBM Corporation
- Microsoft Corporation
- ABB Ltd.
- FANUC Corporation
- KUKA AG
- Yaskawa Electric Corp.
- Universal Robots A/S
- Hanson Robotics Ltd.
- Boston Dynamics, Inc.
- Brain Corporation
- Vicarious AI
- Neurala, Inc.
- Kindred AI
- Preferred Networks, Inc.
- Veo Robotics, Inc.
- Fetch Robotics, Inc.
- Blue River Technology(John Deere)
- UiPath Inc.
- SoftBank Robotics Group Corp.
第7章 市場機會與未來展望
According to Mordor Intelligence, the artificial intelligence in robotics market size was valued at USD 25.02 billion in 2025 and estimated to grow from USD 28.25 billion in 2026 to reach USD 51.8 billion by 2031, at a CAGR of 12.92% during the forecast period (2026-2031).
This report is Segmented by Component (Hardware and More), Robot Type (Industrial Robots, Service Robots and More), Application (Manufacturing and Assembly, Logistics and Warehousing, Healthcare and Surgery and More), End-User Industry (Automotive, Electronics, and Semiconductors, and More), and Geography.
Global Artificial Intelligence In Robotics Market Trends and Insights
Integration of Edge-AI Chips Enabling Real-Time Robot Decision-Making
Edge-AI processors cut decision-making latency from seconds to milliseconds, enabling autonomous mobile robots (AMR) to navigate dynamic production floors without cloud dependence. Advantech's 2025 showcase highlighted 75% faster response times after integrating NVIDIA Jetson Thor modules into AMR fleets. Electronics manufacturers in Shenzhen and Suwon report measurable gains in first-pass yield and takt-time reduction when vision and motion data are processed locally. Lower latency also tightens feedback loops for predictive maintenance, decreasing unscheduled downtime in precision assembly lines. As edge-optimized AI models mature, processor costs are falling, encouraging mid-tier suppliers to retrofit existing robots instead of purchasing new units. The driver, therefore, widens adoption across diverse factory footprints and contributes positively to the AI in robotics market .
Rapid Aging Population Accelerating Demand for Elder-Care Robots
Japan's share of residents aged 65 plus exceeded 29% in 2025, amplifying a projected shortfall of 377,000 caregivers.Panasonic, SoftBank, and startups backed by the Japanese government are rolling out mobility and social-companion robots that use deep neural networks to detect falls, remind medication schedules, and interact through natural speech. Clinical pilots show robots increase staff efficiency by reallocating repetitive lifting or monitoring tasks, letting nurses focus on direct patient engagement. South Korea faces similar demographic headwinds and is investing in AI robotic caregivers through its "Robot Industry Vision 2030" plan, which subsidizes hospital deployments and homecare trials. Success in these two cultural early adopters sets benchmarks for healthcare providers in Europe as their populations age, broadening future addressable demand for AI in the robotics market.
Scarcity of High-Quality Domain Data for Niche Robot-Perception Tasks
Frontiers in Robotics and AI highlights that inconsistent, incomplete datasets reduce the reliability of human-robot collaboration, especially where robots must recognize uncommon objects. For example, agricultural harvesters struggle to gauge ripeness across diverse crop varieties, limiting commercial deployment beyond pilot farms. Data gaps also impede safety validation, forcing vendors to over-engineer perception stacks and prolong time-to-market. Proprietary datasets give large incumbents a moat, making it harder for smaller innovators to match performance benchmarks. While synthetic data generation and transfer learning mitigate the barrier, the shortage remains a drag on the overall expansion of AI in the robotics market.
Other drivers and restraints analyzed in the detailed report include:
- EU Horizon Europe Funding Streamlining Collaborative AI-Robot Research
- E-Commerce Fulfilment Boom Driving AI-Enabled Warehouse Automation
- Fragmented Safety Standards Hindering Cross-Border Cobot Deployment
For complete list of drivers and restraints, kindly check the Table Of Contents.
Segment Analysis
Hardware accounted for 61.20% of the AI in robotics market share in 2025, reflecting the sensors, actuators, drives, and structural frames that give robots their physical presence. Capital-intensive industrial arms with integrated force-torque sensors remain indispensable for welding, painting, and precision material handling. Vendors are now shipping modular designs that let manufacturers swap grippers, cameras, or AI edge modules without full system overhauls, lowering total cost of ownership and prolonging equipment life cycles. Hardware roadmaps emphasize power-efficient servo controllers and lightweight composite joints, enabling higher payload-to-weight ratios crucial for mobile robots in tight factory aisles. Machine Learning & Deep Learning software is expanding at a 23.10% CAGR and is increasingly bundled as pre-trained perception and motion-planning libraries. These stacks extract more value from existing machines by enabling defect detection, predictive maintenance, and adaptive grasping without external programming. Early adopters report that software upgrades alone can raise overall equipment effectiveness by double digits, illustrating why software is outpacing physical spend despite its smaller baseline. Services covering integration, remote monitoring, and continuous model retraining form a rising annuity stream for vendors as customers seek lifecycle support. The shift underlines how intelligence rather than mechanics now differentiates competitors in the AI in robotics market.
Industrial robots commanded 67.30% of the AI in robotics market size in 2025, led by articulated arms deployed in automotive and electronics production. Their installed base surpassed 4.28 million units in factories worldwide, a 10% annual gain that highlights entrenched demand. AI upgrades are letting these systems handle variable part geometries without downtime for re-teaching, boosting asset utilization. Cobots, still a minority of shipments, enjoy outsized growth as flexible automation becomes essential for high-mix, low-volume environments. Medical & healthcare robots represent the fastest-growing class at a 24.85% CAGR for 2026-2031. Surgical systems incorporating computer vision and force feedback assist clinicians in minimally invasive procedures, trimming post-operative complications and length of stay. Hospital logistics robots autonomously ferry linens and medications through crowded corridors using simultaneous localization and mapping (SLAM) fused with AI decision engines. Consumer acceptance is widening, evidenced by homecare robots that support daily living tasks for seniors. Altogether, these trends diversify revenue pools and mitigate cyclicality inherent in automotive-centric demand, benefiting the AI in robotics market.
Complete Report Scope:
- By Component
- Hardware
- Sensors
- Actuators
- Power Systems
- Control Systems
- Software
- Machine Learning and Deep Learning
- Computer Vision
- Natural Language Processing
- Context Awareness / Decision-Making
- Services
- Integration and Deployment
- Support and Maintenance
- Hardware
- By Robot Type
- Industrial Robots
- Articulated Robots
- SCARA Robots
- Cartesian Robots
- Collaborative Robots (Cobots)
- Service Robots
- Professional Service Robots
- Logistics Robots
- Medical and Healthcare Robots
- Defense and Security Robots
- Field Robots (Agriculture and Mining)
- Personal and Domestic Robots
- Household Robots
- Entertainment and Companion Robots
- Professional Service Robots
- Industrial Robots
- By Application
- Manufacturing and Assembly
- Logistics and Warehousing
- Healthcare and Surgery
- Retail and E-Commerce Operations
- Food and Beverage Processing
- Inspection and Maintenance
- Other Applications
- By End-user Industry
- Automotive
- Electronics and Semiconductors
- Retail and E-Commerce
- Healthcare
- Food and Beverage
- Aerospace and Defense
- Others
- By Geography
- North America
- United States
- Canada
- Mexico
- South America
- Brazil
- Argentina
- Rest of South America
- Europe
- Germany
- United Kingdom
- France
- Italy
- Spain
- Nordics
- Rest of Europe
- Middle East
- United Arab Emirates
- Saudi Arabia
- Turkey
- Rest of Middle East
- Africa
- South Africa
- Nigeria
- Egypt
- Rest of Africa
- Asia Pacific
- China
- Japan
- South Korea
- India
- ASEAN
- Rest of Asia Pacific
- North America
Geography Analysis
Asia Pacific generated 46.55% of global revenue in 2025 driven by extensive automation programs in China, Japan, and South Korea. China alone installed 276,288 industrial robots in 2023, equal to 51% of world shipments, as local authorities provide tax incentives and low-interest loans to upgrade manufacturing competitiveness ifr.org. Korean electronics firms add edge-AI vision to pick-and-place cells to manage wafer-level tolerances measured in microns, while Japanese automakers deploy AI cobots for final trim operations that require human-like dexterity. The region's projected 17.45% CAGR reflects not only manufacturing dominance but also fast-emerging healthcare and service robotics pilots. North America ranks second, anchored by the United States where AI software expertise seeds robust startup formation and venture funding. Logistics giants retrofit existing conveyor grids with AI mobile robots to meet two-hour delivery windows. Automakers accelerate adoption as factories retool for battery electric vehicles, using AI to monitor weld quality on new lightweight materials. Canada's mining sector pilots autonomous haulage trucks that leverage AI perception stacks to navigate open-pit sites in low-GPS conditions, extending AI in robotics market penetration beyond factory walls. Mexico's industrial corridors likewise embrace AI retrofits to stay competitive following USMCA content rules. Europe emphasizes ethical, safe, and trustworthy AI, shaping both technology development and regulatory frameworks. Germany leads robot density with 28,355 new installations in 2023, aided by government subsidies for Mittelstand automation projects. Horizon Europe grants encourage academic-industry clusters in robotics for agri-tech, healthcare, and green manufacturing. Nonetheless, diverging interpretations of CE marking and AI liability delay cross-border deployments, particularly for cobots. Growth potential in Central and Eastern Europe remains high as labor shortages push factories to invest. Smaller markets in South America, the Middle East, and Africa are nascent but benefit from turnkey Robot-as-a-Service contracts that lower upfront capital barriers, nudging global uptake of the AI in robotics market.
- NVIDIA Corporation
- IBM Corporation
- Microsoft Corporation
- ABB Ltd.
- FANUC Corporation
- KUKA AG
- Yaskawa Electric Corp.
- Universal Robots A/S
- Hanson Robotics Ltd.
- Boston Dynamics, Inc.
- Brain Corporation
- Vicarious AI
- Neurala, Inc.
- Kindred AI
- Preferred Networks, Inc.
- Veo Robotics, Inc.
- Fetch Robotics, Inc.
- Blue River Technology (John Deere)
- UiPath Inc.
- SoftBank Robotics Group Corp.
Additional Benefits:
- The market estimate (ME) sheet in Excel format
- 3 months of analyst support
TABLE OF CONTENTS
1 INTRODUCTION
- 1.1 Study Assumptions and Market Definition
- 1.2 Scope of the Study
2 RESEARCH METHODOLOGY
3 EXECUTIVE SUMMARY
4 MARKET LANDSCAPE
- 4.1 Market Overview
- 4.1.1 Market Drivers
- 4.1.1.1 Integration of Edge-AI Chips Enabling Real-Time Robot Decision-Making in Asia's Electronics Manufacturing
- 4.1.1.2 Rapid Aging Population Accelerating Demand for Elder-Care Robots in Japan and South Korea
- 4.1.1.3 EU Horizon Europe Funding Streamlining Collaborative AI-Robot Research Consortia
- 4.1.1.4 E-Commerce Fulfilment Boom Driving AI-Enabled Warehouse Automation in North America
- 4.1.1.5 Surge in Autonomous Mobile Robots within German Automotive Final Assembly Lines
- 4.1.1.6 Falling Vision-Sensor Costs Allowing SMB AI-Retrofit Kits for Legacy Robots Globally
- 4.1.2 Market Restraints
- 4.1.2.1 Scarcity of High-Quality Domain Data for Niche Robot-Perception Tasks
- 4.1.2.2 Fragmented Safety Standards Hindering Cross-Border Cobot Deployment
- 4.1.2.3 High Up-Front Cost of AI Processor Modules for Low-Margin Food Processors
- 4.1.2.4 Cyber-Physical Security Concerns Limiting Cloud-Connected Service Robots in Hospitals
- 4.1.1 Market Drivers
- 4.2 Value / Supply-Chain Analysis
- 4.3 Regulatory and Standards Outlook
- 4.4 Technological Outlook
- 4.5 Porter's Five Forces
- 4.5.1 Bargaining Power of Suppliers
- 4.5.2 Bargaining Power of Buyers/Consumers
- 4.5.3 Threat of New Entrants
- 4.5.4 Threat of Substitutes
- 4.5.5 Intensity of Competitive Rivalry
- 4.6 Investment Analysis
5 MARKET SIZE AND GROWTH FORECASTS (VALUE)
- 5.1 By Component
- 5.1.1 Hardware
- 5.1.1.1 Sensors
- 5.1.1.2 Actuators
- 5.1.1.3 Power Systems
- 5.1.1.4 Control Systems
- 5.1.2 Software
- 5.1.2.1 Machine Learning and Deep Learning
- 5.1.2.2 Computer Vision
- 5.1.2.3 Natural Language Processing
- 5.1.2.4 Context Awareness / Decision-Making
- 5.1.3 Services
- 5.1.3.1 Integration and Deployment
- 5.1.3.2 Support and Maintenance
- 5.1.1 Hardware
- 5.2 By Robot Type
- 5.2.1 Industrial Robots
- 5.2.1.1 Articulated Robots
- 5.2.1.2 SCARA Robots
- 5.2.1.3 Cartesian Robots
- 5.2.1.4 Collaborative Robots (Cobots)
- 5.2.2 Service Robots
- 5.2.2.1 Professional Service Robots
- 5.2.2.1.1 Logistics Robots
- 5.2.2.1.2 Medical and Healthcare Robots
- 5.2.2.1.3 Defense and Security Robots
- 5.2.2.1.4 Field Robots (Agriculture and Mining)
- 5.2.2.2 Personal and Domestic Robots
- 5.2.2.2.1 Household Robots
- 5.2.2.2.2 Entertainment and Companion Robots
- 5.2.2.1 Professional Service Robots
- 5.2.1 Industrial Robots
- 5.3 By Application
- 5.3.1 Manufacturing and Assembly
- 5.3.2 Logistics and Warehousing
- 5.3.3 Healthcare and Surgery
- 5.3.4 Retail and E-Commerce Operations
- 5.3.5 Food and Beverage Processing
- 5.3.6 Inspection and Maintenance
- 5.3.7 Other Applications
- 5.4 By End-user Industry
- 5.4.1 Automotive
- 5.4.2 Electronics and Semiconductors
- 5.4.3 Retail and E-Commerce
- 5.4.4 Healthcare
- 5.4.5 Food and Beverage
- 5.4.6 Aerospace and Defense
- 5.4.7 Others
- 5.5 By Geography
- 5.5.1 North America
- 5.5.1.1 United States
- 5.5.1.2 Canada
- 5.5.1.3 Mexico
- 5.5.2 South America
- 5.5.2.1 Brazil
- 5.5.2.2 Argentina
- 5.5.2.3 Rest of South America
- 5.5.3 Europe
- 5.5.3.1 Germany
- 5.5.3.2 United Kingdom
- 5.5.3.3 France
- 5.5.3.4 Italy
- 5.5.3.5 Spain
- 5.5.3.6 Nordics
- 5.5.3.7 Rest of Europe
- 5.5.4 Middle East
- 5.5.4.1 United Arab Emirates
- 5.5.4.2 Saudi Arabia
- 5.5.4.3 Turkey
- 5.5.4.4 Rest of Middle East
- 5.5.5 Africa
- 5.5.5.1 South Africa
- 5.5.5.2 Nigeria
- 5.5.5.3 Egypt
- 5.5.5.4 Rest of Africa
- 5.5.6 Asia Pacific
- 5.5.6.1 China
- 5.5.6.2 Japan
- 5.5.6.3 South Korea
- 5.5.6.4 India
- 5.5.6.5 ASEAN
- 5.5.6.6 Rest of Asia Pacific
- 5.5.1 North America
6 COMPETITIVE LANDSCAPE
- 6.1 Market Concentration
- 6.2 Strategic Moves
- 6.3 Market Share Analysis
- 6.4 Company Profiles {(includes Global-level Overview, Market-level Overview, Core Segments, Financials, Strategic Info, Market Rank/Share, Products and Services, Recent Developments)}
- 6.4.1 NVIDIA Corporation
- 6.4.2 IBM Corporation
- 6.4.3 Microsoft Corporation
- 6.4.4 ABB Ltd.
- 6.4.5 FANUC Corporation
- 6.4.6 KUKA AG
- 6.4.7 Yaskawa Electric Corp.
- 6.4.8 Universal Robots A/S
- 6.4.9 Hanson Robotics Ltd.
- 6.4.10 Boston Dynamics, Inc.
- 6.4.11 Brain Corporation
- 6.4.12 Vicarious AI
- 6.4.13 Neurala, Inc.
- 6.4.14 Kindred AI
- 6.4.15 Preferred Networks, Inc.
- 6.4.16 Veo Robotics, Inc.
- 6.4.17 Fetch Robotics, Inc.
- 6.4.18 Blue River Technology (John Deere)
- 6.4.19 UiPath Inc.
- 6.4.20 SoftBank Robotics Group Corp.
7 MARKET OPPORTUNITIES AND FUTURE OUTLOOK
- 7.1 White-Space and Unmet-Need Assessment

 具身智慧(人形機器人)MCU市場:2026年
 具身人工智慧機器人市場:按機器人類型、人工智慧技術、移動性、應用、國家和地區分類-全球產業分析、市場規模、市場佔有率及2026年至2033年預測
 人工智慧機器人市場-2026-2032年全球市場預測嵌入式人工智慧(人形機器人)用主控SoC研究報告(2026)人工智慧和機器人系統維護服務市場報告:趨勢、預測和競爭分析(至2035年)人工智慧在機器人領域的市場:全球產業分析、市場規模、市場佔有率及預測(按產品、機器人類型、技術、部署類型、最終用途、國家和地區分類),2026年至2033年
 人工智慧(AI)機器人市場規模、佔有率和成長分析:按機器人類型、組件、技術、應用、最終用戶和地區分類-2026-2033年產業預測
 2034年機器人人工智慧市場預測:按組件、部署模式、機器人類型、技術、最終用戶和地區分類的全球分析具身人工智慧(EAI)機器人資料產業佈局(2026 年)人工智慧機器人市場預測至2034年——全球機器人類型、技術、組件、應用、最終用戶和區域分析