


 |
市場調查報告書
商品編碼
2123117
數位孿生(DT):市場佔有率分析、產業趨勢與統計資料、成長預測(2026-2031 年)Digital Twin (DT) - Market Share Analysis, Industry Trends & Statistics, Growth Forecasts (2026 - 2031) |
||||||

※ 本網頁內容可能與最新版本有所差異。詳細情況請與我們聯繫。
據 Mordor Intelligence 稱,2025 年數位孿生 (DT) 市值為 361.9 億美元,預計到 2031 年將達到 2284.6 億美元,而 2026 年為 492 億美元,預測期(2026-2031 年)的複合年成長率為 35.95%。
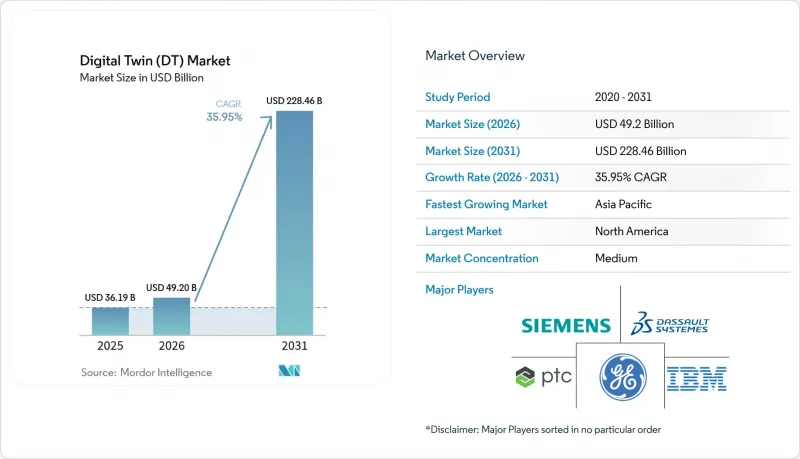
本報告按應用領域(製造業、能源電力、航太與國防、石油天然氣、汽車等)、組件(解決方案/平台和服務)、部署方式(本地部署和雲端部署)、企業規模(大型企業和中小企業)以及地區進行分類。
全球數位孿生(DT)市場趨勢與洞察
工業IoT(IIoT)平台快速成長
工業物聯網 (IIoT) 的廣泛應用提供了即時數據,從而保持數位模型與工廠車間之間的同步。西門子報告稱,憑藉其 Xcelerator 生態系統的優勢,其數位化業務收入在 2024 年達到 90 億歐元(97.2 億美元),年增 22%。Honeywell的 Forge 平台每天處理超過 30 億資料點,將客戶工廠的意外停機時間減少了 35%。 OPC UA 和 MQTT 等標準化協議降低了系統整合的門檻,使工廠能夠在幾週內而不是幾個月內部署數位孿生模型。這帶來了持續的成本降低、更快的根本原因分析以及更可預測的生產力計畫。
在邊緣/設備層面擴展邊緣/AI推理
將分析處理從雲端遷移到邊緣可以降低延遲並維護資料主權。微軟和西門子共同開發的「工業基礎模型」可在資產層級執行推理,從而實現毫秒異常檢測響應。奧迪目前正透過部署在邊緣的孿生體運行虛擬PLC,以最佳化實際生產線的週期時間。本地模擬還能降低頻寬消耗,因為只有異常資料才會向上游發送。專用晶片和容器化運行時進一步降低了二級供應商的部署成本,加速了人工智慧孿生體在整個價值鏈中的應用。
IT/OT堆疊中的網實整合安全漏洞
西班牙國家網路安全研究所指出,連接IT和OT的孿生系統正在擴大攻擊面,並將流程控制器暴露於資料完整性威脅之下。最近一次勒索軟體攻擊迫使一家製造商停產數日,以便清理其孿生系統的資料湖。企業整合零信任架構和培訓員工的過程導致平均部署延遲18個月。多租戶孿生系統增加了複雜性,因為必須在不影響協作的情況下對合作夥伴的存取權限進行隔離。
細分市場分析
到2025年,製造業將佔據數位孿生市場35.10%的佔有率,這得益於嵌入式工業物聯網感測器、預測性維護程序以及持續改進的文化。汽車和電子工廠正在實施生產線級數位孿生技術,以分析週期時間波動和品質/良率模式,從而將廢品率降低兩位數。能源效率的提升將進一步推動投資回報,尤其是在資源密集的冶金和水泥產業。預計即使其他行業迎頭趕上,該領域仍將穩步成長並保持其規模經濟優勢。
目前規模較小的油氣產業預計到2031年將以28.1%的複合年成長率成長,這主要得益於海上作業者對遠端偵測和故障定位能力的需求。在上游領域,整合地震探勘資料和生產測井資料的儲存孿生系統正在被應用,使工程師能夠在部署鑽機之前模擬油井維修方案。中游企業正在應用管道孿生系統進行洩漏檢測,而像殼牌這樣的下游煉油廠透過檢驗DNV認證的孿生系統,已將計劃外停機時間減少了20%。政府的脫碳目標進一步推動了孿生系統的應用,因為它可以最佳化火炬燃燒最小化和熱整合策略。在上述兩個領域,人工智慧驅動的情境測試正在推動孿生系統從單純的監測系統發展成為決策支援系統,從而擴大其在整體部署中的佔有率。
隨著企業採用核心功能,解決方案類別(軟體平台、實體引擎和連網硬體)在2025年的支出中佔比將達到62.85%。供應商將建模庫和視覺化引擎捆綁銷售,使流程工程師無需從頭開始編寫程式碼即可建立模型。授權模式正轉向基於使用量的分級模式,從而擴大了二級供應商的覆蓋範圍。
同時,服務業正以30%的複合年成長率快速擴張。實施顧問公司負責資料管道的協調、語意模型的建構、以及模擬結果的準確性檢驗。託管服務合約透過監控孿生健康指標、打補丁和調整演算法以應對偏差,從而幫助資產所有者實現可預測的營運成本 (OPEX)。隨著基於結果的合約日益普及——例如,勞斯萊斯的 TotalCare 服務利用孿生分析技術保障引擎的運作——服務合作夥伴承擔了更多風險,並將費用與效率提升掛鉤,而不僅僅是與服務時長掛鉤。這種模式增強了客戶忠誠度,並推動了平台的持續改進。
區域分析
預計到2025年,北美將佔據數位孿生市場37.95%的收入佔有率,這主要得益於工業4.0的早期應用、大規模航太項目以及工業SaaS領域強勁的創業融資。美國航空監管機構批准基於模擬的認證,也促進了飛機原始設備製造商(OEM)和一級供應商對數位孿生技術的投資。加拿大和美國的領先能源公司正在部署管道和LNG接收站的數位孿生模型,以降低甲烷外洩率,符合日益嚴格的環境政策。由於網路保險框架的成熟和資料保護法規的標準化,雲端運算的應用尤其廣泛。
亞太地區以26.0%的複合年成長率領先,主要得益於政府主導的大型企劃。中國的「數位中國建設」計畫強制要求在新基礎設施中部署城市數位孿生技術,為國內外供應商創造了大規模的採購機會。印度的「Sangam數位孿生」計畫將網路孿生能力融入全國網路升級,協助該國邁向6G連線。日本的「NTT數位孿生計算計畫」支援城市級模型,為交通和災害應變演算法提供資訊支援。韓國和新加坡正在推進智慧工廠和智慧港口試點項目,重點關注即時碳足跡追蹤。由於該地區是供應鏈樞紐,在此獲得的經驗迅速傳播到全球的原始設備製造商(OEM)。
在歐洲,數位化轉型正穩步推進,監管要求是其中的核心挑戰。 「數位產品護照」強制要求製造商在整個產品生命週期中實現可追溯性,這使得輕量級數位孿生技術在大規模生產商品中應用變得至關重要。德國的「工業4.0平台」提供了標準化的管理框架指南,減輕了中小企業的整合負擔。法國正在投資虛擬造船廠孿生技術,以維持造船業的競爭力;北歐國家則利用建築孿生技術來滿足淨零排放法規的要求。中東和非洲地區雖然仍在發展中,但潛力巨大。阿拉伯聯合大公國和沙烏地阿拉伯正在試驗建設油田孿生和巨型項目級城市孿生,以便在進行大規模擴張之前,先體驗其在效率和永續性方面的優勢。
其他好處:
- Excel格式的市場預測(ME)表
- 3個月的分析師支持
目錄
第1章:引言
- 市場分析與定義的前提條件
- 分析範圍
第2章 分析方法
第3章執行摘要
第4章 市場狀況
- 市場概覽
- 市場促進因素
- 工業IoT平台快速成長
- 在邊緣/設備層面擴展人工智慧推理
- 監管措施正在推進,旨在促進資產密集型行業中安全關鍵基礎設施的數位化。
- 需要採用虛擬性能驗證來降低棕地專案的資本支出
- 基於結果的服務合約的興起,要求提供即時資產副本資料。
- 數位產品護照在歐盟和美國的普及。
- 市場限制因素
- 整個 IT/OT 堆疊中的網實整合安全漏洞
- 特定領域缺乏基於物理的建模專業知識
- 聯邦孿生體產生的資料的智慧財產權所有權不透明。
- 仿真標準的碎片化限制了互通性。
- 重要法規結構的評估
- 價值鏈分析
- 技術展望
- 波特五力分析
- 對關鍵相關人員的影響評估
- 主要用例和案例研究
- 宏觀經濟因素對市場的影響
- 投資分析
第5章 市場區隔
- 透過使用
- 製造業
- 能源與電力
- 航太/國防
- 石油和天然氣
- 車
- 其他
- 按組件
- 解決方案/平台
- 服務
- 透過部署方法
- 現場
- 雲
- 按公司規模
- 大公司
- 中小企業
- 按地區
- 北美洲
- 美國
- 加拿大
- 墨西哥
- 南美洲
- 巴西
- 阿根廷
- 其他南美國家
- 歐洲
- 英國
- 德國
- 法國
- 義大利
- 西班牙
- 北歐的
- 其他歐洲國家
- 中東和非洲
- 中東
- 沙烏地阿拉伯
- 阿拉伯聯合大公國
- 土耳其
- 其他中東國家
- 非洲
- 南非
- 埃及
- 奈及利亞
- 其他非洲國家
- 中東
- 亞太地區
- 中國
- 印度
- 日本
- 韓國
- ASEAN
- 澳洲
- 紐西蘭
- 其他亞太國家
- 北美洲
第6章 競爭情勢
- 市場集中度
- 策略趨勢
- 市佔率分析
- 公司簡介
- ANSYS, Inc.
- AVEVA Group plc
- Bentley Systems, Incorporated
- Cal-Tek SRL
- Cityzenith, Inc.
- Dassault Systemes SE
- General Electric Company
- Hexagon AB
- International Business Machines Corporation
- Lanner Group Limited(Royal HaskoningDHV)
- Mevea Ltd.
- Microsoft Corporation
- Oracle Corporation
- PTC Inc.
- Rescale, Inc.
- Robert Bosch GmbH(Bosch.IO)
- SAP SE
- Schneider Electric SE
- Siemens AG
- Amazon Web Services, Inc.
第7章 市場機會與未來展望
According to Mordor Intelligence, the digital twin market size was valued at USD 36.19 billion in 2025 and estimated to grow from USD 49.2 billion in 2026 to reach USD 228.46 billion by 2031, at a CAGR of 35.95% during the forecast period (2026-2031).
This report is Segmented by Application (Manufacturing, Energy and Power, Aerospace and Defense, Oil and Gas, Automotive, and Others), Component (Solutions/Platforms, and Services), Deployment Mode (On-Premises, and Cloud), Enterprise Size (Large Enterprises, and Small and Medium Enterprises (SMEs)), and Geography.
Global Digital Twin (DT) Market Trends and Insights
Rapid growth of industrial IoT platforms
Widespread IIoT deployment supplies real-time data that keeps digital models synchronized with factory floors. Siemens reported EUR 9 billion (USD 9.72 billion) digital business revenue in 2024, up 22% on the strength of its Xcelerator ecosystem. Honeywell's Forge platform processes 3 billion+ datapoints daily, cutting unplanned downtime by 35% in client plants. Standardized protocols such as OPC UA and MQTT reduce integration friction, enabling plants to deploy twins in weeks rather than months. The result is steady cost avoidance, quicker root-cause analysis, and more predictable capacity planning.
Expansion of edge/AI inference at the device level
Moving analytics from cloud to edge trims latency and preserves data sovereignty. Microsoft and Siemens co-developed Industrial Foundation Models that run inference at the asset, allowing millisecond-level responses for anomaly detection. Audi now operates virtual PLCs through edge-deployed twins that optimize cycle times in real manufacturing lines. Local simulation also limits bandwidth consumption because only exception of data moves upstream. Specialized chips and containerized runtimes further cut deployment costs for tier-two suppliers, accelerating the spread of AI-ready twins throughout value chains.
Cyber-physical security vulnerabilities across IT/OT stacks
The Spanish National Cybersecurity Institute notes that twins bridging IT and OT widen attack surfaces, exposing process controllers to data-integrity threats. Recent ransomware events forced manufacturers to halt production for days while cleansing twin data lakes. Average deployment delays of 18 months arise as firms integrate zero-trust architectures and train staff. Multi-tenant twins add complexity because partner access must be segmented without slowing collaboration.
Other drivers and restraints analyzed in the detailed report include:
- Regulatory push for asset-intensive industries to digitise safety-critical infrastructure
- Demand for virtual commissioning to cut CAPEX
- Shortage of domain-specific physics-based modelling expertise
For complete list of drivers and restraints, kindly check the Table Of Contents.
Segment Analysis
Manufacturing contributed 35.10% of the digital twin market in 2025 thanks to embedded IIoT sensors, predictive maintenance programs, and continuous-improvement cultures. Automotive and electronics plants deploy line-level twins to analyze takt-time fluctuations and quality-yield patterns, trimming scrap rates by double digits. Energy-efficiency gains add another payback layer, particularly in resource-intensive metallurgy and cement operations. The segment is forecast to expand steadily, preserving its quantitative edge even as other verticals catch up.
Oil and Gas, though smaller today, is projected to grow at a 28.1% CAGR to 2031 as offshore operators require remote inspection and fault-isolation capabilities. The upstream segment deploys reservoir twins that integrate seismic data and production logs, allowing engineers to simulate well-workover scenarios before mobilizing rigs. Midstream companies apply pipeline twins for leak detection, while downstream refineries like Shell have documented 20% unplanned downtime reductions using twins verified by DNV standards. Government decarbonization targets further propel adoption as twins optimize flare minimization and heat-integration strategies. Across both segments, AI-assisted scenario testing elevates twins from monitoring to decision-support systems, reinforcing their share of total deployments.
The solutions category-software platforms, physics engines, and connected hardware-accounted for 62.85% of spending in 2025 as companies acquired core capabilities. Vendors bundle modeling libraries with visualization engines so process engineers can assemble replicas without coding from scratch. Licensing models are shifting to consumption-based tiers, broadening access among tier-two suppliers.
Services, however, are scaling faster at a 30% CAGR. Implementation consultancies align data pipelines, create semantic models, and validate simulation fidelity. Managed-service contracts monitor twin health metrics, apply patches, and tune algorithms for drift, yielding predictable OPEX for asset owners. As outcome-based agreements proliferate-Rolls-Royce TotalCare guarantees engine uptime backed by twin analytics-service partners assume more risk, tying fees to efficiency gains rather than billable hours. This model strengthens customer loyalty and encourages continuous platform enhancements.
Complete Report Scope:
- By Application
- Manufacturing
- Energy and Power
- Aerospace and Defense
- Oil and Gas
- Automotive
- Others
- By Component
- Solutions/Platforms
- Services
- By Deployment Mode
- On-premises
- Cloud
- By Enterprise Size
- Large Enterprises
- Small and Medium Enterprises (SMEs)
- By Geography
- North America
- United States
- Canada
- Mexico
- South America
- Brazil
- Argentina
- Rest of South America
- Europe
- United Kingdom
- Germany
- France
- Italy
- Spain
- Nordics
- Rest of Europe
- Middle East and Africa
- Middle East
- Saudi Arabia
- United Arab Emirates
- Turkey
- Rest of Middle East
- Africa
- South Africa
- Egypt
- Nigeria
- Rest of Africa
- Middle East
- Asia-Pacific
- China
- India
- Japan
- South Korea
- ASEAN
- Australia
- New Zealand
- Rest of Asia-Pacific
- North America
Geography Analysis
North America commanded 37.95% of digital twin market revenue in 2025 driven by early Industry 4.0 rollouts, extensive aerospace programs, and robust venture funding for industrial SaaS. U.S. aviation regulators' acceptance of simulation-based certification has spurred widespread twin investment among aircraft OEMs and Tier-1 suppliers. Energy majors in Canada and the United States deploy pipeline and LNG terminal twins to cut methane leak rates, aligning with tightening environmental policy. Cloud adoption is particularly strong due to mature cyber-insurance frameworks and standardized data-protection mandates.
Asia-Pacific posts the highest CAGR at 26.0%, supported by government megaprojects. China's Digital China Construction plan mandates urban digital twins for new infrastructure, creating large procurement pipelines for domestic and foreign vendors. India's Sangam Digital Twin scheme integrates network twin capability into nationwide telecom upgrades as the country moves toward 6G readiness. Japan's NTT Digital Twin Computing Initiative supports city-scale replicas that feed transportation and disaster-response algorithms. South Korea and Singapore push smart-factory and smart-port pilots, emphasizing real-time carbon-footprint tracking. The region's supply-chain centrality means lessons learned here propagate quickly to global OEMs.
Europe advances steadily as regulatory imperatives take center stage. The digital product passport forces manufacturers to embed traceability across product life cycles, effectively making a lightweight twin mandatory for high-volume goods. Germany's Plattform Industrie 4.0 provides standardized administration shell guidelines, reducing integration overhead for SMEs. France invests in virtual shipyard twins to maintain competitive edge in naval construction, while the Nordics use building twins to meet net-zero codes. The Middle East and Africa remain nascent but promising: the UAE and Saudi Arabia are piloting oil-field twins and giga-project city twins, seeking efficiency and sustainability benefits prior to large-scale expansion.
- ANSYS, Inc.
- AVEVA Group plc
- Bentley Systems, Incorporated
- Cal-Tek S.R.L.
- Cityzenith, Inc.
- Dassault Systemes SE
- General Electric Company
- Hexagon AB
- International Business Machines Corporation
- Lanner Group Limited (Royal HaskoningDHV)
- Mevea Ltd.
- Microsoft Corporation
- Oracle Corporation
- PTC Inc.
- Rescale, Inc.
- Robert Bosch GmbH (Bosch.IO)
- SAP SE
- Schneider Electric SE
- Siemens AG
- Amazon Web Services, Inc.
Additional Benefits:
- The market estimate (ME) sheet in Excel format
- 3 months of analyst support
TABLE OF CONTENTS
1 INTRODUCTION
- 1.1 Study Assumptions and Market Definition
- 1.2 Scope of the Study
2 RESEARCH METHODOLOGY
3 EXECUTIVE SUMMARY
4 MARKET LANDSCAPE
- 4.1 Market Overview
- 4.2 Market Drivers
- 4.2.1 Rapid growth of industrial IoT platforms
- 4.2.2 Expansion of edge/AI inference at the device level
- 4.2.3 Regulatory push for asset-intensive industries to digitise safety-critical infrastructure
- 4.2.4 Demand for virtual commissioning to cut CAPEX in brownfield projects
- 4.2.5 Rise of outcome-based service contracts needing real-time asset replica data
- 4.2.6 Proliferation of digital product passports in EU and U.S.
- 4.3 Market Restraints
- 4.3.1 Cyber-physical security vulnerabilities across IT/OT stacks
- 4.3.2 Shortage of domain-specific physics-based modelling expertise
- 4.3.3 Opaque IP ownership of data generated in federated twins
- 4.3.4 Fragmentation of simulation standards limiting interoperability
- 4.4 Evaluation of Critical Regulatory Framework
- 4.5 Value Chain Analysis
- 4.6 Technological Outlook
- 4.7 Porter's Five Forces
- 4.7.1 Bargaining Power of Suppliers
- 4.7.2 Bargaining Power of Buyers
- 4.7.3 Threat of New Entrants
- 4.7.4 Threat of Substitutes
- 4.7.5 Competitive Rivalry
- 4.8 Impact Assessment of Key Stakeholders
- 4.9 Key Use Cases and Case Studies
- 4.10 Impact on Macroeconomic Factors of the Market
- 4.11 Investment Analysis
5 MARKET SEGMENTATION
- 5.1 By Application
- 5.1.1 Manufacturing
- 5.1.2 Energy and Power
- 5.1.3 Aerospace and Defense
- 5.1.4 Oil and Gas
- 5.1.5 Automotive
- 5.1.6 Others
- 5.2 By Component
- 5.2.1 Solutions/Platforms
- 5.2.2 Services
- 5.3 By Deployment Mode
- 5.3.1 On-premises
- 5.3.2 Cloud
- 5.4 By Enterprise Size
- 5.4.1 Large Enterprises
- 5.4.2 Small and Medium Enterprises (SMEs)
- 5.5 By Geography
- 5.5.1 North America
- 5.5.1.1 United States
- 5.5.1.2 Canada
- 5.5.1.3 Mexico
- 5.5.2 South America
- 5.5.2.1 Brazil
- 5.5.2.2 Argentina
- 5.5.2.3 Rest of South America
- 5.5.3 Europe
- 5.5.3.1 United Kingdom
- 5.5.3.2 Germany
- 5.5.3.3 France
- 5.5.3.4 Italy
- 5.5.3.5 Spain
- 5.5.3.6 Nordics
- 5.5.3.7 Rest of Europe
- 5.5.4 Middle East and Africa
- 5.5.4.1 Middle East
- 5.5.4.1.1 Saudi Arabia
- 5.5.4.1.2 United Arab Emirates
- 5.5.4.1.3 Turkey
- 5.5.4.1.4 Rest of Middle East
- 5.5.4.2 Africa
- 5.5.4.2.1 South Africa
- 5.5.4.2.2 Egypt
- 5.5.4.2.3 Nigeria
- 5.5.4.2.4 Rest of Africa
- 5.5.4.1 Middle East
- 5.5.5 Asia-Pacific
- 5.5.5.1 China
- 5.5.5.2 India
- 5.5.5.3 Japan
- 5.5.5.4 South Korea
- 5.5.5.5 ASEAN
- 5.5.5.6 Australia
- 5.5.5.7 New Zealand
- 5.5.5.8 Rest of Asia-Pacific
- 5.5.1 North America
6 COMPETITIVE LANDSCAPE
- 6.1 Market Concentration
- 6.2 Strategic Moves
- 6.3 Market Share Analysis
- 6.4 Company Profiles (includes Global level Overview, Market level overview, Core Segments, Financials as available, Strategic Information, Market Rank/Share for key companies, Products and Services, and Recent Developments)
- 6.4.1 ANSYS, Inc.
- 6.4.2 AVEVA Group plc
- 6.4.3 Bentley Systems, Incorporated
- 6.4.4 Cal-Tek S.R.L.
- 6.4.5 Cityzenith, Inc.
- 6.4.6 Dassault Systemes SE
- 6.4.7 General Electric Company
- 6.4.8 Hexagon AB
- 6.4.9 International Business Machines Corporation
- 6.4.10 Lanner Group Limited (Royal HaskoningDHV)
- 6.4.11 Mevea Ltd.
- 6.4.12 Microsoft Corporation
- 6.4.13 Oracle Corporation
- 6.4.14 PTC Inc.
- 6.4.15 Rescale, Inc.
- 6.4.16 Robert Bosch GmbH (Bosch.IO)
- 6.4.17 SAP SE
- 6.4.18 Schneider Electric SE
- 6.4.19 Siemens AG
- 6.4.20 Amazon Web Services, Inc.
7 MARKET OPPORTUNITIES AND FUTURE OUTLOOK
- 7.1 White-space and Unmet-need Assessment

 2034年交通運輸業數位孿生市場預測-全球分析(依孿生範圍、實體資產、生命週期階段、同步等級、最終用戶及地區分類)
 全球數位孿生市場規模、佔有率、趨勢和成長分析報告(2026-2034)
 數位孿生市場:按應用程式、最終用戶產業和地區分類2034年能源產業數位孿生市場預測-全球分析(按孿生類型、組件、部署模式、能源基礎設施、技術、企業規模、數位孿生生命週期階段、應用、最終用戶和地區分類)面向智慧製造的數位孿生市場預測(至2034年)—按組件、數位孿生類型、技術、應用、最終用戶和地區分類的全球分析2026-2034年全球航太航太數位訊號處理器市場規模、佔有率、趨勢與成長分析報告
 數位孿生模擬和情境建模中的生成式人工智慧:市場佔有率分析、產業趨勢和統計數據以及成長預測(2026-2031 年)工業數位孿生解決方案市場:預測至 2034 年 - 按組件、孿生類型、部署模式、應用、最終用戶和地區分類的全球分析數位孿生市場預測至2034年—按組件、部署模式、應用、最終用戶和地區分類的全球分析數位孿生平台市場:預測至 2034 年 - 按平台類型、部署模式、組件、技術、應用、最終用戶和地區分類的全球分析