


 |
市場調查報告書
商品編碼
2123115
擴展分析:市場佔有率分析、行業趨勢和統計數據、成長預測(2026-2031 年)Augmented Analytics - Market Share Analysis, Industry Trends & Statistics, Growth Forecasts (2026 - 2031) |
||||||

※ 本網頁內容可能與最新版本有所差異。詳細情況請與我們聯繫。
據 Mordor Intelligence 稱,2025 年增強分析市場價值為 298.1 億美元,預計到 2031 年將達到 1271.8 億美元,而 2026 年為 379.6 億美元,預測期內(2026-2031 年)的複合年成長率預計為 27.35%。
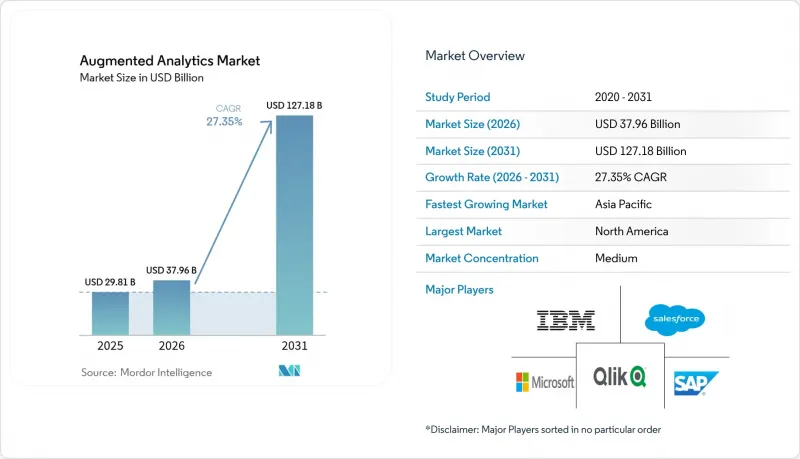
本報告按組件(軟體和服務)、部署類型(本地部署、雲端部署、混合部署)、組織規模(大型企業和中小企業)、最終用戶行業(銀行、金融服務和保險、電信和 IT、零售和消費品、醫療保健和生命科學、製造業、媒體和娛樂、政府和公共部門)以及地區進行細分。
全球增強分析市場趨勢與洞察
對多結構化資料分析的需求日益成長
大約 80% 的企業資料是非結構化的,包括文件、圖像、機器日誌等等。如今,先進的語言和視覺化模型不僅能夠分析傳統的表格形式資料集,還能分析這些非結構化數據,從而為分析師提供了一個統一的分析平台。汽車製造商正在利用這項能力,將感測器遙測數據與維修手冊整合,從而將停機時間預測的準確率提高了 85%。醫院則透過結合放射影像、臨床記錄和基因組圖譜來最佳化診斷流程。這種利用未開發資料資源的能力正推動各組織遷移到整合人工智慧原生分析功能的平台,進而促進增強型分析市場的成長。
促進自助式商業智慧和數據民主化
自然語言提示使市場經理、財務主管和客服中心供電督導無需使用 SQL 即可執行複雜的查詢。這種轉變將請求到獲得洞察的周期從數週縮短到數分鐘,使數據工程團隊能夠專注於更有價值的任務。 ThoughtSpot 與 Google Gemini 模型的整合展示了互動式搜尋如何在返回管治且共用的答案的同時,隱藏複雜性。更廣泛的應用將加強數據素養的回饋循環,鞏固分析文化,並進一步推動增強型分析市場的發展。
資料隱私和安全問題
GDPR 和行業特定法規要求獲得明確許可、數據最小化和審計追蹤,這使得不受限制的 AI 實驗存在風險。供應商目前正在區域資料中心內部署「主權雲端」區域。 MicroStrategy 已與 STACKIT 合作,提供託管在德國和奧地利的符合歐盟標準的堆疊。合規負擔會延緩專案部署,建立長期信任,同時控制短期支出。
細分市場分析
到2025年,軟體銷售額將佔總銷售額的77.40%,因為買家傾向於選擇整合資料擷取、建模和視覺化的端到端套件。就以金額為準,該領域將為增強分析市場貢獻230.7億美元。持續推出的功能,例如產品內建的LLM聊天機器人,正在鞏固合約續約和提升銷售的機會。服務領域雖然規模較小,但正以28.40%的複合年成長率成長,主要得益於部署、模型管治和使用者部署專案。隨著多重雲端環境的擴展,客戶正在將策略設計、測試和ROI基準開發外包給合作夥伴。供應商的專業服務部門正在抓住這一機遇,而全球系統整合商正在建立千人規模的AI工作室以滿足市場需求。
次要影響進一步鞏固了該軟體的主導地位。當 Snowflake 將 Anthropic 的模型整合到其 Cortex 服務中時,客戶無需導出資料即可獲得生成式摘要功能,從而增強了他們對該平台的依賴。在整個預測期內,儘管開放原始碼AI 元件會不斷發展,但買家仍然會傾向於選擇能夠保證安全修補程式和法律保護的商業封裝產品,因此,軟體在增強分析市場的主導地位預計將得以維持。
2025年,雲端採用將佔總支出的59.10%。金融服務公司、線上市場和串流媒體網路正在利用其彈性來應對節日期間的需求激增和模型訓練的密集處理。然而,嚴格的資料居住要求正將關鍵工作負載轉移到私人區域,這推動了混合環境的採用,其複合年成長率高達29.75%。混合環境在增強分析市場中的佔有率預計將從2026年的131.2億美元成長到2031年的482.6億美元。邊緣設備透過在本地處理個人識別資訊並將聚合模式傳輸到雲端人工智慧以進行更詳細的推理,從而在合規性和分析深度之間取得平衡。
邊緣到雲的編配工具預示著下一個競爭戰場。平台需要調度防火牆兩側 Kubernetes叢集上的 SQL、向量搜尋和強化學習作業。能夠實現容器自動化部署、加密金鑰管理和延遲最佳化的供應商預計將佔據相當大的市場佔有率。雖然純本地部署在核能、國防和製藥行業仍然至關重要,但由於這些資金受限的產業硬體更新周期較長,其成長速度落後於混合環境。
區域分析
預計到2025年,北美將貢獻全球47.20%的收入,並維持著許多結構性優勢,例如高密度雲區域、強大的創業投資來源以及大量人工智慧人才。財富500強企業正在將人工智慧卓越中心章程製度化,並將分析功能整合到其財務、供應鏈和人力資源應用中。聯邦政府對人工智慧研究的資助以及簡化的IPO流程正在吸引新創企業,重塑競爭格局。然而,加拿大的資料本地化規定、加州消費者隱私法案(CCPA)的修訂以及反壟斷審查正在推高合規成本,並迫使企業轉型為跨多個司法管轄區的混合架構。
亞太地區目前規模較小,但預計到2031年將以28.10%的複合年成長率快速成長。各國政府在人工智慧基礎建設、半導體和人才培育的預算撥款超過5000億美元。中國人工智慧中心深圳正在提供津貼的GPU叢集。印度的《數位個人資料保護法》正在建立法律規範,同時鼓勵國內創新。製造業巨頭聚集在東京、首爾和新加坡周邊,形成對現場預測分析需求的良性循環。本地供應商透過整合中文、印地語和印尼語語音模型來滿足語言需求,從而在與區域公司的競爭中獲得優勢。因此,增強型分析市場在亞太地區正經歷著規模成長最快的時期。
在歐洲,儘管受GDPR和即將訂定的人工智慧立法影響,供應商的義務增加,但成長率仍維持在15%左右。德國的中型企業(Mittelstands)正在國內部署「主權雲」。法國公共機構正在特定區域進行分析,以遵守有關公民資料的法規。供應商的藍圖現在都包含「歐盟可信區域」的標籤,這反映了歐洲大陸的監管影響力。雖然南北之間仍然存在數位技能差距,但歐盟資助的技能再培訓計劃正在彌合這一差距,並支持技術的穩步普及。
拉丁美洲和中東及非洲地區代表後期發展機遇,預計2031年將佔增強型分析市場近9.85%的佔有率。行動經營模式、金融科技的日益普及以及服務不足人口的存在,正在推動對信用評分和詐欺檢測相關分析的需求。在聖保羅、利雅德和約翰尼斯堡推出雲端區域將降低延遲並滿足資料居住要求,從而確保試點預算,以便在實現投資回報率後將工作負載遷移到生產環境。
其他好處:
- Excel格式的市場預測(ME)表
- 3個月的分析師支持
目錄
第1章:引言
- 研究假設和市場定義
- 調查範圍
第2章:調查方法
第3章執行摘要
第4章 市場狀況
- 市場概覽
- 市場促進因素
- 對多結構化資料分析的需求日益成長
- 自助式商業智慧與數據民主化的推進
- 中小企業透過雲端訂閱採用
- 包含生成式人工智慧的分析套件
- 資料主權邊緣層部署
- 透過SaaS副駕駛主導的嵌入式分析實現貨幣化
- 市場限制因素
- 資料隱私和安全問題
- 工人對被人類取代的焦慮
- 及時彌補工程技能差距
- GPU供不應求和推理成本上升
- 價值供應鏈分析
- 監理情勢
- 技術展望
- 波特五力分析
第5章 市場規模與成長預測
- 按組件
- 軟體
- 服務
- 不同的發展
- 現場
- 雲
- 混合
- 按組織規模
- 大公司
- 小型企業
- 按最終用戶行業分類
- BFSI
- 通訊/IT
- 零售和消費品
- 醫療保健和生命科學
- 製造業
- 媒體與娛樂
- 政府/公共部門
- 按地區
- 北美洲
- 美國
- 加拿大
- 墨西哥
- 南美洲
- 巴西
- 阿根廷
- 其他南美國家
- 歐洲
- 德國
- 英國
- 法國
- 義大利
- 俄羅斯
- 亞太地區
- 中國
- 日本
- 印度
- 韓國
- 其他亞太國家
- 中東
- 沙烏地阿拉伯
- 阿拉伯聯合大公國
- 卡達
- 其他中東國家
- 非洲
- 南非
- 奈及利亞
- 其他非洲國家
- 北美洲
第6章 競爭情勢
- 市場集中度
- 策略趨勢
- 市佔率分析
- 公司簡介
- Microsoft Corporation
- Salesforce Inc.(incl. Tableau)
- SAP SE
- International Business Machines Corp.
- QlikTech International AB
- Google LLC(Looker)
- Oracle Corporation
- SAS Institute Inc.
- TIBCO Software Inc.
- ThoughtSpot Inc.
- MicroStrategy Inc.
- Sisense Inc.
- GoodData Corp.
- Alteryx Inc.
- Domo Inc.
- Zoho Corporation(Zoho Analytics)
- Amazon Web Services-QuickSight
- Yellowfin BI
- Board International
第7章 市場機會與未來展望
According to Mordor Intelligence, the augmented analytics market size was valued at USD 29.81 billion in 2025 and estimated to grow from USD 37.96 billion in 2026 to reach USD 127.18 billion by 2031, at a CAGR of 27.35% during the forecast period (2026-2031).
This report is Segmented by Component (Software and Services), Deployment (On-Premise, Cloud, and Hybrid), Organization Size (Large Enterprises and Small and Mid-Size Enterprises), End-User Industry (BFSI, Telecom and IT, Retail and Consumer Goods, Healthcare and Life Sciences, Manufacturing, Media and Entertainment, and Government and Public Sector), and Geography.
Global Augmented Analytics Market Trends and Insights
Rising demand to analyse multi-structured data
Nearly 80% of enterprise information is unstructured, spanning documents, images, and machine logs. Advanced language and vision models now parse these formats alongside classic tabular datasets, giving analysts a single discovery surface. Automotive manufacturers use the capability to fuse sensor telemetry with maintenance manuals and raise downtime-forecasting accuracy by 85%. Hospitals are combining radiology scans, clinical notes, and genomic profiles to refine diagnostic pathways. The ability to tap these untapped data pools pushes organisations toward platforms that embed AI-native parsers, reinforcing growth for the augmented analytics market.
Self-service BI and data-democratisation push
Natural-language prompts let marketing managers, finance controllers, and call-centre supervisors run complex queries without SQL. This shift cuts request-to-insight cycles from weeks to minutes and frees data-engineering teams for higher-value tasks. ThoughtSpot's integration with Google's Gemini models shows how conversational search hides complexity while returning governed, shareable answers. Higher usage rates improve data-literacy feedback loops, anchoring analytics culture, and lifting the augmented analytics market further.
Data-privacy and security concerns
GDPR and sectoral rules require explicit consent, data minimisation, and audit trails, making unfettered AI experimentation risky. Vendors now launch "sovereign cloud" zones inside regional data centres; MicroStrategy partnered with STACKIT to deliver an EU-compliant stack hosted in Germany and Austria. Compliance overhead slows project rollout, trimming near-term spending even as long-term trust builds.
Other drivers and restraints analyzed in the detailed report include:
- SME uptake via cloud subscriptions
- Generative-AI infused analytics suites
- Workforce anxiety over human-replacement
For complete list of drivers and restraints, kindly check the Table Of Contents.
Segment Analysis
Software accounted for 77.40% revenue in 2025 as buyers gravitated toward end-to-end suites bundling ingestion, modelling, and visualisation. In monetary terms, the segment contributed USD 23.07 billion to the augmented analytics market size. Continuous feature releases, such as in-product LLM chatbots, lock in renewals and upsell paths. The services segment, although smaller, is scaling at 28.40% CAGR on the back of implementation, model-governance, and user-adoption projects. As multi-cloud estates grow, clients commission partners to handle policy design, testing, and ROI baselining. Vendor professional-services groups tap this opportunity, while global system integrators build 1,000-person AI studios to capture demand.
Second-order effects reinforce software primacy. When Snowflake embedded Anthropic's models inside its Cortex service, customers accessed generative summarisation without exporting data, tightening platform dependence. Over the forecast horizon, open-source AI components will evolve, yet buyers still prefer commercial wrappers that guarantee security patches and legal indemnities, sustaining the software segment's lead within the augmented analytics market.
Cloud installations generated 59.10% of total spending in 2025. Financial-services firms, online marketplaces, and streaming networks exploit elasticity for holiday spikes and model-training bursts. However, strict residency mandates push critical workloads to private zones, propelling hybrid setups at a 29.75% CAGR. The hybrid share of the augmented analytics market is projected to rise from USD 13.12 billion in 2026 to USD 48.26 billion by 2031. Edge devices process personally identifiable information locally, then forward aggregated patterns to cloud AI for deeper inference, balancing compliance with analytic depth.
Edge-to-cloud orchestration tools signal the next battleground: platforms must schedule SQL, vector-search, and reinforcement-learning jobs across Kubernetes clusters on both sides of the firewall. Providers able to auto-deploy containers, govern encryption keys, and optimise latency stand to capture an outsized wallet share. On-premises-only deployments remain relevant for nuclear energy, defence, and pharmaceuticals, but growth lags behind hybrid because hardware refresh cycles elongate in capex-constrained sectors.
Complete Report Scope:
- By Component
- Software
- Services
- By Deployment
- On-premise
- Cloud
- Hybrid
- By Organisation Size
- Large Enterprises
- Small and Mid-size Enterprises
- By End-user Industry
- BFSI
- Telecom and IT
- Retail and Consumer Goods
- Healthcare and Life Sciences
- Manufacturing
- Media and Entertainment
- Government and Public Sector
- By Geography
- North America
- US
- Canada
- Mexico
- South America
- Brazil
- Argentina
- Rest of South America
- Europe
- Germany
- United Kingdom
- France
- Italy
- Russia
- Asia Pacific
- China
- Japan
- India
- South Korea
- Rest of Asia Pacific
- Middle East
- Saudi Arabia
- United Arab Emirates
- Qatar
- Rest of Middle East
- Africa
- South Africa
- Nigeria
- Rest of Africa
- North America
Geography Analysis
North America generated 47.20% of global revenue in 2025 and retains structural advantages: dense cloud-region footprint, venture-capital pipelines, and AI-skilled labour pools. Fortune 500 firms institutionalise AI centre-of-excellence charters, embedding analytics inside finance, supply-chain, and HR apps. Federal funding for AI research and streamlined IPO pathways attract startups that refresh the competitive arena. However, data-localisation clauses in Canada, California Consumer Privacy Act amendments, and antitrust scrutiny introduce compliance spend, nudging firms toward multi-jurisdictional hybrid architectures.
Asia-Pacific, while smaller today, is on a 28.10% CAGR trajectory through 2031. Government allocations exceed USD 500 billion for AI infrastructure, semiconductors, and talent development. China's AI hub in Shenzhen offers subsidised GPU clusters; India's Digital Personal Data Protection Act sets guardrails while encouraging domestic innovation. Manufacturing conglomerates cluster around Tokyo, Seoul, and Singapore, creating demand flywheels for shop-floor predictive analytics. Local vendors integrate Mandarin, Hindi, and Bahasa speech models, meeting linguistic requirements and giving regional players an edge. The augmented analytics market thus finds its fastest volume expansion in APAC geographies.
Europe continues to post mid-teen growth even as GDPR and the forthcoming AI Act heighten vendor obligations. Enterprises in Germany's Mittelstand adopt sovereign-cloud deployments inside national borders. French public-sector agencies run analytics in isolated regions to comply with citizen-data statutes. Vendor road maps now include "EU trusted zone" labels, reflecting the continent's regulatory pull. North-to-south digital-skills disparities persist, but EU-funded reskilling programmes close gaps, supporting steady adoption.
Latin America, the Middle East, and Africa represent later-stage opportunities, together projected to account for just under 9.85% of the augmented analytics market by 2031. Mobile-first business models, rising fintech penetration, and under-banked populations create analytics needs around credit scoring and fraud detection. Cloud-region launches in Sao Paulo, Riyadh, and Johannesburg lower latency and address data-residency rules, unlocking pilot budgets that convert to production workloads when ROI materialises.
- Microsoft Corporation
- Salesforce Inc. (incl. Tableau)
- SAP SE
- International Business Machines Corp.
- QlikTech International AB
- Google LLC (Looker)
- Oracle Corporation
- SAS Institute Inc.
- TIBCO Software Inc.
- ThoughtSpot Inc.
- MicroStrategy Inc.
- Sisense Inc.
- GoodData Corp.
- Alteryx Inc.
- Domo Inc.
- Zoho Corporation (Zoho Analytics)
- Amazon Web Services - QuickSight
- Yellowfin BI
- Board International
Additional Benefits:
- The market estimate (ME) sheet in Excel format
- 3 months of analyst support
TABLE OF CONTENTS
1 INTRODUCTION
- 1.1 Study Assumptions and Market Definition
- 1.2 Scope of the Study
2 RESEARCH METHODOLOGY
3 EXECUTIVE SUMMARY
4 MARKET LANDSCAPE
- 4.1 Market Overview
- 4.2 Market Drivers
- 4.2.1 Rising demand to analyse multi-structured data
- 4.2.2 Self-service BI and data-democratisation push
- 4.2.3 SME uptake via cloud subscriptions
- 4.2.4 Generative-AI infused analytics suites
- 4.2.5 Edge-tier deployments for data sovereignty
- 4.2.6 SaaS copilot-led embedded-analytics monetisation
- 4.3 Market Restraints
- 4.3.1 Data-privacy and security concerns
- 4.3.2 Workforce anxiety over human-replacement
- 4.3.3 Prompt-engineering skill gap
- 4.3.4 GPU scarcity and inference cost inflation
- 4.4 Value/Supply-Chain Analysis
- 4.5 Regulatory Landscape
- 4.6 Technological Outlook
- 4.7 Porter's Five Forces Analysis
- 4.7.1 Threat of New Entrants
- 4.7.2 Bargaining Power of Buyers
- 4.7.3 Bargaining Power of Suppliers
- 4.7.4 Threat of Substitutes
- 4.7.5 Competitive Rivalry
5 MARKET SIZE AND GROWTH FORECASTS (VALUE)
- 5.1 By Component
- 5.1.1 Software
- 5.1.2 Services
- 5.2 By Deployment
- 5.2.1 On-premise
- 5.2.2 Cloud
- 5.2.3 Hybrid
- 5.3 By Organisation Size
- 5.3.1 Large Enterprises
- 5.3.2 Small and Mid-size Enterprises
- 5.4 By End-user Industry
- 5.4.1 BFSI
- 5.4.2 Telecom and IT
- 5.4.3 Retail and Consumer Goods
- 5.4.4 Healthcare and Life Sciences
- 5.4.5 Manufacturing
- 5.4.6 Media and Entertainment
- 5.4.7 Government and Public Sector
- 5.5 By Geography
- 5.5.1 North America
- 5.5.1.1 US
- 5.5.1.2 Canada
- 5.5.1.3 Mexico
- 5.5.2 South America
- 5.5.2.1 Brazil
- 5.5.2.2 Argentina
- 5.5.2.3 Rest of South America
- 5.5.3 Europe
- 5.5.3.1 Germany
- 5.5.3.2 United Kingdom
- 5.5.3.3 France
- 5.5.3.4 Italy
- 5.5.3.5 Russia
- 5.5.4 Asia Pacific
- 5.5.4.1 China
- 5.5.4.2 Japan
- 5.5.4.3 India
- 5.5.4.4 South Korea
- 5.5.4.5 Rest of Asia Pacific
- 5.5.5 Middle East
- 5.5.5.1 Saudi Arabia
- 5.5.5.2 United Arab Emirates
- 5.5.5.3 Qatar
- 5.5.5.4 Rest of Middle East
- 5.5.6 Africa
- 5.5.6.1 South Africa
- 5.5.6.2 Nigeria
- 5.5.6.3 Rest of Africa
- 5.5.1 North America
6 COMPETITIVE LANDSCAPE
- 6.1 Market Concentration
- 6.2 Strategic Moves
- 6.3 Market Share Analysis
- 6.4 Company Profiles (includes Global level Overview, Market level overview, Core Segments, Financials as available, Strategic Information, Market Rank/Share for key companies, Products and Services, and Recent Developments)
- 6.4.1 Microsoft Corporation
- 6.4.2 Salesforce Inc. (incl. Tableau)
- 6.4.3 SAP SE
- 6.4.4 International Business Machines Corp.
- 6.4.5 QlikTech International AB
- 6.4.6 Google LLC (Looker)
- 6.4.7 Oracle Corporation
- 6.4.8 SAS Institute Inc.
- 6.4.9 TIBCO Software Inc.
- 6.4.10 ThoughtSpot Inc.
- 6.4.11 MicroStrategy Inc.
- 6.4.12 Sisense Inc.
- 6.4.13 GoodData Corp.
- 6.4.14 Alteryx Inc.
- 6.4.15 Domo Inc.
- 6.4.16 Zoho Corporation (Zoho Analytics)
- 6.4.17 Amazon Web Services - QuickSight
- 6.4.18 Yellowfin BI
- 6.4.19 Board International
7 MARKET OPPORTUNITIES AND FUTURE OUTLOOK
- 7.1 White-space and Unmet-need Assessment

 戶外噪音預測軟體市場報告:趨勢、預測與競爭分析(至2035年)
 銀行、金融服務和保險 (BFSI) 產業增強分析市場規模、佔有率和成長分析:按服務產品、部署類型、組織規模、最終用戶和地區分類-2026-2033 年產業預測
 低程式碼嵌入式分析市場規模、佔有率和成長分析:按組件、部署類型、組織規模、應用領域、最終用戶產業和地區分類-2026-2033年產業預測
 增強型分析市場:組件、技術、部署模式、最終用戶、應用與最終用途-2026-2032年全球市場預測
 增強型分析市場預測至 2034 年—按組件、部署類型、企業規模、技術、應用、最終用戶和地區分類的全球分析
 員工流動率預測軟體:市場佔有率分析、產業趨勢與統計、成長預測(2026-2031)超自動化軟體平台市場預測至2034年-按組件、開發模式、企業規模、部門、技術、最終用戶和地區分類的全球分析
 增強型分析市場規模、佔有率、趨勢和預測:按組件、部署模式、企業規模、行業和地區分類,2026-2034 年
 2026年銀行業、金融服務業和保險業(BFSI)擴展分析全球市場報告2026年全球擴展分析市場報告