


 |
市場調查報告書
商品編碼
2122932
氫氣:市場佔有率分析、產業趨勢與統計、成長預測(2026-2031)Hydrogen Gas - Market Share Analysis, Industry Trends & Statistics, Growth Forecasts (2026 - 2031) |
||||||

※ 本網頁內容可能與最新版本有所差異。詳細情況請與我們聯繫。
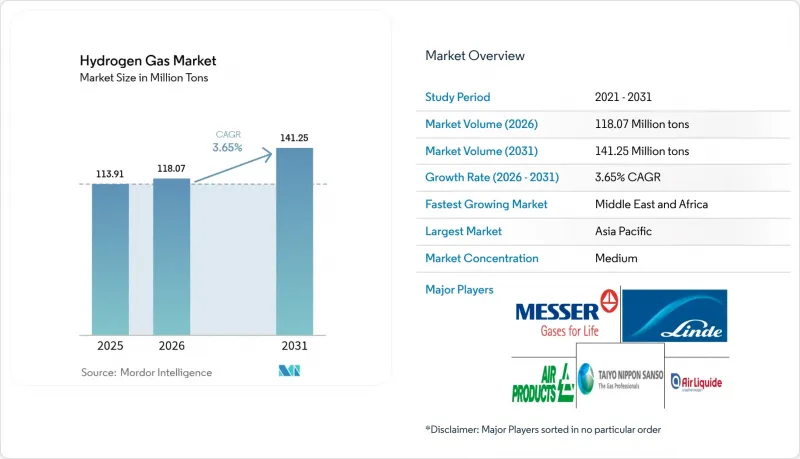
據 Mordor Intelligence 稱,2025 年氫氣市場價值為 1.1391 億噸,預計到 2031 年將達到 1.4125 億噸,而 2026 年為 1.1807 億噸,預測期內(2026-2031 年)的複合成長率預計為 3.65%。
本報告按分銷管道(管道、高壓管束拖車、氣瓶)、應用領域(氨、甲醇、淨化、直接還原鐵 (DRI)、燃料電池汽車 (FCV) 及其他)和地區(亞太地區、北美地區、歐洲地區、南美地區、中東和非洲地區)進行細分。市場規模和預測以噸為單位。
全球氫氣市場趨勢及洞察
煉油廠脫硫法規
由於國際海事組織 (IMO) 的燃油法規和美國 Tier 3 汽油標準,氫氣處理系統對氫氣的需求隨著硫含量每降低一級而增加 5% 至 8%。因此,墨西哥灣沿岸地區、鹿特丹和新加坡的煉油廠正在擴建連接到專用管道的現場蒸氣甲烷重整裝置,並簽署多年商業協議。新興市場煉油廠仍透過管網拖車購買氫氣,其交付價格每公斤需高出 0.50 至 0.80 美元。 ISO 14001 報告要求強制揭露氫氣的碳排放強度,這促使現貨採購轉向低排放來源。在已實施碳定價的地區,由於 2026 年的合規期限,即使電解槽維修已接近碳酸鹽平價,基準需求仍得以維持。
政府對綠氫能的激勵措施
美國《通膨控制法》第45V條規定,對於二氧化碳排放量不超過0.45公斤的氫氣,政府將提供每公斤最高3美元的補貼,以鼓勵採用電解槽並結合可再生能源。歐洲氫能銀行於2024年授予了一份價值7.2億歐元的差價合約(CFD),旨在縮小氫氣與灰氫的成本差距,但競標成交量僅佔2030年1000萬噸年進口目標的一小部分。日本、中國和韓國已延長了購買補貼和上網電價補貼政策,以支持兆瓦級氫氣堆的訂單。據製造商資訊披露,這些措施已使中國鹼性電解槽的價格降至每千瓦200美元以下。這些多層次的獎勵正推動氫氣市場在交通運輸、鋼鐵和化肥等領域實現成本競爭。
高成本的倉儲和運輸物流
在350巴的壓力下,壓縮儲存氫氣的能量密度僅為柴油的十分之一,導致使用管網拖車運送氫氣,且運輸距離超過300公里時,每公斤氫氣需額外支付超過2美元的費用。液化過程會消耗氫氣25%至35%的熱值,並且需要低溫儲罐,其成本約為每公斤每天1000美元。液態有機載體雖然可以減少蒸發損失,但往返效率會降低40%,並且需要昂貴的脫氫催化劑。新建氫氣管道的成本為每公里300萬至500萬美元,這還不包括土地購買成本,限制了氫氣在南美洲和撒哈拉以南非洲地區的部署。在這些地區,生產和分銷的資本投資必須整合到待開發區項目中。這些成本嚴重影響了氫氣產業的短期經濟可行性。
細分市場分析
到2025年,管道網路將供應全球58.42%的氫氣市場,預計在預測期(2026-2031年)內將以4.12%的複合年成長率成長,因為煉油廠和氨廠需要不間斷的氫氣供應。對於每日消耗量為50-500公斤且沒有支線的工業用戶而言,管束拖車仍然必不可少;而隨著向筒式氫氣的過渡,實驗室和通訊備用系統中鋼瓶組的使用量正在減少。新興的出口管道將推動未來的成長。計劃建造的通往沙烏地阿拉伯亞喀巴的1500公里長的NEOM管道將用於供應綠色氨出口;在歐洲,計劃改造11600公里的天然氣輸送管道,這將使建設成本比新建設降低60%。中東和非洲正在主導管道擴建,以支持吉瓦級電解的運行,目標是到2030年將交付成本降至每公斤1.50-2美元。
在需求分散的地區,管式拖車更具經濟效益。一套300巴、1000公斤負載的裝置可以服務半徑200公里內的六家客戶,而先進的路線最佳化可以將滑行距離縮短20-30%。氣瓶組對季節性浮法玻璃廠和特殊焊接廠仍然具有吸引力,但由於ISO 11114標準要求每五年進行一次水壓試驗,其生命週期成本正在增加。因此,在區域需求集中到足以支撐新建鋼管管道建設之前,氫氣市場的配送方案正在努力平衡高容量管道和靈活的陸上物流。
區域分析
亞太地區預計到2025年將佔全球氫氣市場佔有率的34.23%,這主要得益於中國建成的1104座加氫站、日本的氨進口計畫以及韓國到2040年氫氣消費量達到620萬公升的目標。在中國,省級政府對10兆瓦及以上電解槽的津貼使得鹼性電池組的成本保持在每千瓦200美元以下,僅為歐洲平均水平的一半,中國供應商也正積極準備出口。印度的「國家氫能計畫」投資1,970億印度盧比(約24億美元),目標是到2030年實現500萬公升的氫氣產量,重點發展古吉拉突邦和奧裡薩邦等太陽能發電成本低於每千瓦時2美元的地區。在東協,泰國、新加坡和馬來西亞正在試驗性地將氫氣併入電網,並在燃煤發電廠中混燒氨氣,同時也等待碳定價機制的明確。
預計中東和非洲地區在預測期(2026-2031年)內將以4.12%的複合年成長率實現最高成長。沙烏地阿拉伯、阿拉伯聯合大公國、阿曼和埃及的計畫預計到2030年將實現每公斤1.50-2美元的運轉率,這些計畫將結合太陽能發電和30-40%產能的海水淡化技術。 NEOM計畫計畫從2026年下半年開始,每天以氨的形式運輸650噸氫氣;而南非的Boegoebaai計畫的目標是從2028年開始生產40萬噸綠色氨,儘管其海水淡化成本為每公斤0.30-0.50美元。
在北美,美國能源局正在資助七個區域中心,每個中心每年生產5萬至10萬噸氫氣,用於煉油、化肥和運輸。加拿大正在亞伯達省開發碳捕獲的藍氫,並在魁北克省利用水力發電生產綠氫,一旦歐盟的碳邊境調節關稅最終確定,預計將向歐盟出口。在歐洲,現有的天然氣輸送和分配網路正在進行改造。德國允許在特定領域混合使用20%的氫氣,英國正在規劃建造一個100%氫能村莊,法國正在支持敦克爾克200兆瓦電解項目,為安賽樂米塔爾的直接還原鐵試點項目提供氫氣。南美洲的氫氣計畫主要集中在智利風力資源豐富的麥哲倫地區和巴西的佩塞姆港,但由於併網延誤,一些最終決定被推遲到2026年。總體而言,多元化的區域管道、樞紐項目和出口項目正在推動全球氫氣市場的擴張。
其他好處
- Excel格式的市場預測(ME)表
- 3個月的分析師支持
目錄
第1章:引言
- 研究假設和市場定義
- 調查範圍
第2章:調查方法
第3章執行摘要
第4章 市場狀況
- 市場概覽
- 市場促進因素
- 煉油廠脫硫法規
- 政府對綠氫能的激勵措施
- 燃料電池汽車普及率的提高
- 強制將氫氣和天然氣混合併入電網
- 利用剩餘可再生能源進行電能轉氣的經濟效益。
- 市場限制因素
- 高成本的倉儲和運輸物流
- 當地社區反對新建氫氣管道
- 乾旱地區缺水帶來的限制
- 價值鏈分析
- 波特五力模型
第5章 市場規模與成長預測
- 透過散佈
- 管道
- 高壓管拖車
- 圓柱
- 透過使用
- 氨
- 甲醇
- 純化
- 直接還原鐵(DRI)
- 燃料電池汽車(FCV)
- 其他
- 按地區
- 亞太地區
- 中國
- 印度
- 日本
- 韓國
- ASEAN
- 其他亞太國家
- 北美洲
- 美國
- 加拿大
- 墨西哥
- 歐洲
- 德國
- 英國
- 法國
- 義大利
- 俄羅斯
- 北歐國家
- 其他歐洲國家
- 南美洲
- 巴西
- 阿根廷
- 其他南美國家
- 中東和非洲
- 沙烏地阿拉伯
- 南非
- 其他中東和非洲國家
- 亞太地區
第6章 競爭情勢
- 市場集中度
- 策略趨勢
- 市佔率和排名分析
- 公司簡介
- Aditya Birla Chemicals
- Air Liquide
- Air Products and Chemicals, Inc.
- BASF SE
- Equinor ASA
- Gulf Cryo
- Iwatani Corp.
- Kawasaki Heavy Industries, Ltd.
- Linde plc
- MATHESON Tri-Gas, Inc.
- Messer SE & Co. KGaA
- TAIYO NIPPON SANSO CORPORATION
第7章 市場機會與未來展望
According to Mordor Intelligence, the hydrogen gas market size was valued at 113.91 Million tons in 2025 and is estimated to grow from 118.07 Million tons in 2026 to reach 141.25 Million tons by 2031, at a CAGR of 3.65% during the forecast period (2026-2031).
This report is Segmented by Distribution (Pipeline, High-Pressure Tube Trailer, and Cylinder), Application (Ammonia, Methanol, Refining, Direct Reduced Iron (DRI), Fuel-Cell Vehicles (FCVs), and Other Applications), and Geography (Asia Pacific, North America, Europe, South America, and the Middle East and Africa). The Market Sizing and Forecasts are Provided in Terms of Volume (tons).
Global Hydrogen Gas Market Trends and Insights
Refinery Desulfurization Regulations
International Maritime Organization fuel rules and US Tier 3 gasoline standards increase hydrotreater hydrogen demand by 5-8% for each incremental sulfur cut. Gulf Coast, Rotterdam, and Singapore refineries therefore expand on-site steam-methane reformers tied into dedicated pipelines, locking in multi-year merchant contracts. Emerging-market refineries still purchasing tube-trailer gas pay USD 0.50-0.80 more per kg on a delivered basis. ISO 14001 reporting now requires disclosure of hydrogen carbon intensity, which is steering spot purchases toward lower-emission supply. Compliance deadlines through 2026 sustain baseline demand even as electrolyzer retrofits near parity in carbon-priced regions.
Government Incentives for Green H2
Section 45V of the US Inflation Reduction Act offers up to USD 3 per kg for hydrogen below 0.45 kg CO2-eq, stimulating co-located renewable-power electrolyzers. Europe's Hydrogen Bank awarded EUR 720 million of contracts-for-difference in 2024 to narrow the cost gap with grey hydrogen, but auctioned volumes remain a fraction of the 10 Mt annual import target for 2030. Japan, China, and South Korea extend purchase subsidies and feed-in tariffs that underpin multi-megawatt stack orders, driving Chinese alkaline electrolyzer prices under USD 200 per kW according to manufacturer disclosures. These layered incentives bring the hydrogen gas market closer to cost competitiveness in mobility, steel, and fertilizer.
Expensive Storage and Transport Logistics
Compressed storage at 350 bar packs one-tenth the energy density of diesel, so tube-trailer fleets incur delivery premiums above USD 2 per kg on routes exceeding 300 km. Liquefaction consumes 25-35% of hydrogen's lower heating value and needs cryogenic tanks costing about USD 1,000 per kg daily throughput. Liquid-organic carriers cut boil-off losses yet suffer 40% round-trip efficiency losses and costly dehydrogenation catalysts. New hydrogen-grade pipelines run USD 3-5 million per km before right-of-way, limiting deployments in South America and Sub-Saharan Africa, where greenfield projects must bundle production and distribution capex. These costs weigh on near-term economics for the hydrogen gas industry.
Other drivers and restraints analyzed in the detailed report include:
- Rising Fuel-Cell Vehicle Roll-out
- Hydrogen-Gas-Grid Blending Mandates
- Community Opposition to New H2 Pipelines
For complete list of drivers and restraints, kindly check the Table Of Contents.
Segment Analysis
Pipeline networks supplied 58.42% of the hydrogen gas market size in 2025 and are projected to expand at a 4.12% CAGR during the forecast period (2026-2031) as refineries and ammonia plants demand uninterrupted flows. Tube trailers remain essential for 50-500 kg-per-day industrial users lacking spur lines, while cylinder packs shrink in laboratories and telecom backup systems that transition to cartridge formats. Emerging export pipelines reinforce future growth: Saudi Arabia's 1,500-km NEOM line to Aqaba will feed green-ammonia export, and Europe plans to repurpose 11,600 km of gas transmission lines, trimming build costs 60% versus new construction. The Middle East and Africa lead pipeline additions, supporting gigawatt electrolyzers that target delivered costs of USD 1.50-2.00 per kg by 2030.
Tube-trailer economics improve where demand is fragmented; a 300-bar rig carrying 1,000 kg can serve six customers within 200 km, lowering deadhead mileage 20-30% using advanced route optimization. Cylinder packs still appeal to seasonal float-glass and specialty-welding shops, yet five-year hydrostatic tests under ISO 11114 inflate lifetime costs. In the hydrogen gas market, distribution portfolios therefore balance high-volume pipelines with flexible road logistics until regional demand clusters justify new steel.
Complete Report Scope:
- By Distribution
- Pipeline
- High-pressure tube trailer
- Cylinder
- By Application
- Ammonia
- Methanol
- Refining
- Direct Reduced Iron (DRI)
- Fuel-cell Vehicles (FCVs)
- Other Applications
- By Geography
- Asia-Pacific
- China
- India
- Japan
- South Korea
- ASEAN Countries
- Rest of Asia-Pacific
- North America
- United States
- Canada
- Mexico
- Europe
- Germany
- United Kingdom
- France
- Italy
- Russia
- NORDIC Countries
- Rest of Europe
- South America
- Brazil
- Argentina
- Rest of South America
- Middle East and Africa
- Saudi Arabia
- South Africa
- Rest of Middle East and Africa
- Asia-Pacific
Geography Analysis
Asia-Pacific held 34.23% of the 2025 hydrogen gas market, propelled by China's 1,104 refueling stations, Japan's ammonia-import plans, and South Korea's 6.2 Mt 2040 consumption target. China's provincial grants for 10 MW-plus electrolyzers slashed alkaline stack costs below USD 200 per kW, half the European average, positioning Chinese suppliers for export. India's National Hydrogen Mission commits INR 197 billion (USD 2.4 billion) to produce 5 Mt by 2030, focusing on Gujarat and Odisha corridors with sub-INR 2 kWh solar tariffs. ASEAN pilots in Thailand, Singapore, and Malaysia test grid blending and coal-plant ammonia co-firing while awaiting carbon-pricing clarity.
The Middle East and Africa are expected to record the fastest 4.12% CAGR during the forecast period (2026-2031). Projects in Saudi Arabia, UAE, Oman, and Egypt couple 30-40% capacity-factor solar with desalination, reaching projected costs of USD 1.50-2.00 per kg by 2030. The NEOM venture will ship 650 t-per-day hydrogen as ammonia from late 2026, while South Africa's Boegoebaai targets 400,000 t green-ammonia from 2028 despite desalination add-ons of USD 0.30-0.50 per kg.
In North America, the US Department of Energy funded seven regional hubs, each producing 50,000-100,000 t annually for refining, fertilizer, and transport. Canada pursues blue hydrogen with carbon capture in Alberta and green hydrogen via hydropower in Quebec, eyeing EU exports once carbon-border levies finalize. Europe repurposes legacy gas grids; Germany allows 20% blends in select segments, the UK plans a 100% hydrogen village, and France backs a 200 MW Dunkirk electrolyzer supplying ArcelorMittal's DRI pilot. South American ambitions concentrate in Chile's high-wind Magallanes and Brazil's Pecem port, although grid-tie delays push several final decisions into 2026. Collectively, diversified regional pipelines, hub programs, and export projects underpin the hydrogen gas market's global expansion.
- Aditya Birla Chemicals
- Air Liquide
- Air Products and Chemicals, Inc.
- BASF SE
- Equinor ASA
- Gulf Cryo
- Iwatani Corp.
- Kawasaki Heavy Industries, Ltd.
- Linde plc
- MATHESON Tri-Gas, Inc.
- Messer SE & Co. KGaA
- TAIYO NIPPON SANSO CORPORATION
Additional Benefits:
- The market estimate (ME) sheet in Excel format
- 3 months of analyst support
TABLE OF CONTENTS
1 Introduction
- 1.1 Study Assumptions and Market Definition
- 1.2 Scope of the Study
2 Research Methodology
3 Executive Summary
4 Market Landscape
- 4.1 Market Overview
- 4.2 Market Drivers
- 4.2.1 Refinery Desulfurization Regulations
- 4.2.2 Government Incentives for Green H2
- 4.2.3 Rising Fuel-Cell Vehicle Roll-out
- 4.2.4 Hydrogen-Gas-Grid Blending Mandates
- 4.2.5 Surplus-Renewables-Driven Power-to-Gas Economics
- 4.3 Market Restraints
- 4.3.1 Expensive Storage and Transport Logistics
- 4.3.2 Community Opposition to New H2 Pipelines
- 4.3.3 Water-Scarcity Constraints in Arid Regions
- 4.4 Value Chain Analysis
- 4.5 Porter's Five Forces
- 4.5.1 Bargaining Power of Suppliers
- 4.5.2 Bargaining Power of Buyers
- 4.5.3 Threat of New Entrants
- 4.5.4 Threat of Substitutes
- 4.5.5 Competitive Rivalry
5 Market Size and Growth Forecasts (Volume)
- 5.1 By Distribution
- 5.1.1 Pipeline
- 5.1.2 High-pressure tube trailer
- 5.1.3 Cylinder
- 5.2 By Application
- 5.2.1 Ammonia
- 5.2.2 Methanol
- 5.2.3 Refining
- 5.2.4 Direct Reduced Iron (DRI)
- 5.2.5 Fuel-cell Vehicles (FCVs)
- 5.2.6 Other Applications
- 5.3 By Geography
- 5.3.1 Asia-Pacific
- 5.3.1.1 China
- 5.3.1.2 India
- 5.3.1.3 Japan
- 5.3.1.4 South Korea
- 5.3.1.5 ASEAN Countries
- 5.3.1.6 Rest of Asia-Pacific
- 5.3.2 North America
- 5.3.2.1 United States
- 5.3.2.2 Canada
- 5.3.2.3 Mexico
- 5.3.3 Europe
- 5.3.3.1 Germany
- 5.3.3.2 United Kingdom
- 5.3.3.3 France
- 5.3.3.4 Italy
- 5.3.3.5 Russia
- 5.3.3.6 NORDIC Countries
- 5.3.3.7 Rest of Europe
- 5.3.4 South America
- 5.3.4.1 Brazil
- 5.3.4.2 Argentina
- 5.3.4.3 Rest of South America
- 5.3.5 Middle East and Africa
- 5.3.5.1 Saudi Arabia
- 5.3.5.2 South Africa
- 5.3.5.3 Rest of Middle East and Africa
- 5.3.1 Asia-Pacific
6 Competitive Landscape
- 6.1 Market Concentration
- 6.2 Strategic Moves
- 6.3 Market Share(%)/Ranking Analysis
- 6.4 Company Profiles (includes Global Overview, Market Overview, Core Segments, Financials, Strategic Information, Products and Services, Recent Developments)
- 6.4.1 Aditya Birla Chemicals
- 6.4.2 Air Liquide
- 6.4.3 Air Products and Chemicals, Inc.
- 6.4.4 BASF SE
- 6.4.5 Equinor ASA
- 6.4.6 Gulf Cryo
- 6.4.7 Iwatani Corp.
- 6.4.8 Kawasaki Heavy Industries, Ltd.
- 6.4.9 Linde plc
- 6.4.10 MATHESON Tri-Gas, Inc.
- 6.4.11 Messer SE & Co. KGaA
- 6.4.12 TAIYO NIPPON SANSO CORPORATION
7 Market Opportunities and Future Outlook
- 7.1 White-space and Unmet-need Assessment

 氣化市場:全球市場預測,2026-2032年電能轉氣市場:2026-2032年全球市場預測(依技術、氣體產品類型、產能、系統組件及應用分類)
 電轉氣(PtG)市場預測至2034年:按產品、原料、技術、最終用戶和地區分類的全球分析
 電能轉氣市場:依技術、產品、最終用戶和地區分類
 P2G(電轉氣)市場規模:依技術、容量、用例、應用、地區分類,2026-2034 年
 2026年全球P2H2(電制氫)市場報告
 氣化市場規模、佔有率、成長及全球產業分析:按類型、應用和地區的洞察,2026-2034年的預測全球Power-to-X市場:市場規模、佔有率、成長率、產業分析、依類型、應用和地區劃分的考察以及未來預測(2026-2034)
 電能轉氣市場機會、成長要素、產業趨勢分析及預測(2026年至2035年)
 氣化市場-全球產業規模、佔有率、趨勢、機會、預測:依原料、應用、區域和競爭格局分類,2021-2031年