


 |
市場調查報告書
商品編碼
1936653
電能轉氣市場機會、成長要素、產業趨勢分析及預測(2026年至2035年)Power to Gas Market Opportunity, Growth Drivers, Industry Trend Analysis, and Forecast 2026 - 2035 |
||||||
全球電能轉氣市場預計到 2025 年將價值 4,260 萬美元,到 2035 年達到 7,880 萬美元,年複合成長率為 6.2%。
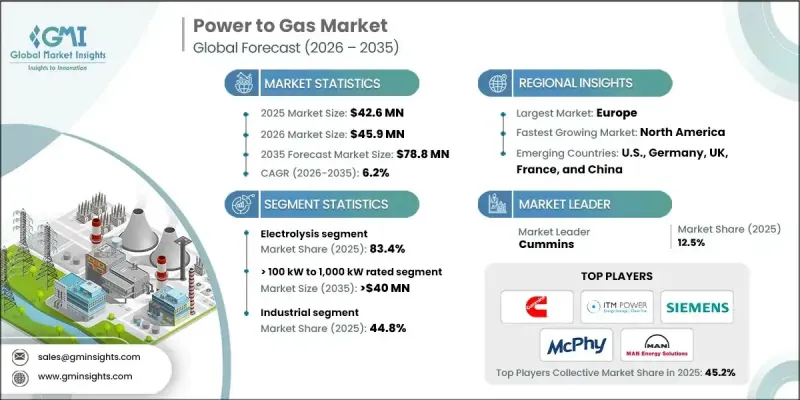
這一成長得益於可再生能源發電的快速成長以及可變電源日益融入國家電網。隨著能源系統的演進,電能轉氣技術日益被視為平衡供給與需求的關鍵手段。先進的數位預測工具、智慧電力調節系統和即時電解控制技術正在提升系統的效率和可靠性。電能轉氣技術將剩餘電力轉化為氣態能源載體,用於長期儲存、併網以及跨產業應用。將氫氣混合標準與公用事業公司的脫碳策略相協調,將有助於加速基礎設施建設並改善各行業的耦合。同時,碳捕獲整合和甲烷化製程擴充性的進步正在推動碳循環路徑的構建,並提升合成氣解決方案的商業性可行性。需求成長的促進因素包括減少發電棄風、應對間歇性、工業電氣化以及對低碳原料的需求,而電能轉氣應用範圍的擴大則得益於熱力系統維修和工業燃料轉化需求的增加。
| 市場覆蓋範圍 | |
|---|---|
| 開始年份 | 2025 |
| 預測年份 | 2026-2035 |
| 起始值 | 4260萬美元 |
| 預測金額 | 7880萬美元 |
| 複合年成長率 | 6.2% |
到2025年,基於電解電能轉氣技術將佔據83.4%的市場佔有率,這反映了其在當前部署策略中的核心地位。再生能源可用性的提高和剩餘發電量的增加正在加速電解的部署。對綠色氫能發展的堅定承諾和國家脫碳目標正在推動先進電解平台的廣泛應用。同時,再生能源成本的下降和電解效率的持續提升提高了電解電能轉氣解決方案的經濟可行性,並增強了其長期發展前景。
預計到2025年,額定功率在100kW至1000kW之間的系統將佔據54.3%的市場佔有率,到2035年市場佔有率將達到4000萬美元。這一容量範圍與商業和工業領域的能源整合計劃高度契合,尤其是在現場可再生能源發電不斷擴展的情況下。尋求低碳能源來源以實現排放目標的機構正擴大採用中等規模的電能轉氣系統。區域能源供應和清潔供熱策略對氫氣日益成長的需求,也進一步推動了該電力領域裝置容量的成長。
預計到2025年,美國電能轉氣市場將佔據74.9%的市場佔有率,市場規模將達到750萬美元。該國市場擴張的驅動力主要來自可再生能源發電能力的快速成長以及緩解能源緊張的需求。對清潔氫能發展和脫碳政策的支持正在推動對電解槽基礎設施的投資。可再生能源樞紐的廣泛部署和日益成長的電網平衡需求進一步加速了電能轉氣技術在美國能源領域的整合。
目錄
第1章調查方法和範圍
第2章執行摘要
第3章業界考察
- 生態系分析
- 原物料供應及採購分析
- 製造能力評估
- 供應鏈韌性與風險因素
- 配電網路分析
- 監管環境
- 產業影響因素
- 促進要素
- 產業潛在風險與挑戰
- 成長潛力分析
- 波特五力分析
- PESTEL 分析
- 電力製氣轉換成本結構分析
- 價格趨勢分析
- 透過技術
- 按地區
- 新的機會與趨勢
- 數位化和物聯網整合
第4章 競爭情勢
- 介紹
- 按地區分類的公司市佔率分析
- 北美洲
- 歐洲
- 亞太地區
- 戰略儀錶板
- Key partnerships &collaborations
- Major M&A activities
- Product innovations &launches
- Market expansion strategies
- 策略舉措
- 競爭標竿分析
- 創新與科技趨勢
第5章 依技術分類的市場規模及預測(2022-2035年)
- 電解
- 甲烷化
第6章 依產能分類的市場規模及預測(2022-2035年)
- 功率≤100千瓦
- 100千瓦至1000千瓦
- 超過1000千瓦
第7章 依應用領域分類的市場規模及預測(2022-2035年)
- 商業的
- 公共產業
- 工業的
第8章 2022-2035年各地區市場規模及預測
- 北美洲
- 美國
- 加拿大
- 歐洲
- 德國
- 英國
- 法國
- 丹麥
- 荷蘭
- 瑞士
- 亞太地區
- 中國
- 日本
- 澳洲
第9章:公司簡介
- AquaHydrex
- Baker Hughes
- Cummins
- Electrochaea
- Engie
- GRTgaz
- Hitachi Zosen Inova Schmack
- ITM Power
- John Cockerill
- Kanadevia Inova
- Krajete
- KROHNE
- Linde
- MAN Energy Solutions
- McPhy Energy
- NEL
- Phoenix Contact
- Power-to-Gas Hungary
- Ren-Gas
- Siemens
- Terega
- Thyssenkrupp
The Global Power to Gas Market was valued at USD 42.6 million in 2025 and is estimated to grow at a CAGR of 6.2% to reach USD 78.8 million by 2035.
Growth is supported by the rapid increase in renewable electricity generation and the growing integration of variable power sources into national grids. As energy systems evolve, power to gas solutions are increasingly viewed as a critical mechanism for balancing supply and demand. Advanced digital forecasting tools, intelligent dispatch systems, and real-time electrolyzer control technologies are strengthening system efficiency and reliability. Power to gas technology enables the conversion of surplus electricity into gaseous energy carriers, allowing long-term storage, grid injection, and cross-sector utilization. Alignment between utility decarbonization strategies and hydrogen blending standards accelerate infrastructure readiness and improving sector coupling. In parallel, advancements in carbon capture integration and methanation scalability are enabling circular carbon pathways, enhancing the commercial viability of synthetic gas solutions. Growing emphasis on curtailment reduction, intermittency management, industrial electrification, and low-carbon feedstock requirements is reinforcing demand, while expanding thermal system retrofitting and industrial fuel switching are broadening the application scope of power to gas systems.
| Market Scope | |
|---|---|
| Start Year | 2025 |
| Forecast Year | 2026-2035 |
| Start Value | $42.6 Million |
| Forecast Value | $78.8 Million |
| CAGR | 6.2% |
The electrolysis-based power to gas technologies segment accounted for 83.4% share in 2025, reflecting its central role in current deployment strategies. Increasing availability of renewable electricity and higher volumes of surplus generation are accelerating electrolyzer installations. Strong commitments to green hydrogen development and national decarbonization objectives are supporting wider adoption of advanced electrolysis platforms. At the same time, declining renewable power costs and ongoing improvements in electrolyzer efficiency are enhancing economic feasibility, strengthening the long-term outlook for electrolysis-driven power to gas solutions.
The systems rated between greater than 100 kW and 1,000 kW represented 54.3% share in 2025 and are expected to reach USD 40 million by 2035. This capacity range aligns well with commercial and industrial energy integration programs, particularly where on-site renewable generation is expanding. Organizations seeking low-carbon energy inputs to meet emissions reduction commitments are increasingly deploying mid-scale power to gas systems. Rising hydrogen demand for localized energy distribution and clean heating strategies is further supporting the growth of installations within this power segment.
United States Power to Gas Market held 74.9% share, generating USD 7.5 million in 2025. Market expansion in the country is being driven by the rapid growth of renewable power capacity and the need to mitigate energy curtailment. Policy support for clean hydrogen development and decarbonization mandates is encouraging investment in electrolyzer-based infrastructure. Broader deployment of renewable energy hubs and increasing grid-balancing requirements are further accelerating integration of power to gas technologies across the U.S. energy landscape.
Key companies operating in the Global Power to Gas Market include Siemens Energy, Linde, Baker Hughes, Cummins, Thyssenkrupp, NEL, ITM Power, McPhy Energy, MAN Energy Solutions, Engie, John Cockerill, Kanadevia Inova, Hitachi Zosen Inova Schmack, Electrochaea, Phoenix Contact, GRTgaz, Terega, Ren-Gas, AquaHydrex, KROHNE, Krajete, and Power-to-Gas Hungary. Companies active in the power to gas market are strengthening their competitive position through technology advancement, strategic partnerships, and system optimization. Leading players are investing in higher-efficiency electrolyzers, modular system designs, and digital control platforms to improve performance and scalability. Collaboration with utilities, industrial customers, and infrastructure operators is enabling faster deployment and smoother grid integration. Many companies are expanding solution portfolios to support both hydrogen and synthetic gas pathways, enhancing flexibility across end-use applications.
Table of Contents
Chapter 1 Methodology & Scope
- 1.1 Research approach
- 1.2 Quality commitments
- 1.2.1 GMI AI policy & data integrity commitment
- 1.2.1.1 Source consistency protocol
- 1.2.1 GMI AI policy & data integrity commitment
- 1.3 Research trail & confidence scoring
- 1.3.1 Research trail components
- 1.3.2 Scoring components
- 1.4 Data collection
- 1.4.1 Partial list of primary sources
- 1.5 Data mining sources
- 1.5.1 Paid sources
- 1.5.1.1 Sources, by region
- 1.5.1 Paid sources
- 1.6 Base estimates and calculations
- 1.6.1 Base year calculation for any one approach
- 1.7 Market estimates & forecasts parameters
- 1.8 Forecast model
- 1.8.1 Quantified market impact analysis
- 1.8.1.1 Mathematical impact of growth parameters on forecast
- 1.8.1 Quantified market impact analysis
- 1.9 Research transparency addendum
- 1.9.1 Source attribution framework
- 1.9.2 Quality assurance metrics
- 1.9.3 Our commitment to trust
- 1.10 Market definitions
Chapter 2 Executive Summary
- 2.1 Industry synopsis, 2022 - 2035
- 2.2 Business trends
- 2.3 Technology trends
- 2.4 Capacity trends
- 2.5 Application trends
- 2.6 Regional trends
Chapter 3 Industry Insights
- 3.1 Industry ecosystem analysis
- 3.1.1 Raw material availability & sourcing analysis
- 3.1.2 Manufacturing capacity assessment
- 3.1.3 Supply chain resilience & risk factors
- 3.1.4 Distribution network analysis
- 3.2 Regulatory landscape
- 3.3 Industry impact forces
- 3.3.1 Growth drivers
- 3.3.2 Industry pitfalls & challenges
- 3.4 Growth potential analysis
- 3.5 Porter's analysis
- 3.5.1 Bargaining power of suppliers
- 3.5.2 Bargaining power of buyers
- 3.5.3 Threat of new entrants
- 3.5.4 Threat of substitutes
- 3.6 PESTEL analysis
- 3.6.1 Political factors
- 3.6.2 Economic factors
- 3.6.3 Social factors
- 3.6.4 Technological factors
- 3.6.5 Legal factors
- 3.6.6 Environmental factors
- 3.7 Cost structure analysis of power to gas
- 3.8 Price trend analysis
- 3.8.1 By technology
- 3.8.2 By region
- 3.9 Emerging opportunities & trends
- 3.10 Digitalization and IoT integration
Chapter 4 Competitive Landscape, 2026
- 4.1 Introduction
- 4.2 Company market share analysis, by region, 2025
- 4.2.1 North America
- 4.2.2 Europe
- 4.2.3 Asia Pacific
- 4.3 Strategic dashboard
- 4.3.1 Key partnerships & collaborations
- 4.3.2 Major M&A activities
- 4.3.3 Product innovations & launches
- 4.3.4 Market expansion strategies
- 4.4 Strategic initiatives
- 4.5 Competitive benchmarking
- 4.6 Innovation & technology landscape
Chapter 5 Market Size and Forecast, By Technology, 2022 - 2035 (USD Million & kW)
- 5.1 Key trends
- 5.2 Electrolysis
- 5.3 Methanation
Chapter 6 Market Size and Forecast, By Capacity, 2022 - 2035 (USD Million & kW)
- 6.1 Key trends
- 6.2 ≤ 100 kW
- 6.3 > 100 kW to 1,000 kW
- 6.4 > 1,000 kW
Chapter 7 Market Size and Forecast, By Application, 2022 - 2035 (USD Million & kW)
- 7.1 Key trends
- 7.2 Commercial
- 7.3 Utility
- 7.4 Industrial
Chapter 8 Market Size and Forecast, By Region, 2022 - 2035 (USD Million & kW)
- 8.1 Key trends
- 8.2 North America
- 8.2.1 U.S.
- 8.2.2 Canada
- 8.3 Europe
- 8.3.1 Germany
- 8.3.2 UK
- 8.3.3 France
- 8.3.4 Denmark
- 8.3.5 Netherlands
- 8.3.6 Switzerland
- 8.4 Asia Pacific
- 8.4.1 China
- 8.4.2 Japan
- 8.4.3 Australia
Chapter 9 Company Profiles
- 9.1 AquaHydrex
- 9.2 Baker Hughes
- 9.3 Cummins
- 9.4 Electrochaea
- 9.5 Engie
- 9.6 GRTgaz
- 9.7 Hitachi Zosen Inova Schmack
- 9.8 ITM Power
- 9.9 John Cockerill
- 9.10 Kanadevia Inova
- 9.11 Krajete
- 9.12 KROHNE
- 9.13 Linde
- 9.14 MAN Energy Solutions
- 9.15 McPhy Energy
- 9.16 NEL
- 9.17 Phoenix Contact
- 9.18 Power-to-Gas Hungary
- 9.19 Ren-Gas
- 9.20 Siemens
- 9.21 Terega
- 9.22 Thyssenkrupp
 電能轉氣市場:2026-2032年全球市場預測(依技術、氣體產品類型、產能、系統組件及應用分類)
 電轉氣(PtG)市場預測至2034年:按產品、原料、技術、最終用戶和地區分類的全球分析
 電能轉氣市場:依技術、產品、最終用戶和地區分類氣化市場:氣化設備類型、原料類型、技術、計劃產能與最終用途-2026-2032年全球市場預測
 P2G(電轉氣)市場規模:依技術、容量、用例、應用、地區分類,2026-2034 年
 2026年全球P2H2(電制氫)市場報告
 氣化市場規模、佔有率、成長及全球產業分析:按類型、應用和地區的洞察,2026-2034年的預測全球Power-to-X市場:市場規模、佔有率、成長率、產業分析、依類型、應用和地區劃分的考察以及未來預測(2026-2034)
 氣化市場-全球產業規模、佔有率、趨勢、機會、預測:依原料、應用、區域和競爭格局分類,2021-2031年電轉氣市場-全球產業規模、佔有率、趨勢、機會和預測:按技術、產能、最終用戶、地區和競爭格局分類,2021-2031年