


 |
市場調查報告書
商品編碼
2122907
Gigabit乙太網路測試設備:市場佔有率分析、產業趨勢與統計、成長預測(2026-2031)Gigabit Ethernet Test Equipment - Market Share Analysis, Industry Trends & Statistics, Growth Forecasts (2026 - 2031) |
||||||

※ 本網頁內容可能與最新版本有所差異。詳細情況請與我們聯繫。
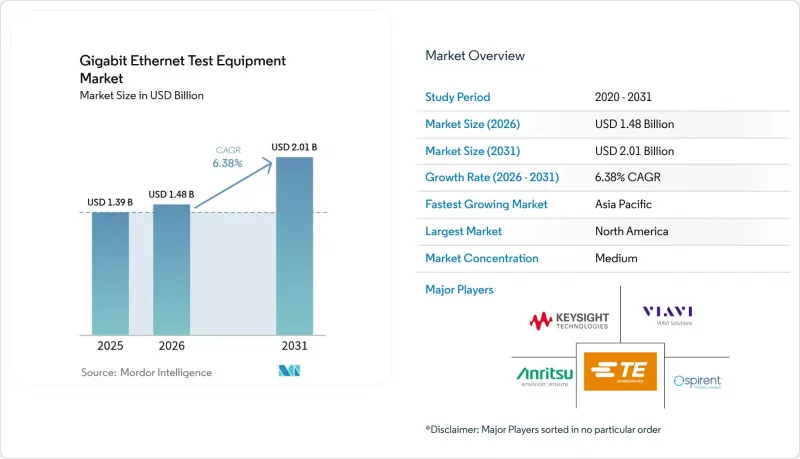
根據 Mordor Intelligence 預測,Gigabit乙太網路測試設備市場將從 2025 年的 13.9 億美元成長到 2026 年的 14.8 億美元,到 2031 年將達到 20.1 億美元,2026 年至 2031 年的複合年成長率為 6.38%。
[1] Spirent Communications,《2024-2026 年高速乙太網路展望》,spirent.com。人工智慧 (AI) 工作負載的日益普及正在推動人們對頻寬預期進行重新評估,迫使檢驗團隊超越 400G,採用新興的 800G 和 1.6T 標準。本報告按類型(1GbE、10GbE、其他)、最終用戶產業(電訊、資料中心和雲端、其他)、應用程式(研發實驗室、製造和生產、其他)、測試類型(功能測試和流量產生、效能和負載、合規性和適用性、其他)以及地區進行分類。
全球Gigabit乙太網路測試設備市場趨勢與洞察
AI集群基礎設施正在推動對800G測試的需求。
主要亮點
- 人工智慧 (AI) 訓練正將頻寬需求推向超越傳統 400G 的水平,迫使營運商部署 800G 和 1.6T 鏈路,這需要新的檢驗策略。目前的叢集每個 xPU 需要 1Tbps 的頻寬,這對從 NRZ 調變過渡到 PAM4 調變的 SerDes 設計構成了巨大壓力。因此,訊號雜訊比 (SNR) 分析需要極高的精度。供應商現在將高速示波器和自動去嵌入軟體捆綁在一起,使工程師能夠在幾分鐘內(而不是幾天)表徵小於 10ps 的時間間隔。超乙太網路聯盟 (Ultra Ethernet Consortium) 正在最終確定 v1.0 規範,該規範超越了 IEEE 802.3 標準,並增加了傳統乙太網路中沒有的擁塞管理測試。提供 1.6T 能力的領先公司正在與渴望確保 AI 架構未來發展的超大規模超大規模資料中心業者簽訂多年框架協議。這些項目將加速那些能夠將光纖通訊、流量產生和分析整合到單一編配層的公司的收入成長。
雲端服務的擴展正在加速多速測試。
雲端服務供應商正在部署 100G、400G 和 800G 的混合拓撲結構,以平衡波動工作負載下的效能和成本,這催生了對能夠同時檢驗多種速率的測試平台的需求。前向糾錯 (FEC),尤其是 RS-FEC,在這些速率範圍內至關重要,這就要求解決方案能夠即時監控奇偶校驗區塊,同時避免掩蓋潛在缺陷。模擬引擎現在可以重現數天的流量日誌,並模擬微突發擁塞,同時保持亞微秒的延遲指標。電信業者正在尋求能夠與 CI/CD 工具鏈整合的可程式設計API,以便對網路升級進行日常回歸測試。這推動了對虛擬化測試實驗室的需求,這些實驗室能夠在提供確定性效能基準的同時,降低硬體資本支出 (Capex)。
技術專家短缺限制了市場擴張。
從NRZ遷移到PAM4需要精通偏斜校正、符號誤差繪圖和224Gbps頻道建模的工程師,而這些技能在全球勞動市場仍然十分稀缺。儘管許多服務供應商依賴自動化演算法來分析眼圖高度和抖動預算,但解決複雜的故障仍然需要人工洞察。 「連接前檢查」等光纖檢測宣傳活動表明,技能的匱乏正在推高安裝錯誤率。培訓基礎設施落後於技術藍圖,迫使供應商引入人工智慧驅動的嚮導程序,以最少的使用者輸入配置儀器。然而,PAM4串擾、偏斜和FEC裕量的故障排除仍需要人工操作,專案進度仍容易受到人才短缺的影響。
細分市場分析
預計到2025年,10GbE產品將維持Gigabit測試設備市場41.30%的佔有率,凸顯其在企業交換骨幹網路中的強大地位。同時,預計到2031年,800GbE和1.6TbE測試設備將以20.10%的複合年成長率成長,成為所有速度等級中成長最快的。這一成長主要由人工智慧叢集架構驅動,這些架構需要每通道224Gbps的線速檢驗。 Keysight的AresONE平台能夠傳輸6.4Tbps的測試流量,Keysight表示,這一飛躍預計將使Gigabit測試設備市場中的超高速設備市場規模在2031年達到5.483億美元。同時,25/40/50GbE和100GbE正逐漸成為經濟高效的遷移方案,尤其是在傳統光纖通訊生態系統降低遷移風險的情況下。像 Marvell 這樣的半導體供應商正在加速這一轉變,他們開始提供 3nm PAM4 DSP 樣品,這些樣品可將模組功耗降低 20%,並提高高密度底盤內的散熱能力。
買家正在權衡升級時機與標準的成熟度。由於其成熟的RS-FEC特性,400GbE仍然是那些旨在快速獲得投資回報的專案的首選。相較之下,正在評估1.6T架構的工程實驗室則訂購混合速度底盤,將800G刀片伺服器組合起來以滿足當前需求,同時預留空置機箱以備將來添加1.6T插件模組。這種柔軟性既能穩定資本規劃,又能保護早期採用者免受過時的影響。隨著超大規模資料中心業者以6個月為週期進行網路升級,提供現場可升級硬體和永久授權軟體的供應商正在確保持續的收入來源。這種轉變正在縮短產品生命週期,競爭的焦點也從硬體組件成本轉向可程式設計功能交付的速度。
隨著5G回程傳輸的部署,預計到2025年,電信業將佔總收入的36.05%,而資料中心和雲端服務供應商到2031年將以17.25%的複合年成長率成長,並預計在2027年超過電信業者的絕對支出。人工智慧工作負載密度的不斷增加要求資料中心同時檢驗無損資料包噴射、亞微秒級抖動和RoCEv2擁塞控制,所有這些指標都超過了傳統電信業者的要求。汽車和交通運輸原始設備製造商(OEM)正在加速乙太網路合規性,以支援駕駛輔助和自動駕駛協議棧,這催生了對能夠表徵10GBASE-T1的強大示波器和電磁干擾測試室的需求。
同時,製造業企業正加速在危險區域試行部署乙太網路APL,這需要本質安全型測試儀,同時也要具備電源迴路分析儀的功能。航太和國防(A&D)領域的系統整合商需要能夠承受振動、極端溫度和電磁脈衝的設備,這迫使供應商採用軍用級機殼。在公共產業和醫療保健領域,確定性故障安全協議是強制性的,這就要求測試計劃能夠檢驗零損耗保護切換和網路安全韌體。這些跨產業的細微差別迫使供應商提供模組化平台,並可根據需求整合行業特定的合規性封裝。這種策略既能滿足各種監管法規結構的要求,也能降低研發成本。
區域分析
北美地區佔總銷售額的32.70%,這主要得益於半導體研發的集中以及人工智慧叢集的快速部署,後者以前所未有的速度推動了800G認證的普及。雖然美國雲端服務供應商佔據了訂單的大部分,但隨著寬頻的復興和工業乙太網的升級,加拿大市場的需求也在不斷成長。墨西哥正利用近岸外包的趨勢擴大汽車線束的製造,從而提振了對T1合規套件的需求。部分州的低能源成本吸引了新建設,而800G設備的高電力消耗量可能會引發永續性審計,並影響採購週期。
亞太地區正以10.05%的複合年成長率引領成長,這主要得益於中國超大規模資料中心的擴張以及本地化的1.6T光纖通訊供應鏈。在日本汽車產業,需要嚴格電磁相容性(EMC)檢驗的確定性乙太網路協定堆疊正逐漸成為主流;而在韓國,半導體晶圓廠正向3nm製程邁進,對超高速抖動和串擾檢測設備的需求日益成長。在東協,5G回程傳輸和智慧工廠的試點部署正在穩步推進,訂單。在印度,政策獎勵正在促進通訊設備的製造和軟體定義網路(SDN)實驗室的建設,但基礎設施發展不平衡和熟練人員短缺限制了短期內SDN技術的普及應用。
預計歐洲市場將保持穩定成長,德國汽車製造商正在正式製定汽車乙太網路測試計劃,工業領域的營運商也在流程工廠中採用乙太網路APL技術。在英國,光纖骨幹網路的現代化改造正在推動對攜帶式光時域反射儀(OTDR)和誤碼率測試儀(BERT)的需求。法國和西班牙正在投資升級可再生能源電網,這需要對變電站進行確定性乙太網路測試。在中東,石油收入正被用於在沿岸地區建造新的資料中心。同時,非洲礦業公司正在部署適用於惡劣環境的PoE測試儀。南美洲市場呈現緩慢但穩定的成長,主要得益於巴西通訊網路的升級改造以及阿根廷汽車線束的出口。
其他好處
- Excel格式的市場預測(ME)表
- 3個月的分析師支持
目錄
第1章:引言
- 研究假設和市場定義
- 調查範圍
第2章:調查方法
第3章執行摘要
第4章 市場狀況
- 市場概覽
- 市場促進因素
- 行動回程的成長
- 雲端服務與巨量資料簡介
- 乙太網路在製造業的應用日益廣泛
- 在傳統佈線中升級到 2.5/5GbE
- AI叢集對800G/1.6T測試的需求
- 使用 RoCEv2檢驗超低延遲
- 市場限制因素
- 缺乏技術專長
- 複雜測量精度的局限性
- 800G鑽機的功率和散熱限制
- PAM-4光學元件供應鏈瓶頸
- 價值鏈分析
- 監理情勢
- 技術展望
- 波特五力分析
第5章 市場規模與成長預測
- 按類型
- 1GbE
- 10GbE
- 25/40/50GbE
- 100GbE
- 400GbE
- 800GbE,1.6TbE
- 按最終用戶行業分類
- 電訊
- 資料中心雲
- 製造業
- 汽車和交通運輸
- 航太/國防
- 其他(公共產業、醫療保健)
- 透過使用
- 研發實驗室
- 製造和生產
- 現場服務和安裝
- 身份驗證和合規性
- 按測試類型
- 功能測試和流量生成
- 效能/負載
- 合規性和適用性
- 網路模擬
- 按地區
- 北美洲
- 美國
- 加拿大
- 墨西哥
- 南美洲
- 巴西
- 阿根廷
- 其他南美國家
- 歐洲
- 德國
- 英國
- 法國
- 義大利
- 西班牙
- 俄羅斯
- 其他歐洲國家
- 亞太地區
- 中國
- 印度
- 日本
- 韓國
- ASEAN
- 其他亞太國家
- 中東和非洲
- 中東
- 沙烏地阿拉伯
- 阿拉伯聯合大公國
- 土耳其
- 其他中東國家
- 非洲
- 南非
- 奈及利亞
- 其他非洲地區
- 中東
- 北美洲
第6章 競爭情勢
- 市場集中度
- 策略趨勢
- 市佔率分析
- 公司簡介
- Keysight Technologies Inc.
- Anritsu Corp.
- VIAVI Solutions Inc.
- Spirent Communications plc
- EXFO Inc.
- Rohde and Schwarz GmbH and Co KG
- Teledyne LeCroy(Xena)
- Yokogawa Test and Measurement
- VeEX Inc.
- GL Communications Inc.
- Trend Networks
- GigaNet Systems
- Xinertel Technology
- Apposite Technologies
- NetScout Systems Inc.
- Te Connectivity Ltd.
- Aquantia(Marvell)
- GAO Tek Inc.
- IDEAL Industries Inc.
- Veryx Technologies
第7章 市場機會與未來展望
According to Mordor Intelligence, the gigabit ethernet test equipment market size is expected to grow from USD 1.39 billion in 2025 to USD 1.48 billion in 2026 and is forecast to reach USD 2.01 billion by 2031 at 6.38% CAGR over 2026-2031.
[1] Spirent Communications, "2024-2026 High-Speed Ethernet Outlook," spirent.com Rising adoption of artificial intelligence workloads is redefining bandwidth expectations, forcing validation teams to move beyond 400G and embrace emerging 800G and 1.6T standards. This report is Segmented by Type (1 GbE, 10 GbE, and More), End-User Industry (Telecommunications, Data Centers and Cloud, and More), Application (R&D/Lab, Manufacturing/Production, and More), Test Type (Functional / Traffic Generation, Performance / Stress, Compliance / Conformance, and More), and Geography.
Global Gigabit Ethernet Test Equipment Market Trends and Insights
AI Cluster Infrastructure Drives 800G Testing Demand
Key Highlights
- Artificial intelligence training pushes bandwidth requirements beyond conventional 400G, compelling operators to adopt 800G and 1.6T links that demand fresh validation strategies. Current clusters need 1 Tbps per xPU, stressing SerDes designs that shift from NRZ to PAM4 modulation, which in turn mandates eye-opening precision for signal-to-noise ratio analysis. Vendors now bundle high-speed oscilloscopes with automated de-embedding software so engineers can characterize sub-10-ps unit intervals in minutes rather than days. The Ultra Ethernet Consortium is finalizing v1.0 specifications that extend beyond IEEE 802.3, adding congestion management tests never seen in legacy Ethernet. Early movers that deliver 1.6T capability are winning multi-year framework deals with hyperscalers eager to future-proof AI fabrics. These projects accelerate revenue for companies able to link optics, traffic generation, and analytics into a single orchestration layer.
Cloud Services Expansion Accelerates Multi-Speed Testing
Cloud providers deploy mixed 100G, 400G, and 800G topologies to balance performance and cost across variable workloads, creating a need for test rigs that validate several speeds concurrently. Forward error correction, particularly RS-FEC, is essential at those rates, so solutions must monitor real-time parity blocks without masking latent defects. Emulation engines now replay days of traffic logs to reproduce microburst congestion while maintaining sub-microsecond latency metrics. Operators request programmable APIs that integrate with CI/CD toolchains, enabling daily regression of network upgrades. The result is rising demand for virtualized test labs that cut hardware capex yet still provide deterministic performance baselines.
Technical Expertise Shortage Constrains Market Expansion
Moving from NRZ to PAM4 demands engineers competent in de-skewing, symbol error plotting, and 224 Gbps channel modeling, skills still rare across global labor pools. Many service providers rely on automated algorithms to interpret eye height and jitter budgets, yet complex failures still need human insight. Fiber inspection campaigns such as "Inspect Before You Connect" show how deficit skills inflate installation error rates. Training pipelines lag behind technology roadmaps, compelling vendors to embed AI-driven wizards that configure instruments based on minimal user input. Nevertheless, advanced troubleshooting of PAM4 crosstalk, skew, and FEC margin remains a manual discipline, keeping project timelines vulnerable to talent shortages.
Other drivers and restraints analyzed in the detailed report include:
- Manufacturing Ethernet Adoption Creates Industrial Testing Opportunities
- Legacy Infrastructure Upgrades Drive Multi-Gigabit Testing
- Measurement Accuracy Limitations Impede High-Speed Validation
For complete list of drivers and restraints, kindly check the Table Of Contents.
Segment Analysis
The 10 GbE category retained 41.30% of the Gigabit Ethernet test equipment market share in 2025, underscoring its entrenched presence in enterprise switching backbones. Yet 800 GbE and 1.6 TbE rigs are set to grow at 20.10% CAGR to 2031, the fastest pace of any speed grade, fueled by AI cluster architectures that need line-rate validation at 224 Gbps per lane. Keysight's AresONE platform streams 6.4 Tbps of test traffic, marking a leap that positions the Gigabit Ethernet test equipment market size for ultra-high-speed gear at USD 548.3 million by 2031, according to Keysight. Meanwhile 25/40/50 GbE and 100 GbE serve as cost-efficient stepping-stones, especially where legacy optics ecosystems lower migration risk. Semiconductor vendors such as Marvell accelerate the shift by sampling 3 nm PAM4 DSPs that drop module power by 20%, extending cooling envelopes inside dense chassis.
Buyers weigh upgrade timing against standards maturity. 400 GbE enjoys mature RS-FEC profiles, so projects chasing rapid returns still favor it. Conversely, engineering labs evaluating 1.6 T are ordering mixed-speed chassis that combine 800 G blades for immediate needs and empty cages ready for future 1.6 T pluggables. This flexibility stabilizes capital planning while protecting early adopters from obsolescence. As hyperscalers roll out fabric upgrades in six-month sprints, vendors that ship field-upgradeable hardware and perpetual software licenses gain recurring revenue streams. The transition compresses product lifecycles, shifting competitive focus from hardware bill-of-materials to programmable feature velocity.
Telecommunications captured 36.05% of 2025 revenue due to 5G backhaul rollouts, yet data centers and cloud providers are expanding at an 17.25% CAGR to 2031, overtaking telcos in absolute spending by 2027. AI workload density drives data centers to validate lossless packet spraying, sub-microsecond jitter, and RoCEv2 congestion control concurrently, all of which exceed traditional telco metrics. Automotive and transport OEMs ramp Ethernet compliance to support driver assistance and autonomous stacks, creating demand for rugged oscilloscopes and EMI chambers capable of 10GBASE-T1 characterization.
Meanwhile, manufacturing outfits accelerate Ethernet-APL pilots within hazardous zones, requiring intrinsically safe testers that double as power loop analyzers. A&D integrators need equipment that withstands vibration, temperature extremes, and electromagnetic pulse, compelling suppliers to adapt military-grade enclosures. Utilities and healthcare specify deterministic fail-safe protocols, pushing test plans to verify zero-loss protection switching and cyber-hardened firmware. These cross-sector nuances pressure vendors to offer modular platforms that slot vertical-specific compliance packages on demand, a strategy that tempers R&D overhead while addressing divergent regulatory frameworks.
Complete Report Scope:
- By Type
- 1 GbE
- 10 GbE
- 25/40/50 GbE
- 100 GbE
- 400 GbE
- 800 GbE and 1.6 TbE
- By End-user Industry
- Telecommunications
- Data Centers and Cloud
- Manufacturing
- Automotive and Transport
- Aerospace and Defense
- Others (Utilities, Healthcare)
- By Application
- RandD/Lab
- Manufacturing/Production
- Field Service and Installation
- Certification and Compliance
- By Test Type
- Functional / Traffic Generation
- Performance / Stress
- Compliance / Conformance
- Network Emulation
- By Geography
- North America
- United States
- Canada
- Mexico
- South America
- Brazil
- Argentina
- Rest of South America
- Europe
- Germany
- United Kingdom
- France
- Italy
- Spain
- Russia
- Rest of Europe
- Asia Pacific
- China
- India
- Japan
- South Korea
- ASEAN
- Rest of Asia Pacific
- Middle East and Africa
- Middle East
- Saudi Arabia
- UAE
- Turkey
- Rest of Middle East
- Africa
- South Africa
- Nigeria
- Rest of Africa
- Middle East
- North America
Geography Analysis
North America holds 32.70% revenue thanks to concentrated semiconductor R&D and aggressive AI cluster deployments that mandate 800G qualification in record time. United States cloud providers anchor most orders, but Canada gains traction through broadband revitalization and industrial Ethernet upgrades. Mexico leverages nearshoring trends to expand automotive harness manufacturing, raising demand for T1 compliance kits. Low energy costs in some states attract additional data center builds, yet the high power draw of 800G rigs prompts sustainability audits that may influence procurement cycles.
Asia Pacific leads growth at 10.05% CAGR on the back of China's hyperscale expansion and localized 1.6 T optics supply chains. Japan's auto sector champions deterministic Ethernet stacks that require stringent EMC validation, while Korea pushes semiconductor fabs into 3 nm class, needing ultra-fast jitter and crosstalk probes. ASEAN states deploy 5G backhaul and smart factory pilots, generating orders for multi-rate handheld analyzers. India's policy incentives spur telco equipment manufacturing and software defined network labs, though patchy infrastructure and a talent shortfall temper near-term adoption.
Europe charts steady gains with German OEMs formalizing in-vehicle Ethernet test plans and industrial operators embracing Ethernet-APL inside process plants. The United Kingdom modernizes fiber backbone networks, fueling demand for portable OTDRs and BERTs. France and Spain invest in renewable energy grid upgrades that require deterministic sub-station Ethernet testing. The Middle East channels oil revenues into greenfield data centers in the Gulf, while African miners commission ruggedized PoE testers for harsh environments. South America remains modest but stable, driven by Brazilian telco upgrades and Argentine automotive wire harness exports.
- Keysight Technologies Inc.
- Anritsu Corp.
- VIAVI Solutions Inc.
- Spirent Communications plc
- EXFO Inc.
- Rohde and Schwarz GmbH and Co KG
- Teledyne LeCroy (Xena)
- Yokogawa Test and Measurement
- VeEX Inc.
- GL Communications Inc.
- Trend Networks
- GigaNet Systems
- Xinertel Technology
- Apposite Technologies
- NetScout Systems Inc.
- Te Connectivity Ltd.
- Aquantia (Marvell)
- GAO Tek Inc.
- IDEAL Industries Inc.
- Veryx Technologies
Additional Benefits:
- The market estimate (ME) sheet in Excel format
- 3 months of analyst support
TABLE OF CONTENTS
1 INTRODUCTION
- 1.1 Study Assumptions and Market Definition
- 1.2 Scope of the Study
2 RESEARCH METHODOLOGY
3 EXECUTIVE SUMMARY
4 MARKET LANDSCAPE
- 4.1 Market Overview
- 4.2 Market Drivers
- 4.2.1 Growth in mobile backhaul
- 4.2.2 Adoption of cloud services and big data
- 4.2.3 Increased Ethernet use in manufacturing
- 4.2.4 2.5 / 5 GbE upgrades on legacy cabling
- 4.2.5 AI cluster demand for 800G/1.6T testing
- 4.2.6 RoCEv2-driven ultra-low-latency validation
- 4.3 Market Restraints
- 4.3.1 Lack of technical expertise
- 4.3.2 Complex measurement accuracy limits
- 4.3.3 Energy and thermal constraints in 800G rigs
- 4.3.4 Supply-chain bottlenecks for PAM-4 optics
- 4.4 Value Chain Analysis
- 4.5 Regulatory Landscape
- 4.6 Technological Outlook
- 4.7 Porter's Five Forces Analysis
- 4.7.1 Bargaining Power of Suppliers
- 4.7.2 Bargaining Power of Buyers
- 4.7.3 Threat of New Entrants
- 4.7.4 Threat of Substitutes
- 4.7.5 Competitive Rivalry
5 MARKET SIZE AND GROWTH FORECASTS (VALUE)
- 5.1 By Type
- 5.1.1 1 GbE
- 5.1.2 10 GbE
- 5.1.3 25/40/50 GbE
- 5.1.4 100 GbE
- 5.1.5 400 GbE
- 5.1.6 800 GbE and 1.6 TbE
- 5.2 By End-user Industry
- 5.2.1 Telecommunications
- 5.2.2 Data Centers and Cloud
- 5.2.3 Manufacturing
- 5.2.4 Automotive and Transport
- 5.2.5 Aerospace and Defense
- 5.2.6 Others (Utilities, Healthcare)
- 5.3 By Application
- 5.3.1 RandD/Lab
- 5.3.2 Manufacturing/Production
- 5.3.3 Field Service and Installation
- 5.3.4 Certification and Compliance
- 5.4 By Test Type
- 5.4.1 Functional / Traffic Generation
- 5.4.2 Performance / Stress
- 5.4.3 Compliance / Conformance
- 5.4.4 Network Emulation
- 5.5 By Geography
- 5.5.1 North America
- 5.5.1.1 United States
- 5.5.1.2 Canada
- 5.5.1.3 Mexico
- 5.5.2 South America
- 5.5.2.1 Brazil
- 5.5.2.2 Argentina
- 5.5.2.3 Rest of South America
- 5.5.3 Europe
- 5.5.3.1 Germany
- 5.5.3.2 United Kingdom
- 5.5.3.3 France
- 5.5.3.4 Italy
- 5.5.3.5 Spain
- 5.5.3.6 Russia
- 5.5.3.7 Rest of Europe
- 5.5.4 Asia Pacific
- 5.5.4.1 China
- 5.5.4.2 India
- 5.5.4.3 Japan
- 5.5.4.4 South Korea
- 5.5.4.5 ASEAN
- 5.5.4.6 Rest of Asia Pacific
- 5.5.5 Middle East and Africa
- 5.5.5.1 Middle East
- 5.5.5.1.1 Saudi Arabia
- 5.5.5.1.2 UAE
- 5.5.5.1.3 Turkey
- 5.5.5.1.4 Rest of Middle East
- 5.5.5.2 Africa
- 5.5.5.2.1 South Africa
- 5.5.5.2.2 Nigeria
- 5.5.5.2.3 Rest of Africa
- 5.5.5.1 Middle East
- 5.5.1 North America
6 COMPETITIVE LANDSCAPE
- 6.1 Market Concentration
- 6.2 Strategic Moves
- 6.3 Market Share Analysis
- 6.4 Company Profiles (includes Global level Overview, Market level overview, Core Segments, Financials as available, Strategic Information, Market Rank/Share for key companies, Products and Services, and Recent Developments)
- 6.4.1 Keysight Technologies Inc.
- 6.4.2 Anritsu Corp.
- 6.4.3 VIAVI Solutions Inc.
- 6.4.4 Spirent Communications plc
- 6.4.5 EXFO Inc.
- 6.4.6 Rohde and Schwarz GmbH and Co KG
- 6.4.7 Teledyne LeCroy (Xena)
- 6.4.8 Yokogawa Test and Measurement
- 6.4.9 VeEX Inc.
- 6.4.10 GL Communications Inc.
- 6.4.11 Trend Networks
- 6.4.12 GigaNet Systems
- 6.4.13 Xinertel Technology
- 6.4.14 Apposite Technologies
- 6.4.15 NetScout Systems Inc.
- 6.4.16 Te Connectivity Ltd.
- 6.4.17 Aquantia (Marvell)
- 6.4.18 GAO Tek Inc.
- 6.4.19 IDEAL Industries Inc.
- 6.4.20 Veryx Technologies
7 MARKET OPPORTUNITIES AND FUTURE OUTLOOK
- 7.1 White-space and Unmet-need Assessment

 2026-2030年全球乙太網路測試設備市場
 2026年全球乙太網路測試設備市場報告
 乙太網路測試設備市場:2026-2032年全球市場預測(按產品類型、技術、測試頻率、應用和最終用戶分類)
 Gigabit乙太網路測試設備全球市場規模、佔有率、趨勢和成長分析報告(2026-2034)
 Gigabit乙太網路測試設備市場規模、佔有率及成長分析(依產品類型、應用、介面類型、最終用戶及地區分類)-2026-2033年產業預測
 乙太網路測試設備市場規模、佔有率和趨勢分析報告:按類型、功能、最終用途、地區和細分市場預測,2025 年至 2033 年
 十億位元乙太網路網路測試設備市場機會、成長動力、產業趨勢分析與 2025 - 2034 年預測