


 |
市場調查報告書
商品編碼
2122750
企業人工智慧:市場佔有率分析、產業趨勢與統計、成長預測(2026-2031)Enterprise AI - Market Share Analysis, Industry Trends & Statistics, Growth Forecasts (2026 - 2031) |
||||||

※ 本網頁內容可能與最新版本有所差異。詳細情況請與我們聯繫。
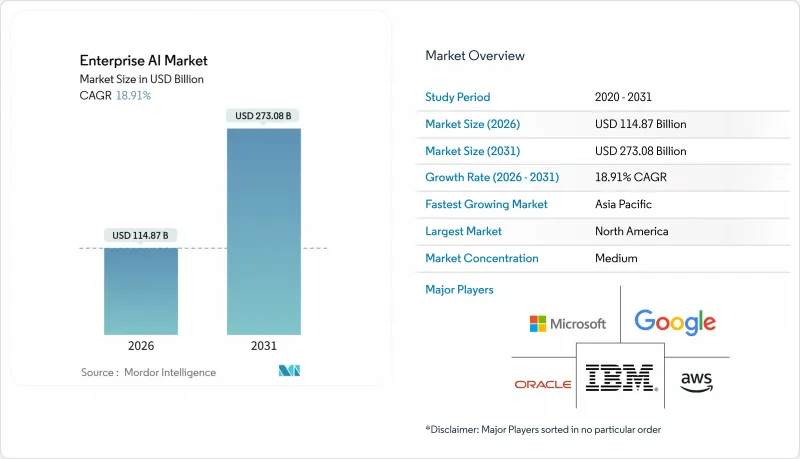
根據 Mordor Intelligence 預測,企業人工智慧市場規模預計將在 2026 年達到 1,148.7 億美元,到 2031 年達到 2,730.8 億美元,2026 年至 2031 年的複合年成長率為 18.91%。
本報告按元件(軟體平台、服務、硬體加速器)、組織規模(大型企業、中小企業)、職能部門(客戶支援、其他)、技術(電腦視覺、其他)、最終用戶產業(製造業、其他)、部署模式(本地部署、其他)和地區進行細分。市場預測以美元計價。
全球企業人工智慧市場趨勢與洞察
對自動化和人工智慧解決方案的需求激增
企業正透過將對話式人工智慧融入客戶支持,並將程式碼產生模型引入軟體工程,從而將人才從重複性任務中重新分配到策略性業務流程中。 IBM宣布,其Watson平台將在2024年處理與企業客戶的超過10億次交互,比2023年成長40% 。人事費用的降低增強了GPU和推理叢集的商業價值,這些集群支持大規模語言模型。與傳統的基於規則的自動化浪潮不同,底層模型可以處理非結構化的電子郵件、語音和合約文本,從而實現合約審查和臨床文件創建等新的工作流程。隨著準確性的提高,經營團隊允許人工智慧採取行動,而不僅僅是提案,並執行決策。關注點正從降低成本轉向產生收入,自動化在董事會層級被視為成長的驅動力。
分析指數級成長的企業資料集的必要性
預計到2025年,全球資料產生量將達到175Zetta位元組),這將迫使企業部署人工智慧系統來對Petabyte級資料進行分類、提取和利用。零售商依賴對數千個SKU的即時需求追蹤,而製造商則需要從數百萬個物聯網感測器訊號中檢測異常情況。 Salesforce報告稱,其Einstein平台在2024會計年度每週分析超過一兆個客戶資料點,支援預測性案源計分和客戶流失預警。傳統的商業智慧工具無法分析如此高維度的輸入數據,因此,可橫向擴展的機器學習模型對企業至關重要。透過預測性洞察實現數據變現的企業更有能力創造新的收入來源並最佳化營運資本。
文化和技能差距正在減緩企業採用新技術的速度。
對資料科學家、機器學習維運工程師和人工智慧倫理專家的需求持續超過供應,導致薪資飆升和招募週期延長。德勤2024年對2,800名高階主管進行的一項調查發現,68%的受訪者認為人才短缺是人工智慧擴張的最大障礙。除了人員配備問題外,文化阻力依然存在,員工對可能改變其日常工作流程的演算法推薦持懷疑態度。只有三分之一的員工表示接受過足夠的人工智慧技能培訓,凸顯了經營團隊的期望與員工的實際準備之間存在差距。如果沒有全面的轉型管理計劃,企業將面臨無法充分利用昂貴的人工智慧基礎設施的風險。此外,技能短缺導致服務支出增加,因為企業需要依賴系統整合商來彌補能力缺口。
細分市場分析
到2025年,軟體和平台將佔總收入的65.89%。這主要歸功於企業傾向於採用整合工具鏈,以簡化其基礎設施的複雜性。在微軟Azure AI Studio和GoogleVertex AI等產品的推動下,企業人工智慧軟體市場規模在2025年達到756億美元。硬體加速器預計到2031年將以19.39%的複合年成長率成長,是所有組件中成長最快的。這反映了大規模推理工作負載的計算強度。硬體的成長將透過擴大可處理的總運算能力和降低即時應用程式的延遲閾值來推動企業人工智慧市場的發展。
英偉達是資本密集企業的典型例子。該公司2024會計年度的資料中心營收成長了217%,達到475億美元,主要得益於H100和Blackwell的領先訂單。雲端服務供應商正在簽訂多年供貨合約以確保GPU供應,而受監管行業的公司則採購本地叢集以維護資料管理權。隨著系統整合商管理資料工程、模型部署和持續監控,業務收益也與基礎架構的複雜性成正比成長。平台、硬體和服務之間的相互作用凸顯了一個良性循環:更優秀的晶片能夠打造更豐富的平台,而這反過來又會創造對服務的需求。
大型企業憑藉其內部資料科學人才以及在全球營運中攤銷人工智慧投資的能力,預計到2025年將佔71.43%的收入佔有率。然而,中小企業預計到2031年將以19.34%的複合年成長率成長,成長率高於整體企業人工智慧市場。嵌入SaaS應用程式中的預訓練基礎模型無需開發自訂模型,使中型企業能夠實現企業級功能。 Salesforce Einstein和UiPath Automation Cloud是供應商將人工智慧整合到低程式碼介面中的典型例子,即使是缺乏技術專長的團隊也能輕鬆使用。
這種民主化趨勢正在縮小全球大型企業集團和區域性新興企業之間的技術差距。中小企業正在利用付費使用制付費的推理終端來避免初始資本支出 (CAPEX),並利用基於市場的微調服務來實現針對特定領域的客製化。雖然大型企業在為演算法交易等獨特用例開發客製化模型方面仍然佔據主導地位,但成長速度的差異表明,到本十年末,各種規模的組織在人工智慧成熟度方面將趨於一致。
區域分析
預計到2025年,北美將佔企業人工智慧市場收入的42.49%。這主要歸功於美國和加拿大的創新集中,而超大規模資料中心業者資料中心、創業投資資金和大學研究是推動創新的主要動力。兩國的人工智慧研究機構都擁有強大的人才儲備,寬鬆的法規環境也縮短了實用化時間。加拿大的VectorLab持續將學術突破轉化為商業成果,而墨西哥正在崛起成為人工智慧驅動的業務流程外包近岸中心。目前面臨的挑戰包括GPU供應緊張和人事費用上升。
預計到2031年,亞太地區將以19.92%的複合年成長率實現最高成長,這主要得益於中國、印度、日本和韓國政府主導的國家人工智慧項目以及本土化的基礎設施模式。中國斥資500億美元的國家人工智慧計畫正投資於國內半導體製造和模型研發,以減少對海外供應商的依賴。印度的「IndiaAI」計畫投資12億美元建設自身基礎設施,目標在2027年前培養50萬名專家。日本為製造業和醫療保健領域的人工智慧發展提供津貼,而韓國則致力於在人工智慧半導體領域佔據領先地位。澳洲正利用其先進的數位基礎設施,將人工智慧應用於採礦和金融服務領域。
歐洲對人工智慧採取謹慎態度,力求在創新與嚴格的管治之間取得平衡,並制定相應的人工智慧立法。德國、法國和英國分別投資於弗勞恩霍夫實驗室和F站等公私合作研究中心。中東和非洲地區仍處於人工智慧應用的早期階段,但在阿拉伯聯合大公國和沙烏地阿拉伯的主導,智慧城市和能源最佳化計畫正展現出強勁的發展勢頭。在以巴西和阿根廷為首的南美洲,人工智慧正被應用於精密農業和金融科技領域。在新興地區,基礎設施不平衡和人才短缺阻礙了發展,但針對在地化目標的投資和夥伴關係正在為專業供應商創造商機。
其他好處
- Excel格式的市場預測(ME)表
- 3個月的分析師支持
目錄
第1章:引言
- 研究假設和市場定義
- 調查範圍
第2章:調查方法
第3章執行摘要
第4章 市場狀況
- 市場概覽
- 市場促進因素
- 對自動化和人工智慧解決方案的需求激增
- 分析指數級成長的企業資料集的必要性
- 基於雲端的AIaaS(人工智慧即服務)平台的興起
- 專用運算硬體(GPU、TPU、NPU)的進步
- 透過產業特定平台模型在中小企業中應用人工智慧
- 實現淨零排放的承諾將促進人工智慧驅動的碳最佳化工具的普及應用。
- 市場限制因素
- 文化和技能差距正在減緩企業採用新技術的速度。
- 資料主權和隱私法規帶來的障礙
- 高昂的實施成本和基礎設施成本
- 人工智慧與舊有系統整合的複雜性
- 產業價值鏈分析
- 監理情勢
- 技術展望
- 波特五力分析
- 宏觀經濟因素對市場的影響
第5章 市場規模與成長預測
- 按組件
- 軟體平台
- 服務
- 硬體加速器
- 按組織規模
- 大公司
- 小型企業
- 按功能節段
- 客戶支援
- 營運和供應鏈
- 金融與風險
- 人力資源
- 透過技術
- 機器學習與基礎模型
- 自然語言處理
- 電腦視覺
- 決策智慧與最佳化
- 按最終用戶行業分類
- 銀行、金融服務和保險(BFSI)
- 製造業
- 汽車與出行
- 資訊科技/通訊
- 媒體與廣告
- 醫療保健和生命科學
- 零售與電子商務
- 能源與公共產業
- 其他
- 按部署模式
- 現場
- 雲
- 混合/邊緣
- 按地區
- 北美洲
- 美國
- 加拿大
- 墨西哥
- 歐洲
- 德國
- 英國
- 法國
- 俄羅斯
- 其他歐洲國家
- 亞太地區
- 中國
- 日本
- 印度
- 韓國
- 澳洲
- 其他亞太國家
- 中東和非洲
- 中東
- 沙烏地阿拉伯
- 阿拉伯聯合大公國
- 其他中東國家
- 非洲
- 南非
- 埃及
- 其他非洲地區
- 中東
- 南美洲
- 巴西
- 阿根廷
- 南美洲其他地區
- 北美洲
第6章 競爭情勢
- 市場集中度
- Strategic Developments
- 供應商定位分析
- 公司簡介
- Microsoft Corporation
- IBM Corporation
- Amazon Web Services Inc.
- Google LLC
- Oracle Corporation
- Hewlett Packard Enterprise Company
- NVIDIA Corporation
- SAP SE
- Intel Corporation
- Wipro Limited
- NEC Corporation
- Accenture plc
- ServiceNow Inc.
- DataRobot Inc.
- UiPath Inc.
- C3.ai Inc.
- Palantir Technologies
- H2O.ai Inc.
- Snowflake Inc.
- Databricks Inc.
第7章 市場機會與未來展望
According to Mordor Intelligence, the enterprise AI market size stood at USD 114.87 billion in 2026 and is projected to reach USD 273.08 billion by 2031, registering an 18.91% CAGR over 2026-2031.
This report is Segmented by Component (Software/Platform, Services, and Hardware Accelerators), Organization Size (Large Enterprise, and Small and Medium Enterprises), Functional Area (Customer-Facing, and More), Technology (Computer Vision, and More), End-User Industry (Manufacturing, and More), Deployment Model (On-Premise, and More), and Geography. The Market Forecasts are Provided in Terms of Value (USD).
Global Enterprise AI Market Trends and Insights
Surging Demand for Automation and AI-Based Solutions
Enterprises are redeploying labor from repetitive tasks toward strategic workstreams by embedding conversational AI in customer support and code-generation models in software engineering. IBM disclosed that its Watson platform processed more than 1 billion enterprise customer interactions in 2024, a 40% increase from 2023. Labor savings strengthen the business case for GPUs and inference clusters that underpin large language models. Unlike prior rule-based automation waves, foundation models handle unstructured email, audio, and contract text, enabling new workflows such as contract review and clinical documentation. As accuracy improves, leadership teams are authorizing AI to execute decisions rather than simply recommend actions. The focus has shifted from cost reduction to revenue enablement, positioning automation as a board-level growth lever.
Need to Analyze Exponentially Growing Enterprise Data Sets
Global data creation is tracking toward 175 zettabytes in 2025, compelling enterprises to adopt AI systems that classify, extract, and act on petabyte-scale repositories. Retailers rely on real-time demand sensing across thousands of SKUs, while manufacturers detect anomalies from millions of IoT sensor signals. Salesforce reported that its Einstein platform analyzed more than 1 trillion customer data points per week in fiscal 2024, powering predictive lead scoring and churn alerts. Classic business intelligence tools cannot parse such high-dimensional inputs, so machine learning models that scale horizontally are now mission-critical. Organizations that monetize data through predictive insights are better positioned to create new revenue streams and streamline working capital.
Cultural and Skills Gap Slowing Enterprise Adoption
Demand for data scientists, MLOps engineers, and AI ethicists continues to exceed supply, inflating salaries and prolonging hiring cycles. Deloitte's 2024 survey of 2,800 executives revealed that 68% cited talent shortages as the primary barrier to scaling AI. Beyond headcount, cultural resistance persists, as employees remain skeptical of algorithmic recommendations that alter daily workflows. Only one-third of workers reported receiving adequate AI upskilling, highlighting misalignment between executive ambition and workforce readiness. Without comprehensive change-management programs, enterprises risk underutilizing expensive AI infrastructure. Skills scarcity also drives services spending, as firms rely on system integrators to fill capability gaps.
Other drivers and restraints analyzed in the detailed report include:
- Rise of Cloud-Based AI-as-a-Service Platforms
- Advances in Specialized Computing Hardware (GPU, TPU, NPU)
- Data-Sovereignty and Privacy-Regulation Hurdles
For complete list of drivers and restraints, kindly check the Table Of Contents.
Segment Analysis
Software and platforms accounted for 65.89% of revenue in 2025, as enterprises favored integrated toolchains that abstract away infrastructure complexity. The Enterprise AI market size for software reached USD 75.6 billion in 2025, underpinned by offerings such as Microsoft Azure AI Studio and Google Vertex AI. Hardware accelerators are forecast to post a 19.39% CAGR through 2031, the fastest among components, reflecting the compute intensity of large-scale inference workloads. Hardware's growth elevates the Enterprise AI market by expanding total addressable compute capacity and lowering latency thresholds for real-time applications.
Capital intensity is illustrated by NVIDIA, whose fiscal 2024 data center revenue rose 217% to USD 47.5 billion, driven by H100 and Blackwell pre-orders. Cloud providers are locking in multi-year supply commitments to guarantee GPU availability, while enterprises in regulated industries are procuring on-premises clusters to retain data control. Services revenue follows infrastructure complexity, as system integrators manage data engineering, model deployment, and continuous monitoring. The interplay between platforms, hardware, and services underscores a virtuous cycle, better silicon enables richer platforms, which in turn generate services demand.
Large enterprises held 71.43% of 2025 revenue thanks to in-house data science talent and the ability to amortize AI investments across global operations. However, SMEs are projected to outpace the broader Enterprise AI market with a 19.34% CAGR through 2031. Pre-trained foundation models embedded in SaaS applications eliminate the need for bespoke model development, enabling mid-market firms to match enterprise-grade capabilities. Salesforce Einstein and UiPath Automation Cloud illustrate how vendors package AI into low-code interfaces accessible to non-technical teams.
The democratization trend narrows the technology gap between global conglomerates and regional challengers. SMEs leverage pay-as-you-go inference endpoints to avoid upfront capex, while marketplace-based fine-tuning services allow domain-specific customization. Large enterprises still dominate custom model development for proprietary use cases such as algorithmic trading, but growth differentials suggest that AI maturity will converge across organization sizes by the decade's end.
Complete Report Scope:
- By Component
- Software / Platform
- Services
- Hardware Accelerators
- By Organization Size
- Large Enterprise
- Small and Medium Enterprises
- By Functional Area
- Customer-Facing
- Operations and Supply-Chain
- Finance and Risk
- HR and Talent
- By Technology
- Machine Learning / Foundation Models
- Natural-Language Processing
- Computer Vision
- Decision Intelligence / Optimisation
- By End-User Industry
- Banking, financial services and insurance (BFSI)
- Manufacturing
- Automotive and Mobility
- IT and Telecom
- Media and Advertising
- Healthcare and Life-Sciences
- Retail and e-Commerce
- Energy and Utilities
- Other End-User Industries
- By Deployment Model
- On-Premise
- Cloud
- Hybrid / Edge
- By Geography
- North America
- United States
- Canada
- Mexico
- Europe
- Germany
- United Kingdom
- France
- Russia
- Rest of Europe
- Asia-Pacific
- China
- Japan
- India
- South Korea
- Australia
- Rest of Asia-Pacific
- Middle East and Africa
- Middle East
- Saudi Arabia
- United Arab Emirates
- Rest of Middle East
- Africa
- South Africa
- Egypt
- Rest of Africa
- Middle East
- South America
- Brazil
- Argentina
- Rest of South America
- North America
Geography Analysis
North America accounted for 42.49% of Enterprise AI market revenue in 2025, as hyperscaler data centers, venture funding, and university research concentrated innovation in the United States and Canada. National AI research institutes feed a robust talent pipeline, while a permissive regulatory environment accelerates time-to-production. Canada's Vector Institute continues to commercialize academic breakthroughs, and Mexico is emerging as a nearshore location for AI-enabled business-process outsourcing. GPU supply constraints and salary inflation are current headwinds.
Asia-Pacific is projected to deliver the fastest CAGR of 19.92% through 2031, driven by government-backed sovereign AI programs and localized foundation models in China, India, Japan, and South Korea. China's USD 50 billion national AI plan finances domestic chip fabrication and model development, reducing reliance on foreign suppliers. India's IndiaAI mission allocates USD 1.2 billion to build indigenous infrastructure and train 500,000 professionals by 2027. Japan subsidizes AI in manufacturing and healthcare, while South Korea pursues leadership in AI semiconductors. Australia exploits AI in mining and financial services, leveraging advanced digital infrastructure.
Europe follows a measured trajectory, balancing innovation with strict governance under the AI Act. Germany, France, and the United Kingdom invest in public-private research hubs such as Fraunhofer Institutes and Station F, respectively. The Middle East and Africa are at an earlier stage of adoption but show momentum in smart city and energy optimization projects spearheaded by the United Arab Emirates and Saudi Arabia. South America, led by Brazil and Argentina, applies AI to precision agriculture and fintech. Infrastructure gaps and skills shortages temper growth in emerging regions, yet targeted investments and localization partnerships create openings for specialized vendors.
- Microsoft Corporation
- IBM Corporation
- Amazon Web Services Inc.
- Google LLC
- Oracle Corporation
- Hewlett Packard Enterprise Company
- NVIDIA Corporation
- SAP SE
- Intel Corporation
- Wipro Limited
- NEC Corporation
- Accenture plc
- ServiceNow Inc.
- DataRobot Inc.
- UiPath Inc.
- C3.ai Inc.
- Palantir Technologies
- H2O.ai Inc.
- Snowflake Inc.
- Databricks Inc.
Additional Benefits:
- The market estimate (ME) sheet in Excel format
- 3 months of analyst support
TABLE OF CONTENTS
1 NTRODUCTION
- 1.1 Study Assumptions and Market Definition
- 1.2 Scope of the Study
2 RESEARCH METHODOLOGY
3 EXECUTIVE SUMMARY
4 MARKET LANDSCAPE
- 4.1 Market Overview
- 4.2 Market Drivers
- 4.2.1 Surging Demand for Automation and AI-Based Solutions
- 4.2.2 Need to Analyse Exponentially Growing Enterprise Data Sets
- 4.2.3 Rise of Cloud-Based AI-as-a-Service Platforms
- 4.2.4 Advances in Specialised Computing Hardware (GPU, TPU, NPU)
- 4.2.5 Industry-Specific Foundation Models Democratising AI for SMEs
- 4.2.6 Net-Zero Pledges Driving AI-Enabled Carbon-Optimisation Tools
- 4.3 Market Restraints
- 4.3.1 Cultural and Skills Gap Slowing Enterprise Adoption
- 4.3.2 Data-Sovereignty and Privacy-Regulation Hurdles
- 4.3.3 High Implementation and Infrastructure Costs
- 4.3.4 Complexity in Integrating AI with Legacy Systems
- 4.4 Industry Value Chain Analysis
- 4.5 Regulatory Landscape
- 4.6 Technological Outlook
- 4.7 Porter's Five Forces Analysis
- 4.7.1 Bargaining Power of Buyers
- 4.7.2 Bargaining Power of Suppliers
- 4.7.3 Threat of New Entrants
- 4.7.4 Threat of Substitutes
- 4.7.5 Competitive Rivalry
- 4.8 Impact of Macroeconomic Factors on the Market
5 MARKET SIZE AND GROWTH FORECASTS (VALUE)
- 5.1 By Component
- 5.1.1 Software / Platform
- 5.1.2 Services
- 5.1.3 Hardware Accelerators
- 5.2 By Organization Size
- 5.2.1 Large Enterprise
- 5.2.2 Small and Medium Enterprises
- 5.3 By Functional Area
- 5.3.1 Customer-Facing
- 5.3.2 Operations and Supply-Chain
- 5.3.3 Finance and Risk
- 5.3.4 HR and Talent
- 5.4 By Technology
- 5.4.1 Machine Learning / Foundation Models
- 5.4.2 Natural-Language Processing
- 5.4.3 Computer Vision
- 5.4.4 Decision Intelligence / Optimisation
- 5.5 By End-User Industry
- 5.5.1 Banking, financial services and insurance (BFSI)
- 5.5.2 Manufacturing
- 5.5.3 Automotive and Mobility
- 5.5.4 IT and Telecom
- 5.5.5 Media and Advertising
- 5.5.6 Healthcare and Life-Sciences
- 5.5.7 Retail and e-Commerce
- 5.5.8 Energy and Utilities
- 5.5.9 Other End-User Industries
- 5.6 By Deployment Model
- 5.6.1 On-Premise
- 5.6.2 Cloud
- 5.6.3 Hybrid / Edge
- 5.7 By Geography
- 5.7.1 North America
- 5.7.1.1 United States
- 5.7.1.2 Canada
- 5.7.1.3 Mexico
- 5.7.2 Europe
- 5.7.2.1 Germany
- 5.7.2.2 United Kingdom
- 5.7.2.3 France
- 5.7.2.4 Russia
- 5.7.2.5 Rest of Europe
- 5.7.3 Asia-Pacific
- 5.7.3.1 China
- 5.7.3.2 Japan
- 5.7.3.3 India
- 5.7.3.4 South Korea
- 5.7.3.5 Australia
- 5.7.3.6 Rest of Asia-Pacific
- 5.7.4 Middle East and Africa
- 5.7.4.1 Middle East
- 5.7.4.1.1 Saudi Arabia
- 5.7.4.1.2 United Arab Emirates
- 5.7.4.1.3 Rest of Middle East
- 5.7.4.2 Africa
- 5.7.4.2.1 South Africa
- 5.7.4.2.2 Egypt
- 5.7.4.2.3 Rest of Africa
- 5.7.4.1 Middle East
- 5.7.5 South America
- 5.7.5.1 Brazil
- 5.7.5.2 Argentina
- 5.7.5.3 Rest of South America
- 5.7.1 North America
6 COMPETITIVE LANDSCAPE
- 6.1 Market Concentration
- 6.2 Strategic Developments
- 6.3 Vendor Positioning Analysis
- 6.4 Company Profiles (includes Global-Level Overview, Market-Level Presence, Core Segments, Financials, Strategic Information, Market Rank/Share, Products and Services, Recent Developments)
- 6.4.1 Microsoft Corporation
- 6.4.2 IBM Corporation
- 6.4.3 Amazon Web Services Inc.
- 6.4.4 Google LLC
- 6.4.5 Oracle Corporation
- 6.4.6 Hewlett Packard Enterprise Company
- 6.4.7 NVIDIA Corporation
- 6.4.8 SAP SE
- 6.4.9 Intel Corporation
- 6.4.10 Wipro Limited
- 6.4.11 NEC Corporation
- 6.4.12 Accenture plc
- 6.4.13 ServiceNow Inc.
- 6.4.14 DataRobot Inc.
- 6.4.15 UiPath Inc.
- 6.4.16 C3.ai Inc.
- 6.4.17 Palantir Technologies
- 6.4.18 H2O.ai Inc.
- 6.4.19 Snowflake Inc.
- 6.4.20 Databricks Inc.
7 MARKET OPPORTUNITIES AND FUTURE OUTLOOK
- 7.1 White-Space and Unmet-Need Assessment

 企業人工智慧:全球市場
 企業級LLM市場規模、佔有率和成長分析:按部署模式、模型類型、應用、企業規模、最終用戶產業和地區分類-2026-2033年產業預測
 企業人工智慧市場:全球市場預測,2026-2032年
 生成式人工智慧在企業知識管理和搜尋中的應用:市場佔有率分析、行業趨勢和統計數據以及成長預測(2026-2031 年)企業人工智慧市場-2026-2032年全球市場預測
 企業人工智慧平台市場預測至2034年-全球分析(按組件、部署模式、人工智慧技術、功能、應用、最終用戶和區域分類)循環性評估平台市場:預測至 2034 年—按部署類型、評估類型、調查方法、產業、最終用戶和地區分類的全球分析人工智慧驅動的企業搜尋市場預測至2034年-全球分析(按組件、部署模式、企業規模、技術、應用、最終用戶和地區分類)
 企業人工智慧市場-全球產業規模、佔有率、趨勢、機會和預測:按部署類型、技術、產業橫斷面、地區和競爭格局分類,2021-2031年
 2026-2030年全球人工智慧企業搜尋平台市場