


 |
市場調查報告書
商品編碼
2122665
電纜連接器:市場佔有率分析、行業趨勢和統計數據、成長預測(2026-2031 年)Cable Connector - Market Share Analysis, Industry Trends & Statistics, Growth Forecasts (2026 - 2031) |
||||||

※ 本網頁內容可能與最新版本有所差異。詳細情況請與我們聯繫。
根據 Mordor Intelligence 預測,電纜連接器市場規模將從 2025 年的 1103.2 億美元成長到 2026 年的 1182.8 億美元,到 2031 年將達到 1675.5 億美元,2026 年至 2031 年的複合年成長率為 7.21%。
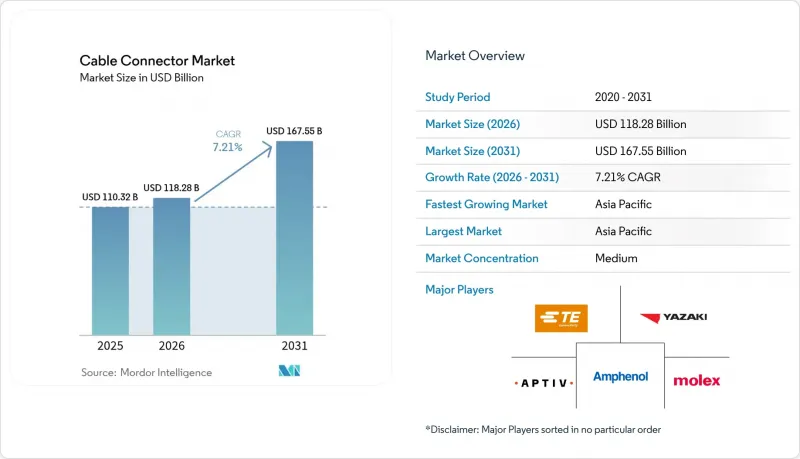
本報告按連接器類型(PCB連接器、圓形和矩形連接器等)、安裝方式(基板對板連接、線對板連接等)、最終用戶行業(IT和通訊行業及其他)、數據速率等級(10 Gbps及以下標準及其他)、材質(銅合金及其他)和地區(北美、歐洲及其他)進行細分。市場預測以美元計價。
全球電纜連接器市場趨勢及洞察
5G部署和光纖回程傳輸密度增加
全球5G部署需要能夠承受惡劣戶外環境和溫度波動,同時在毫米波頻段保持訊號完整性的高頻連接器。每個新建的5G宏基地台整合的光纖線路數量是傳統4G基地台的三到四倍,這大大增加了對光連接器的需求。城市中心小型基地台密度的不斷增加,進一步推動了對密封式、符合IP67/IP68防護等級且可快速現場安裝的連接器的需求。工廠中的專用5G網路需要能夠承受油霧、振動和熱循環的堅固耐用的連接器。隨著密度的增加,能夠同時提供低插入損耗和免工具端接的光連接器供應商正在獲得價格優勢。
電子設備小型化
智慧型手機、穿戴式裝置、工業感測器和醫療貼片正日益將更多功能整合到更小的機殼中。隨著間距小於 0.5 毫米、高度小於 1 毫米成為標準設計規範,連接器製造商被迫投資於精密成型、視覺引導拾取放置和雷射焊接屏蔽技術。先進的攝影機和VR頭戴裝置需要高引腳數的基板對板連接器,這些連接器能夠承受反覆的鉸鏈運動並保持不間斷的通訊。工業IoT部署也需要類似的緊湊性,但也必須能夠承受 -40 度C至 125 度C的溫度範圍。與 mini-LED 背光和折疊式設備藍圖保持一致的供應商正在實現多年設計採用,從而確保產品在整個生命週期內的需求。
銅和貴金屬價格波動
2024年至2025年間,銅價在每噸8000美元至11000美元之間波動,鍍金價格同比飆升40%,擠壓了對成本敏感的標準連接器的利潤空間。雖然選擇性鍍層和合金替代可以抵消部分價格波動,但如果原料避險與市場趨勢不符,長期固定價格合約仍使中型供應商面臨風險。大型供應商利用規模經濟優勢協商浮動價格條款,而中小企業則難以承受季度價格波動。終端用戶不願支付額外費用,導致成本轉嫁延遲,現金週轉週期延長。
細分市場分析
從連接器類型來看,PCB連接器廣泛應用於消費性電子、通訊和工業電子等各個領域,預計到2025年將維持24.58%的電纜連接器市場佔有率。此細分市場的銷售額成長速度與整體電纜連接器市場成長速度相近,即年複合成長率處於中等個位數水平,這主要得益於間距縮小和引腳密度提高方面的創新。圓形和矩形連接器在航太和國防領域保持著強勁的地位,可靠性認證使得它們能夠獲得更高的價格和更長期的合約。隨著資料中心和5G去程傳輸投資的增加,光纖介面的需求也隨之成長。更低的插入損耗和更強的戶外耐久性是推動基礎設施投資的主要因素。 I/O和射頻同軸連接器在測試測量設備領域鞏固了其市場地位,在該領域,重複性比簡單的產量更為重要。電力和高壓電動車連接器正呈現特別顯著的成長,預計到 2031 年複合年成長率將達到 8.52%。這要歸功於需要 800V 架構的新型電池電動車平台以及對超快速充電的需求,使其成為電纜連接器市場中成長最快的細分市場。
全球OEM認證標準要求具備電弧抑制、防震機殼和用於監測結溫的整合式熱電偶。這些設計要求限制了認證供應商的數量,同時也推高了平均售價。成熟的汽車連接器專家正在利用無腔包覆成型等製程技術來最大限度地降低電阻損耗,而新參與企業則致力於為印度和東南亞的摩托車電動化市場開發成本更低的替代方案。能夠將IEC 62196等國際標準與區域充電協議相協調的行業領導企業正在獲得多年採購合約。這些協同效應表明,在預測期內,電源連接器領域將成為電纜連接器市場成長的最大貢獻者。
到2025年,基板對板(B2B)組件將佔據電纜連接器市場35.62%的佔有率,這主要得益於行動裝置、筆記型電腦和高級駕駛輔助系統(ADAS)等產品中複雜的多板電子架構。原始設備製造商(OEM)傾向於選擇能夠承受跌落扭轉應力的超薄堆疊式連接器。線對板(WTB)連接器在現場更換比內部空間限制更為重要的市場(例如工廠自動化控制面板)中仍然很受歡迎。電纜對電纜(CTB)連接器在模組化機械臂和可再生能源匯流箱等對佈線柔軟性要求極高的應用場景中表現出色。
面板和直通式解決方案目前市場佔有率雖小,但預計到2031年將實現8.78%的複合年成長率,這主要得益於邊緣電腦櫃、戶外5G無線設備和電池儲能機殼對氣密密封和快速連接的需求。 IP67和IP68防護等級要求需要額外的材料層和更複雜的密封墊,從而導致產品成本增加。整合式電源和訊號的混合直通式型號支援單孔安裝,減少了爬塔和滑橇式安裝所需的時間。提供預先整合EMC屏蔽和冷凝水排放功能的供應商正逐漸被通訊塔OEM廠商所接受。因此,面板配置在電纜連接器市場中的市場佔有率顯著擴大。
區域分析
預計到2025年,亞太地區將維持42.05%的市場佔有率,這主要得益於中國、日本和韓國將半導體、智慧型手機和電動車生產整合到統一的供應鏈生態系統中。該地區的複合年成長率預計為7.88%,這得益於國內5G基地台的部署以及政府對本土電動車品牌的激勵措施。儘管由於區域人事費用上升和地緣政治不確定性,跨國公司正在越南和印度擴大第二產地產能,但由於位置優勢和成熟的模具網路,大規模生產仍集中在中國。各國政府正增加對國產連接器研發的津貼,以促進價值鏈上游轉移,並減少對進口的依賴。
北美地區則位居銷售額第二,主要得益於支援人工智慧和機器學習服務的資料中心建置。超大規模業者需要800G光鏈路和12VHPWR電源,迫使當地契約製造製造商為其新型連接器產品取得認證。美國的《晶片與科學法案》為高速互連的國內模具製造津貼,而加拿大的汽車產業叢集正將重心轉向電動車(EV)的組裝,電動車需要大量密封式大電流連接器。墨西哥正在吸收近岸組裝生產,因為原始設備製造商(OEM)正在對沖對東亞依賴的風險。
在歐洲,受汽車電氣化和工業自動化投資的推動,市場正穩步擴張。德國工具機製造商指定使用能夠承受10g振動的M12和推拉式連接器,而對加固型連接器的高階訂單也持續不斷。歐盟的戰略自主政策正在推動對連接器製造的津貼,從而提振義大利和波蘭的中型供應商。英國資料中心的擴張和離岸風力發電的建設分別推動了對光纖連接器和海底連接器的需求,為電纜連接器市場提供了多元化的成長途徑。
其他好處:
- Excel格式的市場預測(ME)表
- 3個月的分析師支持
目錄
第1章:引言
- 研究假設和市場定義
- 調查範圍
第2章:調查方法
第3章執行摘要
第4章 市場狀況
- 市場概覽
- 市場促進因素
- 5G部署和光纖回程傳輸密度增加
- 消費和工業應用中電子設備的微型化
- 隨著電動車產量的快速成長,對能夠承受高電壓和大電流的連接器的需求也日益成長。
- 共封裝光學元件 (CPO) 正在推動對超短距離銅線和光纖 I/O 連接器的需求。
- 在資料中心伺服器中,PCIe Gen5/Gen6 12 VHPWR GPU 電源規格正成為事實上的標準。
- 政府獎勵鼓勵生產堅固耐用的陸上連接器(類似於美國和歐盟的CHIPS法案的法律)
- 市場限制因素
- 銅和貴金屬電鍍價格波動
- 設計的複雜性以及小於 0.5 毫米間距的對準公差。
- 超細間距SMT連接器廢品率和返工率高(超過7%)。
- 在邊緣/工業物聯網部署中,IP 標準合規性和密封要求推高了物料清單成本。
- 產業價值鏈分析
- 監理情勢
- 技術展望
- 波特五力分析
第5章 市場規模與成長預測
- 依連接器類型
- PCB連接器
- 圓形和矩形連接器
- 光纖連接器
- 輸入/輸出和射頻/同軸連接器
- 電動車電源和高壓連接器
- 透過安裝配置
- 基板之間
- 導線連接到電路板
- 電纜連接
- 面板/饋通
- 按最終用戶行業分類
- 資訊科技/通訊
- 汽車和運輸業
- 家用電子產品
- 工業自動化
- 能源、電力與海底
- 按數據速率等級
- 低於 10 Gbps 的標準
- 10-25 Gbps 高速
- 25 Gbps 或更高超高速/PAM4
- 材料
- 銅合金
- 鋁和輕合金
- 工程塑膠和複合材料
- 貴金屬鍍(金、鈀)
- 按地區
- 北美洲
- 美國
- 加拿大
- 墨西哥
- 南美洲
- 巴西
- 阿根廷
- 其他南美國家
- 歐洲
- 德國
- 英國
- 法國
- 義大利
- 其他歐洲國家
- 亞太地區
- 中國
- 日本
- 韓國
- 印度
- 其他亞太國家
- 中東
- 沙烏地阿拉伯
- 阿拉伯聯合大公國
- 其他中東國家
- 非洲
- 南非
- 其他非洲國家
- 北美洲
第6章 競爭情勢
- 市場集中度
- 策略趨勢
- 市佔率分析
- 公司簡介
- TE Connectivity Ltd.
- Amphenol Corporation
- Molex LLC(Koch Industries)
- Aptiv PLC
- Yazaki Corporation
- Foxconn Interconnect Technology Ltd.
- Hirose Electric Co., Ltd.
- Japan Aviation Electronics Industry, Ltd.
- Rosenberger Hochfrequenztechnik GmbH & Co. KG
- Samtec, Inc.
- Luxshare Precision Industry Co., Ltd.
- JST Mfg. Co., Ltd.
- HARTING Technology Group
- Sumitomo Electric Industries, Ltd.
- Phoenix Contact GmbH & Co. KG
- Huber+Suhner AG
- Nexans SA
- Prysmian Group SpA
- Fujitsu Limited
- Huawei Technologies Co., Ltd.
第7章 市場機會與未來展望
According to Mordor Intelligence, the cable connector market size is expected to grow from USD 110.32 billion in 2025 to USD 118.28 billion in 2026 and is forecast to reach USD 167.55 billion by 2031 at 7.21% CAGR over 2026-2031.
This report is Segmented by Connector Type (PCB Connectors, Circular and Rectangular Connectors, and More), Mounting Configuration (Board-To-Board, Wire-To-Board, and More), End-User Industry (IT and Telecom, and More), Data-Rate Class (<=10 Gbps Standard, and More), Material (Copper-Alloy, and More), and Geography (North America, Europe, and More). The Market Forecasts are Provided in Terms of Value (USD).
Global Cable Connector Market Trends and Insights
5G Roll-out and Fiber Backhaul Densification
Global 5G deployment demands high-frequency connectors that preserve signal integrity at millimeter-wave bands while tolerating outdoor stressors and temperature swings. Each new 5G macro site integrates three to four times more fiber runs than legacy 4G sites, multiplying optical connector volume. Small-cell densification in urban cores further boosts demand for sealed, IP67/IP68 connectors capable of rapid field installation. Private 5G networks inside factories extend requirements to ruggedized connectors that resist oil mist, vibration, and thermal cycling. As densification accelerates, optical-connector suppliers that can combine low insertion loss with tool-less termination gain pricing leverage.
Miniaturization of Electronics
Smartphones, wearables, industrial sensors, and medical patches now integrate more functionality in tighter envelopes. Pitch distances below 0.5 mm and height profiles under 1 mm are becoming default design rules, pushing connector makers to invest in precision molding, vision-guided pick-and-place, and laser-welded shielding. Advanced cameras and VR headsets demand high-pin-count board-to-board connectors that withstand repeated hinge movement without intermittency. Industrial IoT deployments require similar compactness yet must survive -40 °C to 125 °C temperatures. Vendors that align with mini-LED backlighting and foldable-device roadmaps secure multi-year design wins that lock in demand over product lifecycles.
Volatility of Copper and Precious-Metal Prices
Copper traded between USD 8,000 and USD 11,000 per ton during 2024-2025, and gold plating jumped 40% year on year, slicing margins for cost-sensitive standard connectors. Selective plating and alloy substitution offset some swings, but long-term fixed-price contracts expose mid-tier suppliers to losses when raw-material hedges misalign. Larger vendors use scale to negotiate variable pricing clauses, but smaller firms struggle to absorb quarterly shocks. End customers push back on surcharges, slowing pass-through, and elongating cash-conversion cycles.
Other drivers and restraints analyzed in the detailed report include:
- Rapid EV Production Ramp-up
- Co-Packaged Optics Adoption
- Alignment Tolerances Below 0.5 mm Pitch
For complete list of drivers and restraints, kindly check the Table Of Contents.
Segment Analysis
The connector-type landscape shows PCB connectors retaining 24.58% cable connector market share in 2025, thanks to their omnipresence across consumer, telecom, and industrial electronics. Revenue in this segment stayed on pace with the overall cable connector market at a mid-single-digit CAGR, aided by shrinking pitch innovations and higher pin densities. Circular and rectangular connectors maintained solid positions in aerospace and defense as reliability certifications justify premium pricing and lengthy contracts. Fiber-optic interfaces prospered alongside data-center and 5G fronthaul investments, where reduced insertion loss and outdoor durability attract infrastructure spending. I/O and RF coaxial designs reinforced their niches in test equipment and instrumentation, where repeatability counts more than sheer volume. The standout growth story resides in power and high-voltage EV connectors, projected at an 8.52% CAGR through 2031. They benefit from every new battery-electric platform that mandates 800 V architectures and ultrafast charging demand, creating the fastest-moving pocket of the cable connector market.
Global OEM qualification criteria demand arc-suppression, touch-proof enclosures, and thermocouple integration to monitor junction temperatures. These design layers inflate the average selling price even as they limit qualified supplier pools. Established automotive-grade connector specialists leverage process technologies such as cavity-free over-molding to minimize resistive losses, while new entrants target cost-down variants for two-wheel electrification in India and Southeast Asia. Segment leaders that can harmonize international standards like IEC 62196 with regional charging protocols win multi-year sourcing deals. The combined effect positions the power connector segment as the largest contributor to incremental cable connector market size over the forecast horizon.
Board-to-board assemblies dominated 35.62% of the cable connector market size in 2025, underpinned by complex multi-board electronics architectures that characterize mobile devices, laptops, and advanced driver-assistance systems. OEMs favor ultra-low-profile stacking connectors that survive torsional stress during drop events. Wire-to-board variants persist in markets where field-service interchangeability trumps internal space constraints, such as factory automation panels. Cable-to-cable links excel in modular robotic arms and renewable-energy combiner boxes where re-routing flexibility is paramount.
Panel or feed-through solutions, while representing a smaller base, chart a 8.78% CAGR into 2031 as edge-computing cabinets, outdoor 5G radios, and battery-storage enclosures require hermetic seals and rapid mating. IP67 and IP68 compliance add material layers and gasketing complexity that increase ticket prices. Hybrid power-and-signal feed-through models enable single-hole installations that trim labor time during tower climbs or skid-mount deployments. Vendors that pre-integrate EMC shielding and condensation venting capture specification wins among telecom tower OEMs. Consequently, panel configurations stand out as share-gainers in the cable connector market.
Complete Report Scope:
- By Connector Type
- PCB Connectors
- Circular and Rectangular Connectors
- Fiber-Optic Connectors
- I/O and RF/Coaxial Connectors
- Power and High-Voltage EV Connectors
- By Mounting Configuration
- Board-to-Board
- Wire-to-Board
- Cable-to-Cable
- Panel/Feed-through
- By End-user Industry
- IT and Telecom
- Automotive and Transportation
- Consumer Electronics
- Industrial Automation
- Energy, Power and Sub-sea
- By Data-Rate Class
- Less than 10 Gbps Standard
- 10-25 Gbps High-Speed
- Greater than equal to 25 Gbps Ultra-High-Speed / PAM4
- By Material
- Copper-Alloy
- Aluminum and Lightweight Alloys
- Engineering Plastics and Composites
- Precious-Metal-Plated (Gold, Palladium)
- By Geography
- North America
- United States
- Canada
- Mexico
- South America
- Brazil
- Argentina
- Rest of South America
- Europe
- Germany
- United Kingdom
- France
- Italy
- Rest of Europe
- Asia-Pacific
- China
- Japan
- South Korea
- India
- Rest of Asia-Pacific
- Middle East
- Saudi Arabia
- United Arab Emirates
- Rest of Middle East
- Africa
- South Africa
- Rest of Africa
- North America
Geography Analysis
Asia-Pacific retained a 42.05% share in 2025 as China, Japan, and South Korea clustered semiconductor, smartphone, and EV production in integrated supply ecosystems. Regional CAGR is forecast at 7.88%, buoyed by domestic 5G base-station rollouts and state incentives for local EV brands. Growing regional wage costs and geopolitical uncertainty prompt multinationals to add second-source capacity in Vietnam and India, yet proximity advantages and established tooling networks continue to anchor large production runs within China. Governments add grants for indigenous connector R&D to climb the value chain and reduce import reliance.
North America ranks second in revenue on the back of data-center construction that supports AI and machine-learning services. Hyperscale operators stipulate 800G optical links and 12 VHPWR power delivery, pushing local contract manufacturers to qualify new connector lines. The United States CHIPS and Science Act subsidizes on-shore tooling for high-speed interconnects, while Canada's automotive clusters pivot toward EV assembly that consumes large numbers of sealed, high-current connectors. Mexico absorbs near-shored assembly volumes as OEMs hedge East-Asian exposure.
Europe posts steady expansion driven by automotive electrification and industrial automation investment. Germany's machine-tool builders specify M12 and Push-Pull connectors that withstand 10 g vibration profiles, sustaining premium orders for ruggedized formats. The European Union's strategic-autonomy policies channel grants toward connector manufacturing, boosting mid-size suppliers in Italy and Poland. United Kingdom data-center expansion and offshore wind installations lift demand for fiber-optic and subsea connectors, respectively, giving diverse avenues for cable connector market growth.
- TE Connectivity Ltd.
- Amphenol Corporation
- Molex LLC (Koch Industries)
- Aptiv PLC
- Yazaki Corporation
- Foxconn Interconnect Technology Ltd.
- Hirose Electric Co., Ltd.
- Japan Aviation Electronics Industry, Ltd.
- Rosenberger Hochfrequenztechnik GmbH & Co. KG
- Samtec, Inc.
- Luxshare Precision Industry Co., Ltd.
- J.S.T. Mfg. Co., Ltd.
- HARTING Technology Group
- Sumitomo Electric Industries, Ltd.
- Phoenix Contact GmbH & Co. KG
- Huber+Suhner AG
- Nexans S.A.
- Prysmian Group S.p.A.
- Fujitsu Limited
- Huawei Technologies Co., Ltd.
Additional Benefits:
- The market estimate (ME) sheet in Excel format
- 3 months of analyst support
TABLE OF CONTENTS
1 INTRODUCTION
- 1.1 Study Assumptions and Market Definition
- 1.2 Scope of the Study
2 RESEARCH METHODOLOGY
3 EXECUTIVE SUMMARY
4 MARKET LANDSCAPE
- 4.1 Market Overview
- 4.2 Market Drivers
- 4.2.1 5G roll-out and fibre backhaul densification
- 4.2.2 Miniaturisation of electronics across consumer and industrial devices
- 4.2.3 Rapid EV production ramp-up requiring high-voltage, high-current connectors
- 4.2.4 Co-packaged optics (CPO) driving demand for ultra-short copper and optical I/O connectors
- 4.2.5 PCIe Gen5/Gen6 12 VHPWR GPU power spec becoming de-facto in data-centre servers
- 4.2.6 Government incentives for resilient, on-shore connector manufacturing (US and EU CHIPS-style acts)
- 4.3 Market Restraints
- 4.3.1 Volatility of copper and precious-metal plating prices
- 4.3.2 Design complexity and alignment tolerances below 0.5 mm pitch
- 4.3.3 High scrap and rework rates (>7 %) for ultra-fine-pitch SMT connectors
- 4.3.4 IP-rated sealing requirements raising BOM cost in edge/IIoT deployments
- 4.4 Industry Value Chain Analysis
- 4.5 Regulatory Landscape
- 4.6 Technological Outlook
- 4.7 Porter's Five Forces Analysis
- 4.7.1 Threat of New Entrants
- 4.7.2 Bargaining Power of Suppliers
- 4.7.3 Bargaining Power of Buyers
- 4.7.4 Threat of Substitutes
- 4.7.5 Intensity of Competitive Rivalry
5 MARKET SIZE AND GROWTH FORECASTS (VALUE)
- 5.1 By Connector Type
- 5.1.1 PCB Connectors
- 5.1.2 Circular and Rectangular Connectors
- 5.1.3 Fiber-Optic Connectors
- 5.1.4 I/O and RF/Coaxial Connectors
- 5.1.5 Power and High-Voltage EV Connectors
- 5.2 By Mounting Configuration
- 5.2.1 Board-to-Board
- 5.2.2 Wire-to-Board
- 5.2.3 Cable-to-Cable
- 5.2.4 Panel/Feed-through
- 5.3 By End-user Industry
- 5.3.1 IT and Telecom
- 5.3.2 Automotive and Transportation
- 5.3.3 Consumer Electronics
- 5.3.4 Industrial Automation
- 5.3.5 Energy, Power and Sub-sea
- 5.4 By Data-Rate Class
- 5.4.1 Less than 10 Gbps Standard
- 5.4.2 10-25 Gbps High-Speed
- 5.4.3 Greater than equal to 25 Gbps Ultra-High-Speed / PAM4
- 5.5 By Material
- 5.5.1 Copper-Alloy
- 5.5.2 Aluminum and Lightweight Alloys
- 5.5.3 Engineering Plastics and Composites
- 5.5.4 Precious-Metal-Plated (Gold, Palladium)
- 5.6 By Geography
- 5.6.1 North America
- 5.6.1.1 United States
- 5.6.1.2 Canada
- 5.6.1.3 Mexico
- 5.6.2 South America
- 5.6.2.1 Brazil
- 5.6.2.2 Argentina
- 5.6.2.3 Rest of South America
- 5.6.3 Europe
- 5.6.3.1 Germany
- 5.6.3.2 United Kingdom
- 5.6.3.3 France
- 5.6.3.4 Italy
- 5.6.3.5 Rest of Europe
- 5.6.4 Asia-Pacific
- 5.6.4.1 China
- 5.6.4.2 Japan
- 5.6.4.3 South Korea
- 5.6.4.4 India
- 5.6.4.5 Rest of Asia-Pacific
- 5.6.5 Middle East
- 5.6.5.1 Saudi Arabia
- 5.6.5.2 United Arab Emirates
- 5.6.5.3 Rest of Middle East
- 5.6.6 Africa
- 5.6.6.1 South Africa
- 5.6.6.2 Rest of Africa
- 5.6.1 North America
6 COMPETITIVE LANDSCAPE
- 6.1 Market Concentration
- 6.2 Strategic Moves
- 6.3 Market Share Analysis
- 6.4 Company Profiles (includes Global level Overview, Market level overview, Core Segments, Financials as available, Strategic Information, Market Rank/Share for key companies, Products and Services, and Recent Developments)
- 6.4.1 TE Connectivity Ltd.
- 6.4.2 Amphenol Corporation
- 6.4.3 Molex LLC (Koch Industries)
- 6.4.4 Aptiv PLC
- 6.4.5 Yazaki Corporation
- 6.4.6 Foxconn Interconnect Technology Ltd.
- 6.4.7 Hirose Electric Co., Ltd.
- 6.4.8 Japan Aviation Electronics Industry, Ltd.
- 6.4.9 Rosenberger Hochfrequenztechnik GmbH & Co. KG
- 6.4.10 Samtec, Inc.
- 6.4.11 Luxshare Precision Industry Co., Ltd.
- 6.4.12 J.S.T. Mfg. Co., Ltd.
- 6.4.13 HARTING Technology Group
- 6.4.14 Sumitomo Electric Industries, Ltd.
- 6.4.15 Phoenix Contact GmbH & Co. KG
- 6.4.16 Huber+Suhner AG
- 6.4.17 Nexans S.A.
- 6.4.18 Prysmian Group S.p.A.
- 6.4.19 Fujitsu Limited
- 6.4.20 Huawei Technologies Co., Ltd.
7 MARKET OPPORTUNITIES AND FUTURE OUTLOOK
- 7.1 White-space and Unmet-need Assessment

 電源連接器市場:按產品類型、應用和地區分類
 全球前100大電子連接器製造商分析
 IT連接器:市場佔有率分析、產業趨勢與統計、成長預測(2026-2031年)
 電子連接器市場:未來預測(至2034年)-按產品類型、連接器類型、安裝方式、材料、應用、最終用戶、銷售管道和地區分類的全球分析
 2026年全球通用快速斷開接頭市場報告
 全球浮動連接器市場報告:歷史表現及預測(2021-2032年)
 歐洲連接器市場:2024年、2025年、2026年及2031年
 連接器產業年鑑(2026)2026年全球拖車7針連接器市場報告
 繼電器連接器市場報告:趨勢、預測和競爭分析(至2035年)