


 |
市場調查報告書
商品編碼
2122630
固定線路通訊:市場佔有率分析、產業趨勢與統計資料、成長預測(2026-2031 年)Fixed-Line Communications - Market Share Analysis, Industry Trends & Statistics, Growth Forecasts (2026 - 2031) |
||||||

※ 本網頁內容可能與最新版本有所差異。詳細情況請與我們聯繫。
根據 Mordor Intelligence 估計,固定線路電信市場規模從 2025 年的 2,892.4 億美元成長到 2026 年的 3,214.3 億美元,預計到 2031 年將達到 5,448.2 億美元。
預計 2026 年至 2031 年的複合年成長率為 11.13%。
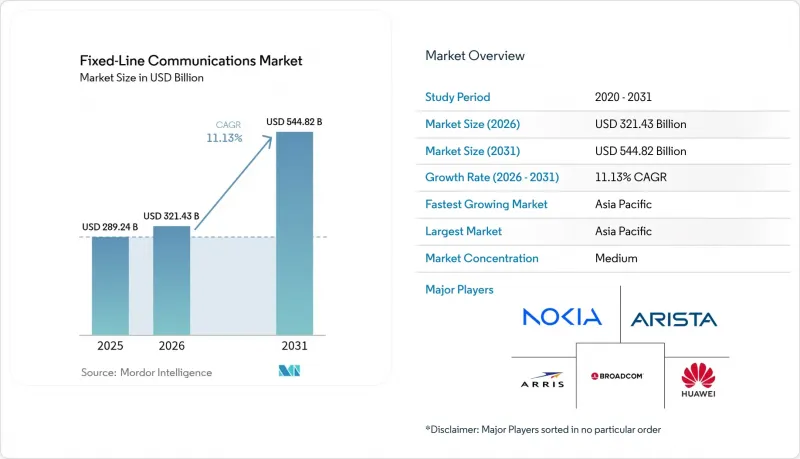
本報告按產品類型(傳輸設備、交換設備等)、服務類型(固定語音、固定寬頻資料等)、技術(數位用戶線路、同軸電纜(DOCSIS)等)、最終用戶(住宅、中小企業用戶、大型企業用戶等)和地區進行分類。
全球固網電信市場趨勢與洞察
都市區對Gigabit級寬頻的需求日益成長
主要亮點
- 隨著遠距辦公、多流4K影片和雲端遊戲的興起,千兆Gigabit服務已成為各大城市的標配。電信業者再也不能依賴曾經用來降低容量成本的超額訂閱規則,而是將對稱光纖鋪設到多用戶住宅的更深處,以確保高吞吐量的連結。混合用途建築中的企業租戶也要求獲得雲端備份和視訊協作所需的上行鏈路速度保障,這使得營運商能夠捆綁高級服務等級協定(SLA),從而提高每用戶平均收入(ARPU)。在人口密集地區部署光纖的投資回收期較短,促使營運商採取激進的促銷定價策略,以在5G固定無線替代方案普及之前搶佔市場佔有率。市政數位股權政策透過補貼低收入家庭的網路連線費用,進一步推動了光纖網路的普及,隨著光纖基礎設施的部署,間接帶動了高級套餐訂閱量的成長。
現有和新興電信業者的大規模光纖到戶部署
現有電信公司正從分階段升級銅線轉向全面光纖化。 AT&T承諾在2026年為3,000萬戶家庭提供光纖到府(FTTH)服務,就充分體現了這一點。由基礎設施基金支持的新興電信公司(替代網路營運商)正在迅速佔領服務不足的郊區,迫使老牌公司加快響應速度以保護其基本客群。諸如美國經濟活動基礎發展計劃(BEAD)之類的補貼項目正在向農村基礎設施建設投入數十億美元,進一步增強了「深度光纖」的成本優勢。將快速部署技術(微型溝槽、基於連接器的入戶線)與管道再利用相結合,可以降低每戶的資本支出(CAPEX),即使在中等密度地區也能保持可觀的內部收益率(IRR)。從長遠來看,建立一個無所不在的光纖平台將使電信公司能夠託管邊緣運算並向提升銷售私有5G服務。
最後一公里光纖網路建設需要高額資本投入和較長的投資回報週期。
在農村地區為一棟建築物安裝光纖電纜的成本可能超過1000美元,而在岩石或山區,這筆費用還會飆升。小規模的電信業者無法享有規模經濟效益,面臨更高的資金籌措成本,而債務協議往往會延誤部署進度。當工人需要在電線杆安裝光纖時,圍繞準備和安裝費用的法律糾紛可能會導致數月延誤。認證光纖技術人員薪資的上漲加劇了這個問題,一些市場甚至提供以前只有行動網路工程師才能享受的簽約獎金。雖然政府津貼可以涵蓋部分建設成本,但對認證供應商和技術的限制可能會推高專案總成本,並可能延長投資回收期,使其超過一般投資者的預期。
細分市場分析
預計2025年,光纖電纜將佔銷售額的28.02%,鞏固其在固定通訊市場流量傳輸的主力地位。對800G連貫傳輸日益成長的需求迫使營運商加快室外基礎設施的升級,相關的光纖終端和被動分路器推動接入設備支出以13.45%的複合年成長率成長。隨著營運商用可插拔模組取代老舊的100G光學模組,傳輸設備供應商從中受益,這些可插拔模組可將每位元功耗降低一半,並提高整體網路效率。此外,中心機房內用於軟體定義控制平面的高效能葉脊式網路架構的需求也推動了交換設備銷售額的相應成長。
隨著Wi-Fi 7路由器和網狀節點在家庭中的普及,用戶端設備(CPE)也持續邁向千兆Gigabit網路。供應商現在將Wi-Fi管理分析功能與CPE捆綁銷售,使營運商能夠遠端排查家庭網路效能問題,從而減少上門服務次數。同時,預計到2024年,固定無線CPE的出貨量將超過DOCSIS調變解調器,這表明在某些部署場景下,無線方案是可行的,儘管光纖固定通訊市場在規模上仍然佔據主導地位。
預計到2025年,固定寬頻資訊服務將佔總收入的68.45%,這證實了按通話時長收費向頻寬貨幣化的不可逆轉的轉變。 IPTV和其他增值平台將緊隨其後,年複合成長率達12.05%,反映出電信業者正將其現有的光纖投資轉化為持續的內容和雲端遊戲收入。隨著企業向雲端PBX服務遷移,以及家庭對行動電話的依賴日益加深,傳統固定語音服務將持續長期下滑。
整合了連接、網路安全和邊緣運算編配的託管服務包正日益受到歡迎,尤其是在沒有內部IT團隊的中型企業中。透過網路上的人工智慧引擎增強的影片分析功能,可以實現高度精準的廣告投放,從而在無需額外資本支出 (CAPEX) 的情況下提高利潤率。
區域分析
預計到2025年,亞太地區將佔全球收入的38.45%,並以11.18%的複合年成長率成長,鞏固其作為固網通訊市場最大參與者的地位。中國的「10G城市網路」政策正在推動全國的光纖部署,而印度的「數位印度」計畫則在促進公私合作,每年鋪設超過50萬公里的新光纖。日本和韓國的電信業者正在升級到25G和50G PON,以支援身臨其境型媒體和工業自動化。
在北美,BEAD計劃正被用於解決遍遠地區差異問題。一級營運商正在加快在都市區的部署,與衛星寬頻供應商展開競爭,同時力求長期用戶。 Verizon固定無線用戶數量的成長凸顯了替代風險,但電線杆安裝法規的改革縮短了許可證的等待時間,使得光纖鋪設量創下以季度為基礎新高。加拿大的開放接取法規要求現有業者批發光纖環路,這刺激了零售競爭,並在不影響網路所有者盈利的前提下提高了光纖普及率。
歐洲的「Gigabit基礎設施法案」透過簡化鑽井許可程序和強制執行「單次鑽井」調整,使土木工程成本降低了兩位數。在法國和西班牙,光纖到府(FTTH)的普及率現已超過75%,這表明一旦Gigabit服務(曾經的普及型服務)可用,市場需求將保持強勁。在德國,由私募股權投資支持的替代網路正在加速推進,此前緩慢的部署進程正在加速。與此同時,英國的「Gigabit項目」競標正在將服務覆蓋範圍擴大到難以覆蓋的地區。
其他好處:
- Excel格式的市場預測(ME)表
- 3個月的分析師支持
目錄
第1章:引言
- 研究假設和市場定義
- 調查範圍
第2章:調查方法
第3章執行摘要
第4章 市場狀況
- 市場概覽
- 市場促進因素
- 大都會地區對Gigabit級寬頻的需求日益成長
- 現有營運商和替代電信業者大規模部署 FTTH(光纖到府)。
- 雲端/超大規模資料中心回程傳輸需求
- 政府普遍服務和補貼計劃(BEAD、RDOF、歐盟CEF-2)
- 重複利用現有銅管可以降低土木工程成本(這一點尚未充分報告)。
- 提高邊緣運算密度需要超低延遲固網(這一點尚未充分報告)。
- 市場限制因素
- 最後一公里光纖網路建設需要高額資本投入和較長的投資回收期。
- 5G FWA 和衛星寬頻的其他風險
- 缺乏技術純熟勞工來連接和測試光纖電纜
- 地方政府道路用地徵用和電線杆安裝延誤(報告不足)
- 價值鏈分析
- 監理情勢
- 技術展望
- 波特五力分析
- 投資分析
第5章 市場規模與成長預測
- 依產品類型
- 輸電設備
- 切換裝置
- 接取設備(DSLAM、OLT 等)
- 客戶家中的設備(路由器、機上盒、光網路終端)
- 光纖電纜
- 其他
- 按服務類型
- 固定語音
- 固定寬頻數據
- IPTV/附加價值服務
- 透過技術
- 數位用戶線路(DSL)
- 同軸(Docsis)
- 光纖(FTTx/FTTH)
- 混合光纖同軸電纜
- 最終用戶
- 住宅
- 小型企業
- 大公司
- 政府/公共部門
- 資料中心
- 按地區
- 北美洲
- 美國
- 加拿大
- 墨西哥
- 南美洲
- 巴西
- 阿根廷
- 其他南美國家
- 歐洲
- 德國
- 英國
- 法國
- 俄羅斯
- 其他歐洲國家
- 亞太地區
- 中國
- 印度
- 日本
- 韓國
- ASEAN
- 其他亞太國家
- 中東和非洲
- 中東
- 沙烏地阿拉伯
- 阿拉伯聯合大公國
- 土耳其
- 其他中東國家
- 非洲
- 南非
- 奈及利亞
- 其他非洲國家
- 中東
- 北美洲
第6章 競爭情勢
- 市場集中度
- 策略趨勢
- 市佔率分析
- 公司簡介
- Huawei Technologies Co. Ltd
- Cisco Systems Inc.
- Nokia Corp.
- ZTE Corp.
- Broadcom Inc.
- Arris(CommScope)
- Arista Networks Inc.
- Avaya Inc.
- Allied Telesis Inc.
- Corning Inc.
- Prysmian Group
- Adtran Inc.
- Calix Inc.
- DZS Inc.
- Ribbon Communications
- Telefonaktiebolaget LM Ericsson
- Juniper Networks Inc.
- FiberHome Telecommunication
- CommScope Holding Co.
- NEC Corp.
第7章 市場機會與未來展望
According to Mordor Intelligence, fixed-line communications market size in 2026 is estimated at USD 321.43 billion, growing from 2025 value of USD 289.24 billion with 2031 projections showing USD 544.82 billion, growing at 11.13% CAGR over 2026-2031.
This report is Segmented by Product Type (Transmission Equipment, Switching Equipment, and More), Service Type (Fixed Voice, Fixed Broadband Data, and More), Technology (Digital Subscriber Line, Coaxial (Docsis), and More), End User (Residential, Small and Medium Enterprises, Large Enterprises, and More), and Geography.
Global Fixed-Line Communications Market Trends and Insights
Rising demand for gigabit-speed broadband in urban clusters
Key Highlights
- Remote work, multi-stream 4K video, and cloud gaming have made multi-gigabit service a baseline expectation in major cities. Operators can no longer rely on oversubscription rules that once kept capacity costs in check; instead, they push symmetric fiber deeper into apartment blocks to guarantee high-throughput paths. Enterprise tenants in mixed-use buildings additionally request guaranteed uplink speeds for cloud backup and video collaboration, allowing carriers to bundle premium SLAs at higher average revenue per user. Dense geography shortens fiber build paybacks, encouraging aggressive promotional pricing that locks in market share before 5G fixed-wireless alternatives gain traction. Municipal digital-equity policies further amplify adoption by underwriting low-income household connections, indirectly boosting take rates for premium tiers once the fiber is in place.
Massive fiber-to-the-home roll-outs by incumbents and altnets
Incumbent telcos have shifted from incremental copper upgrades to full-scale fiber replacement, as seen in AT&T's pledge to pass 30 million premises with FTTH by 2026. Challenger altnets, backed by infrastructure funds, pick off pockets of under-served suburbs, forcing faster reactions from legacy operators eager to defend their base. Subsidy frameworks such as BEAD in the United States redirect billions toward rural builds, further tilting the cost equation in favor of deep fiber. The combination of faster deployment techniques (micro-trenching, connectorized drops) and duct re-use lowers capex per home, keeping internal rates of return attractive even in mid-density territories. Longer term, establishing a ubiquitous fiber platform positions carriers to upsell edge-compute hosting and private 5G services.
High capex and long ROI cycles for last-mile fiber
Passing a single rural premise can cost more than USD 1,000, a figure that climbs sharply in rocky or mountainous terrain. Smaller carriers without scale economics shoulder significantly higher financing costs, and their debt covenants often dictate slower roll-out schedules. Where crews must attach fiber to utility poles, make-ready work and legal disputes over attachment fees add months of delay. Wage inflation for certified fiber splicers compounds the problem, with some markets offering signing bonuses that previously only mobile-network engineers received. Although government grants defray part of the build expense, restrictions on permissible vendors or technology can push total project cost back up, stretching payback periods beyond typical investor horizons.
Other drivers and restraints analyzed in the detailed report include:
- Cloud/hyperscale data-center back-haul requirements
- Government universal-service and subsidy programs (BEAD, RDOF, EU CEF-2)
- Substitution risk from 5G fixed-wireless and satellite broadband
For complete list of drivers and restraints, kindly check the Table Of Contents.
Segment Analysis
Fiber-optic cables generated 28.02% of revenue in 2025, cementing their position as the volume backbone of the fixed-line communications market. Intensifying demand for 800 G coherent transmission pushes operators to accelerate outside-plant upgrades, while associated optical line terminals and passive splitters lift access-equipment spend at a 13.45% CAGR. Transmission-equipment vendors benefit as carriers swap legacy 100 G optics for pluggables that halve power per bit, enhancing total network efficiency. Switching gear revenue expands in tandem because software-defined control planes require high-performance leaf-spine fabrics inside central offices.
Customer-premises equipment continues to ride the multi-gigabit wave as households adopt Wi-Fi 7 routers and mesh nodes. Vendors now bundle managed Wi-Fi analytics that let carriers troubleshoot in-home performance remotely, reducing truck rolls. Meanwhile, fixed-wireless CPE shipments overtook DOCSIS modems in 2024, showing that wireless substitution can capture specific deployment scenarios even as the fixed-line communications market size for fiber remains dominant.
Fixed broadband data services accounted for 68.45% of total 2025 revenue, confirming the irreversible pivot from minutes-based billing to bandwidth monetization. IPTV and other value-added platforms follow with a 12.05% CAGR, reflecting how carriers translate sunk fiber investments into recurring content and cloud-gaming revenue. Traditional fixed voice continues its secular slide as enterprises migrate to cloud PBX offerings and households rely exclusively on mobile.
Managed service bundles that merge connectivity with cybersecurity and edge-compute orchestration gain favor, especially among mid-sized enterprises lacking in-house IT teams. Enhanced video analytics powered by on-network AI engines enable ultra-targeted advertising, adding incremental margins without additional capex.
Complete Report Scope:
- By Product Type
- Transmission Equipment
- Switching Equipment
- Access Equipment (DSLAM, OLT, etc.)
- Customer-Premises Equipment (Routers, STB, ONT)
- Fiber-optic Cables
- Others
- By Service Type
- Fixed Voice
- Fixed Broadband Data
- IPTV / Value-added Services
- By Technology
- Digital Subscriber Line
- Coaxial (Docsis)
- Fiber (FTTx/FTTH)
- Hybrid Fiber-Coax
- By End User
- Residential
- Small and Medium Enterprises
- Large Enterprises
- Government and Public Sector
- Data Centers
- By Geography
- North America
- United States
- Canada
- Mexico
- South America
- Brazil
- Argentina
- Rest of South America
- Europe
- Germany
- United Kingdom
- France
- Russia
- Rest of Europe
- Asia Pacific
- China
- India
- Japan
- South Korea
- ASEAN
- Rest of Asia Pacific
- Middle East and Africa
- Middle East
- Saudi Arabia
- United Arab Emirates
- Turkey
- Rest of Middle East
- Africa
- South Africa
- Nigeria
- Rest of Africa
- Middle East
- North America
Geography Analysis
Asia Pacific retained 38.45% of 2025 revenue and is projected to expand at an 11.18% CAGR, cementing its position as the largest fixed-line communications market. China's mandate for 10 G city networks drives nationwide fiber deployment, while India's Digital Bharat program triggers public-private joint ventures that add more than 0.5 million route-kilometers annually. Japanese and Korean operators upgrade to 25 G and 50 G PON to support immersive media and industrial automation.
North America leverages the BEAD program to close rural gaps. Tier-1 carriers accelerate urban builds, racing satellite broadband players to lock in long-term subscribers. Verizon's fixed-wireless subscriber gains highlight substitution risk, yet fiber build counts hit new quarterly highs as pole-attachment reforms shorten permitting queues. Canadian open-access rules compel incumbents to wholesale fiber loops, fostering retail competition that stimulates take-rates without eroding network-owner economics.
Europe's Gigabit Infrastructure Act streamlines trenching approvals and enforces "dig-once" coordination, cutting civil-works costs by double digits. France and Spain now post FTTH take-up rates above 75%, proving demand elasticity once ubiquitous gigabit service is available. Germany's late start accelerates on the back of private-equity-funded altnets, while the United Kingdom's Project Gigabit auctions extend coverage to hard-to-reach hamlets.
- Huawei Technologies Co. Ltd
- Cisco Systems Inc.
- Nokia Corp.
- ZTE Corp.
- Broadcom Inc.
- Arris (CommScope)
- Arista Networks Inc.
- Avaya Inc.
- Allied Telesis Inc.
- Corning Inc.
- Prysmian Group
- Adtran Inc.
- Calix Inc.
- DZS Inc.
- Ribbon Communications
- Telefonaktiebolaget LM Ericsson
- Juniper Networks Inc.
- FiberHome Telecommunication
- CommScope Holding Co.
- NEC Corp.
Additional Benefits:
- The market estimate (ME) sheet in Excel format
- 3 months of analyst support
TABLE OF CONTENTS
1 INTRODUCTION
- 1.1 Study Assumptions and Market Definition
- 1.2 Scope of the Study
2 RESEARCH METHODOLOGY
3 EXECUTIVE SUMMARY
4 MARKET LANDSCAPE
- 4.1 Market Overview
- 4.2 Market Drivers
- 4.2.1 Rising demand for gigabit-speed broadband in urban clusters
- 4.2.2 Massive fiber-to-the-home (FTTH) roll-outs by incumbents and altnets
- 4.2.3 Cloud/hyperscale data-center back-haul requirements
- 4.2.4 Government universal-service and subsidy programs (BEAD, RDOF, EU CEF-2)
- 4.2.5 Repurposing of legacy copper ducts lowers civil-works cost (under-reported)
- 4.2.6 Edge-compute densification needs ultra-low-latency fixed links (under-reported)
- 4.3 Market Restraints
- 4.3.1 High capex and long ROI cycles for last-mile fiber
- 4.3.2 Substitution risk from 5G FWA and satellite broadband
- 4.3.3 Skilled-labor shortages for fiber splicing and testing
- 4.3.4 Municipal right-of-way and pole-attachment delays (under-reported)
- 4.4 Value Chain Analysis
- 4.5 Regulatory Landscape
- 4.6 Technological Outlook
- 4.7 Porter's Five Forces Analysis
- 4.7.1 Threat of New Entrants
- 4.7.2 Bargaining Power of Buyers
- 4.7.3 Bargaining Power of Suppliers
- 4.7.4 Threat of Substitutes
- 4.7.5 Competitive Rivalry
- 4.8 Investment Analysis
5 MARKET SIZE AND GROWTH FORECASTS (VALUE)
- 5.1 By Product Type
- 5.1.1 Transmission Equipment
- 5.1.2 Switching Equipment
- 5.1.3 Access Equipment (DSLAM, OLT, etc.)
- 5.1.4 Customer-Premises Equipment (Routers, STB, ONT)
- 5.1.5 Fiber-optic Cables
- 5.1.6 Others
- 5.2 By Service Type
- 5.2.1 Fixed Voice
- 5.2.2 Fixed Broadband Data
- 5.2.3 IPTV / Value-added Services
- 5.3 By Technology
- 5.3.1 Digital Subscriber Line
- 5.3.2 Coaxial (Docsis)
- 5.3.3 Fiber (FTTx/FTTH)
- 5.3.4 Hybrid Fiber-Coax
- 5.4 By End User
- 5.4.1 Residential
- 5.4.2 Small and Medium Enterprises
- 5.4.3 Large Enterprises
- 5.4.4 Government and Public Sector
- 5.4.5 Data Centers
- 5.5 By Geography
- 5.5.1 North America
- 5.5.1.1 United States
- 5.5.1.2 Canada
- 5.5.1.3 Mexico
- 5.5.2 South America
- 5.5.2.1 Brazil
- 5.5.2.2 Argentina
- 5.5.2.3 Rest of South America
- 5.5.3 Europe
- 5.5.3.1 Germany
- 5.5.3.2 United Kingdom
- 5.5.3.3 France
- 5.5.3.4 Russia
- 5.5.3.5 Rest of Europe
- 5.5.4 Asia Pacific
- 5.5.4.1 China
- 5.5.4.2 India
- 5.5.4.3 Japan
- 5.5.4.4 South Korea
- 5.5.4.5 ASEAN
- 5.5.4.6 Rest of Asia Pacific
- 5.5.5 Middle East and Africa
- 5.5.5.1 Middle East
- 5.5.5.1.1 Saudi Arabia
- 5.5.5.1.2 United Arab Emirates
- 5.5.5.1.3 Turkey
- 5.5.5.1.4 Rest of Middle East
- 5.5.5.2 Africa
- 5.5.5.2.1 South Africa
- 5.5.5.2.2 Nigeria
- 5.5.5.2.3 Rest of Africa
- 5.5.5.1 Middle East
- 5.5.1 North America
6 COMPETITIVE LANDSCAPE
- 6.1 Market Concentration
- 6.2 Strategic Moves
- 6.3 Market Share Analysis
- 6.4 Company Profiles (includes Global level Overview, Market level overview, Core Segments, Financials, Strategic Information, Market Rank/Share, Products and Services, Recent Developments)
- 6.4.1 Huawei Technologies Co. Ltd
- 6.4.2 Cisco Systems Inc.
- 6.4.3 Nokia Corp.
- 6.4.4 ZTE Corp.
- 6.4.5 Broadcom Inc.
- 6.4.6 Arris (CommScope)
- 6.4.7 Arista Networks Inc.
- 6.4.8 Avaya Inc.
- 6.4.9 Allied Telesis Inc.
- 6.4.10 Corning Inc.
- 6.4.11 Prysmian Group
- 6.4.12 Adtran Inc.
- 6.4.13 Calix Inc.
- 6.4.14 DZS Inc.
- 6.4.15 Ribbon Communications
- 6.4.16 Telefonaktiebolaget LM Ericsson
- 6.4.17 Juniper Networks Inc.
- 6.4.18 FiberHome Telecommunication
- 6.4.19 CommScope Holding Co.
- 6.4.20 NEC Corp.
7 MARKET OPPORTUNITIES AND FUTURE OUTLOOK
- 7.1 White-space and Unmet-need Assessment

 數位微波通訊市場分析及預測(至2035年):類型、產品、服務、技術、組件、應用、部署、最終用戶、功能
 毫微微基地台設備市場規模、佔有率和成長分析:按組件、技術、應用、最終用戶、部署類型和地區分類-2026-2033年產業預測
 食品市場RFID及NFC標籤:市場機會、成長要素、產業趨勢分析及2026-2035年預測
 通訊網路編配市場預測至2034年-按組件、網路類型、部署模式、架構、技術、最終用戶和地區分類的全球分析
 通訊設備市場:按產品類型、技術、部署模式和最終用戶分類的全球市場預測 – 2026-2032 年
 2026年全球網路編配市場報告通訊硬體市場:2026-2032年全球市場預測(依產品類型、技術、連接方式、最終用戶產業和部署類型分類)2026年全球直徑邊緣處理劑市場報告2026年全球通訊硬體市場報告2026年全球通用通訊設備市場報告