


 |
市場調查報告書
商品編碼
2122568
浮體式海上風力發電:市場佔有率分析、產業趨勢與統計及成長預測(2026-2031 年)Floating Offshore Wind Power - Market Share Analysis, Industry Trends & Statistics, Growth Forecasts (2026 - 2031) |
||||||

※ 本網頁內容可能與最新版本有所差異。詳細情況請與我們聯繫。
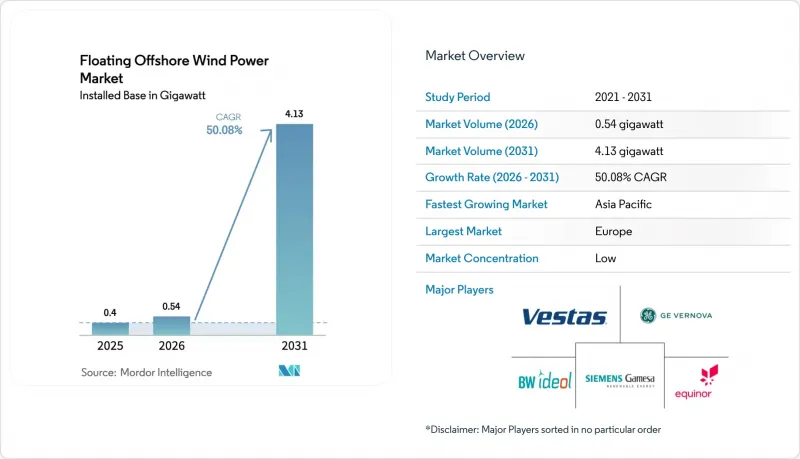
根據 Mordor Intelligence 預測,浮體式海上風電市場(按裝置容量計算)預計將從 2025 年的 0.4 吉瓦和 2026 年的 0.54 吉瓦成長到 2031 年的 4.13 吉瓦,2026 年至 2031 年的年複合成長率(CAGR) 508%。
本報告按水深(淺海、瞬態、深海)、浮體式平台類型(半潛式、超級浮標等)、渦輪機輸出功率(5MW以下、5-10MW、11-15MW、15MW以上)、應用階段(商業化前試點計畫、商業公用事業規模、混合「風能製氫」)和地區分類(北美、歐洲、亞地區分類(北美、歐洲、南美)。
全球浮體式海上風電市場趨勢與洞察
增加美國和亞太地區深海域的租賃權授予。
2024年,美國海洋能源管理局(BOEM)在加州和奧勒岡州沿海地區授予了4.6吉瓦的海上浮式發電裝置容量租賃權,刺激了對能夠承受1200公尺水深和地震荷載的錨碇系統的投資。隨後,日本經濟產業省在第二輪租賃區授予了1.8吉瓦的裝置容量,並強制要求採用抗颱風設計,且在地採購比例達40%。韓國第八個電力供應計畫設定了2030年實現6吉瓦浮體式發電裝置容量的目標,並將資金引導至蔚山和濟州島,因為在這些水深150公尺的地區,單樁結構施工無法實現。台灣2026年的電力分配計畫為浮體式計畫分配了3吉瓦的裝置容量,並鼓勵採用張力腿系統的先導計畫。雖然授予租賃權降低了審核流程中的風險,但加州 Moss Landing 和 Diablo Canyon 變電站周圍的擁塞情況已將電網連接等待名單延長至 2029 年。
渦輪機尺寸迅速增大到 15-20 MW 級別,降低了平準化電成本。
西門子歌美颯的15兆瓦「SG 14-236 DD」和維斯塔斯的「V236-15MW」風力發電機將於2025年開始量產,這兩款機組將使1吉瓦規模項目的基礎成本降低近一半,並減少1.8億美元的電廠配套設備(BOP)成本。通用電氣Vernova的14兆瓦「Haliade-X」機型針對微風環境進行了最佳化,並擴大了紐約州的可租賃區域。明陽和金風科技已開發出16兆瓦原型機,展示了兩段式葉片、軌道運輸和更長的維護週期。預計每兆瓦裝置容量的資本支出將從2024年的420萬美元降至2028年的310萬美元。
由於 WTIV 和 FIV 船隻短缺,每日工資已超過 45 萬美元。
到2025年,僅有23艘能夠安裝15兆瓦級風力發電機的風力發電機機安裝船(WTIV),然而到2028年,全球將有47吉瓦規模的專案需要安裝。由於運轉率超過95%,租船費用已飆升至每天48.5萬美元,導致加州莫羅灣風電場的建設延期兩年,而一個500兆瓦項目的船舶成本也已飆升至8700萬美元。目前,造船廠正在建造14艘新的WTIV,預計將於2026年至2027年交付,但2027年之前供應緩解的措施仍然有限。
細分市場分析
到2025年,全球54.1%的離岸風電裝置容量將位於水深30至60公尺的過渡水域,其中大部分位於北海附近。在北海,混合重力錨降低了錨碇成本。水深超過60公尺的深海區域正以58.2%的複合年成長率快速擴張,釋放出加州、日本和挪威沿海地區巨大的技術潛力。預計到2031年,深海浮體式海上風電市場規模將達2,900兆瓦。加州的莫羅灣地區充分展現了其經濟可行性。雖然在1000公尺水深使用吸力錨點時,每兆瓦的資本成本躍升至410萬美元,但該地區擁有25吉瓦的海上風能資源,足以抵銷這一成本增加。日本五島和韓國蔚山的租賃場地也反映了類似的深度依賴性經濟效益。
在水深不足30公尺的淺水區,僅進行了示範性實驗。歐洲的多個先導計畫在平靜水域測試了該平台的性能,之後才將其推廣到更具挑戰性的環境中。同時,深海域部署則依賴錨碇技術的創新,例如Vryhof公司的STEVMANTA吸盤錨,該技術可將錨的數量從四個減少到三個,並將安裝時間縮短25%。
半潛式平台憑藉其模組化結構和與15-20兆瓦風力發電機組的兼容性,預計到2025年將佔裝置容量的55.8%。 Principle Power公司的「WindFloat」平台吃水僅4米,可從碼頭拖曳,並可在現場進行安定器載和固定。 SPAR浮標的成長速度最快,年複合成長率達55.3%,這得益於亞洲造船廠大規模採用鋼材輥壓成型工藝,以及其即使在颱風等惡劣海況下也具有出色的縱搖穩定性。因此,預計到2031年,SPAR浮標在浮體式海上風電市場的佔有率將快速成長。
張力腳平臺佔了12%的市場佔有率,主要用於海底黏土層堅實且可使用垂直繫泊裝置以最大限度減少樞紐形成的海域。諸如BW Ideol的「Damping Pool」和Hexicon的「TwinWind Duet」等混合動力駁船概念旨在透過共用錨碇設施來降低錨泊成本,但目前仍處於試點階段。
區域分析
預計到2025年,歐洲將佔全球總裝置容量的53.6%,主要得益於英國的ScotWind離岸風電租賃專案、法國的Golf du Lion離岸風競標以及挪威的石油平台脫碳計畫。至2031年,歐洲浮體式海上風電市場規模預計將超過2000兆瓦。英國的政策規定了25%的在地採購要求,這推動了阿伯丁和因弗內斯港口基礎設施的維修,並維持了對半潛式平台建造的需求。在法國,一項為期15年、價格為120歐元/兆瓦時的差價合約(CfD)以及在地中海的駁船部署,確保了可預測的收入和當地造船廠的運作。西班牙、義大利和北歐國家也紛紛效仿,制定了規模較小但發展迅速的配額計劃,並將部分電力與水產養殖和海水淡化設施共享。
亞太地區呈現最強勁的成長勢頭,年複合成長率高達53.3%。中國廣東省和福建省在「十四五」規劃中設定了5吉瓦的裝置容量目標,計畫安裝來自明陽和金風科技的16兆瓦風力發電機組。日本第二輪競標協議(1.8吉瓦)包含強制性的綠色氨合成技術,而韓國蔚山氫能城則將500兆瓦的風電與200兆瓦的PEM電解槽連接起來。台灣地區2026年的競標確保3吉瓦的浮體式項目裝置容量,並規定60%的在地採購比例,以扶持台灣本土的電纜和錨碇設備供應商。
在北美,巴西石油公司(Petrobras)獲得了加州和奧勒岡州沿海4.6吉瓦的租賃權,但由於與美國環保署(ESA)就北太平洋露脊鯨問題進行磋商,許可證的批准被推遲了18個月。目前,開發商正在承擔被動聲學監測和季節性作業限制的費用,預計發電將推遲到2030年。同時,墨西哥灣的一個平台改造計畫透過利用閒置鑽機和現有海底基礎設施,減少了35%的資本投資。南美洲以及中東和非洲地區仍處於開發初期。巴西石油公司正在考慮改造里約熱內盧沿海一座現有的150兆瓦設施,而阿拉伯聯合大公國正在評估阿布達比附近一個200兆瓦的項目,該項目旨在出口綠色氫能。
其他好處:
- Excel格式的市場預測(ME)表
- 3個月的分析師支持
目錄
第1章:引言
- 研究假設和市場定義
- 調查範圍
第2章:調查方法
第3章執行摘要
第4章 市場狀況
- 市場概覽
- 市場促進因素
- 美國和亞太地區深海區域授予的租賃協議數量增加。
- 渦輪機尺寸迅速增大到 15-20 MW 級別,導致平準化度電成本下降。
- 改造石油和天然氣平台將重振墨西哥灣的供應鏈。
- 歐盟和英國的差價合約改革正在提高專案資金籌措的可能性。
- 各國氫能發展藍圖正催生相關設施的需求。
- 亞洲海底電纜和船舶的擴張正在縮短安裝週期。
- 市場限制因素
- 由於 WTIV 和 FIV 船隻短缺,日工資超過 45 萬美元。
- 在先導計畫中,50-100公尺深處發生高壓動態電纜故障。
- 加州《瀕危物種法案》(ESA) 中有關露脊鯨的規定正在延緩美國海洋能源管理局 (BOEM) 的許可證申請流程。
- 現貨鋼材價格波動(高於950美元/噸)正對浮式造船廠造成干擾。
- 供應鏈分析
- 監理展望
- 技術展望
- 主要項目資訊
- 主要現有項目
- 未來項目
- 波特五力模型
- 投資分析
第5章 市場規模與成長預測
- 按水深
- 淺水區(最深30公尺)
- 過渡區(30-60公尺)
- 深海(超過60公尺)
- 浮體式平台的類型
- 半潛式
- 斯帕爾浮標
- 張力腿平台(TLP)
- 駁船和混合動力概念
- 按渦輪機輸出
- 5兆瓦或以下
- 5~10 MW
- 11~15 MW
- 15兆瓦或以上
- 按應用階段
- 商業化前的試點階段
- 商業公用事業規模
- 混合風能氫氣生產、海水淡化
- 按地區
- 北美洲
- 美國
- 其他北美國家
- 歐洲
- 法國
- 英國
- 西班牙
- 北歐國家
- 義大利
- 其他歐洲國家
- 亞太地區
- 中國
- 日本
- 韓國
- 其他亞太國家
- 南美洲
- 巴西
- 阿根廷
- 其他南美國家
- 中東和非洲
- 阿拉伯聯合大公國
- 沙烏地阿拉伯
- 南非
- 其他中東和非洲國家
- 北美洲
第6章 競爭情勢
- 市場集中度
- 策略趨勢(併購、聯盟、購電協議)
- 市場佔有率分析(主要公司的市場排名和佔有率)
- 公司簡介
- Siemens Gamesa Renewable Energy SA
- Vestas Wind Systems A/S
- GE Vernova(GE Renewable Energy)
- BW Ideol AS
- Equinor ASA
- Orsted A/S
- Principle Power Inc.
- Aker Solutions ASA
- Hexicon AB
- TotalEnergies SE
- Shell plc
- Ocean Winds(EDPR/ENGIE)
- Copenhagen Infrastructure Partners
- RWE AG
- Marubeni Corporation
- Doosan Enerbility Co., Ltd
- MingYang Smart Energy
- Goldwind Science & Technology
- Cobra IS(Grupo ACS)
- Gazelle Wind Power Ltd.
第7章 市場機會與未來展望
According to Mordor Intelligence, the floating offshore wind power market size in terms of installed base is projected to expand from 0.4 gigawatt in 2025 and 0.54 gigawatt in 2026 to 4.13 gigawatt by 2031, registering a CAGR of 50.08% between 2026 to 2031.
This report is Segmented by Water Depth (Shallow, Transitional, and Deep), Floating Platform Type (Semi-Submersible, Spar-Buoy, and More), Turbine Capacity (Up To 5 MW, 5 To 10 MW, 11 To 15 MW, and Above 15 MW), Application Stage (Pre-Commercial Pilot, Commercial Utility-Scale, and Hybrid Wind-To-X), and Geography (North America, Europe, Asia-Pacific, South America, and Middle East and Africa).
Global Floating Offshore Wind Power Market Trends and Insights
Growing Lease Awards in U.S. & APAC Deep-Water Zones
The Bureau of Ocean Energy Management's award of 4.6 GW of leases off California and Oregon in 2024 moved investment toward mooring systems able to withstand 1,200 m depths and seismic loads. Japan's Ministry of Economy, Trade and Industry followed with 1.8 GW of Round 2 zones that impose typhoon-resilient design and 40% local-content rules. South Korea's 8th power-supply plan sets a 6 GW floating target for 2030, steering capital to Ulsan and Jeju, where 150-m depths preclude monopiles. Taiwan's 2026 allocation earmarks 3 GW for floating projects, incentivizing tension-leg pilots. Lease awards de-risk permitting, yet California's interconnection queue stretches to 2029 because of congestion around Moss Landing and Diablo Canyon substations.
Rapid Turbine Upsizing to 15-20 MW Class Reducing LCOE
Serial production of Siemens Gamesa's 15 MW SG 14-236 DD and Vestas' V236-15 MW turbines began in 2025, each cutting foundation costs for 1 GW projects by nearly half and slicing balance-of-plant expenses by USD 180 million. GE Vernova's 14 MW Haliade-X variant optimized for low-wind regimes enlarges viable lease zones in New York State. MingYang and Goldwind achieved 16 MW prototypes, validating two-piece blades, rail transport, and extended service intervals. Capex per installed megawatt is tracking from USD 4.2 million in 2024 toward USD 3.1 million by 2028.
WTIV & FIV Vessel Shortage Driving Day Rates Above USD 450k
Only 23 wind-turbine installation vessels (WTIVs) can handle 15 MW machines in 2025, yet 47 GW of projects need lifting through 2028. As utilization exceeds 95%, charter prices rose to USD 485,000 per day, postponing California's Morro Bay array by two years and inflating a 500 MW project's vessel bill to USD 87 million. Shipyards are building 14 new WTIVs for 2026-27 delivery, but supply relief before 2027 remains limited.
Other drivers and restraints analyzed in the detailed report include:
- Oil & Gas Platform Conversions Unlocking Gulf of Mexico Supply Chain
- EU & UK CfD Reform Boosting Bankability
- High-Voltage Dynamic Cable Failures in 50-100 m Depth Pilots
For complete list of drivers and restraints, kindly check the Table Of Contents.
Segment Analysis
Transitional depths of 30-60 m represented 54.1% of global installations in 2025, largely around the North Sea, where hybrid gravity anchors lower mooring costs. Deep-water sites beyond 60 m are on pace for a 58.2% CAGR, unlocking the vast technical potential off California, Japan, and Norway. The Floating Offshore Wind Power market size for the Deep segment is projected to reach 2,900 MW by 2031. California's Morro Bay area highlights the economics: suction anchors rated for 1,000-m depths lift capital expense to USD 4.1 million per MW, yet access to 25 GW of wind resource offsets that premium. Japan's Goto leases and South Korea's Ulsan sites confirm similar depth-driven economics.
Shallow settings under 30 m captured only demonstration activity. Several European pilots used benign waters to test platform behavior before scaling to harsher seas. Meanwhile, Deep-water adoption relies on mooring innovation such as Vryhof's STEVMANTA suction anchor, which reduces anchor count from four to three and slashes installation time by 25%.
Semi-submersibles contributed 55.8% of 2025 capacity, thanks to modular fabrication and compatibility with 15-20 MW turbines. Principle Power's WindFloat platform can be towed out from quays with only a 4 m draft and then ballasted in place. Spar-buoys show the fastest ascent with a 55.3% CAGR as Asian yards employ high-volume steel roll-forming and demonstrate remarkable pitch stability in typhoon seas. The Floating Offshore Wind Power market share of Spar-buoys is therefore set to expand sharply through 2031.
Tension-leg platforms hold a niche 12% share, appearing where firm seabed clay enables vertical tethers that minimize heave. Hybrid barge ideas like BW Ideol's Damping Pool or Hexicon's TwinWind duet aim to trim anchor costs by sharing moorings but remain at pilot scale.
Complete Report Scope:
- By Water Depth
- Shallow (Up to 30 m)
- Transitional (30 to 60 m)
- Deep (Above 60 m)
- By Floating Platform Type
- Semi-Submersible
- Spar-Buoy
- Tension-Leg Platform (TLP)
- Barge & Hybrid Concepts
- By Turbine Capacity
- Up to 5 MW
- 5 to 10 MW
- 11 to 15 MW
- Above 15 MW
- By Application Stage
- Pre-Commercial Pilot
- Commercial Utility-Scale
- Hybrid Wind-to-X (Hydrogen, Desalination)
- By Geography
- North America
- United States
- Rest of North America
- Europe
- France
- United Kingdom
- Spain
- Nordic Countries
- Italy
- Rest of Europe
- Asia-Pacific
- China
- Japan
- South Korea
- Rest of Asia-Pacific
- South America
- Brazil
- Argentina
- Rest of South America
- Middle East and Africa
- United Arab Emirates
- Saudi Arabia
- South Africa
- Rest of Middle East and Africa
- North America
Geography Analysis
Europe maintained 53.6% of installations in 2025, supported by the United Kingdom's ScotWind leases, France's Golfe du Lion tender, and Norway's oil-platform decarbonization schemes. The Floating Offshore Wind Power market size in Europe is expected to pass 2,000 MW by 2031. United Kingdom policy mandates 25% local content, prompting port upgrades at Aberdeen and Inverness and sustaining semi-submersible fabrication. France's 15-year CfDs at EUR 120/MWh and Mediterranean barge deployments provide predictable revenue and regional yard work. Spain, Italy, and Nordic nations follow with smaller yet fast-moving allocations that embed aquaculture or desalination co-use.
Asia-Pacific shows the strongest growth trajectory with a 53.3% CAGR. China's Guangdong and Fujian provinces target 5 GW under the 14th Five-Year Plan, deploying MingYang and Goldwind 16 MW turbines. Japan's 1.8 GW Round 2 leases include mandatory green-ammonia synthesis, while South Korea's Ulsan Hydrogen City connects 500 MW of wind to 200 MW of PEM electrolyzers. Taiwan's 2026 round reserves 3 GW for floating projects with 60% local content to develop domestic cable and mooring suppliers.
North America secured 4.6 GW of leases off California and Oregon, but ESA consultations for the North Pacific right whale extend permitting by 18 months. Developers now fund passive-acoustic monitoring and seasonal work restrictions, pushing the first power to 2030. Meanwhile, Gulf of Mexico platform conversions tap idle rigs and established subsea infrastructure to curb capex by 35%. South America and the Middle East & Africa remain nascent. Petrobras studies a 150 MW conversion off Rio de Janeiro, and the United Arab Emirates assesses 200 MW near Abu Dhabi for green-hydrogen export.
- Siemens Gamesa Renewable Energy SA
- Vestas Wind Systems A/S
- GE Vernova (GE Renewable Energy)
- BW Ideol AS
- Equinor ASA
- Orsted A/S
- Principle Power Inc.
- Aker Solutions ASA
- Hexicon AB
- TotalEnergies SE
- Shell plc
- Ocean Winds (EDPR/ENGIE)
- Copenhagen Infrastructure Partners
- RWE AG
- Marubeni Corporation
- Doosan Enerbility Co., Ltd
- MingYang Smart Energy
- Goldwind Science & Technology
- Cobra IS (Grupo ACS)
- Gazelle Wind Power Ltd.
Additional Benefits:
- The market estimate (ME) sheet in Excel format
- 3 months of analyst support
TABLE OF CONTENTS
1 Introduction
- 1.1 Study Assumptions & Market Definition
- 1.2 Scope of the Study
2 Research Methodology
3 Executive Summary
4 Market Landscape
- 4.1 Market Overview
- 4.2 Market Drivers
- 4.2.1 Growing Lease Awards in U.S. & APAC Deep-Water Zones
- 4.2.2 Rapid Turbine Upsizing to 15-20 MW Class Reducing LCOE
- 4.2.3 Oil & Gas Platform Conversions Unlocking Gulf of Mexico Supply Chain
- 4.2.4 EU & UK CfD Reform Boosting Bankability
- 4.2.5 National Hydrogen Roadmaps Creating Co-location Demand
- 4.2.6 Asian Cable-Vessel Build-out Shortening Installation Schedules
- 4.3 Market Restraints
- 4.3.1 WTIV & FIV Vessel Shortage Driving Day-rates > US$450k
- 4.3.2 High-Voltage Dynamic Cable Failures in 50-100 m Depth Pilots
- 4.3.3 California ESA Right-Whale Constraints Slowing BOEM Permits
- 4.3.4 Spot Steel Price Volatility (> US$950/t) Disrupting Floater Yards
- 4.4 Supply-Chain Analysis
- 4.5 Regulatory Outlook
- 4.6 Technological Outlook
- 4.7 Key Projects Information
- 4.7.1 Major Existing Projects
- 4.7.2 Upcoming Projects
- 4.8 Porter's Five Forces
- 4.8.1 Bargaining Power of Suppliers
- 4.8.2 Bargaining Power of Buyers
- 4.8.3 Threat of New Entrants
- 4.8.4 Threat of Substitutes
- 4.8.5 Competitive Rivalry
- 4.9 Investment Analysis
5 Market Size & Growth Forecasts
- 5.1 By Water Depth
- 5.1.1 Shallow (Up to 30 m)
- 5.1.2 Transitional (30 to 60 m)
- 5.1.3 Deep (Above 60 m)
- 5.2 By Floating Platform Type
- 5.2.1 Semi-Submersible
- 5.2.2 Spar-Buoy
- 5.2.3 Tension-Leg Platform (TLP)
- 5.2.4 Barge & Hybrid Concepts
- 5.3 By Turbine Capacity
- 5.3.1 Up to 5 MW
- 5.3.2 5 to 10 MW
- 5.3.3 11 to 15 MW
- 5.3.4 Above 15 MW
- 5.4 By Application Stage
- 5.4.1 Pre-Commercial Pilot
- 5.4.2 Commercial Utility-Scale
- 5.4.3 Hybrid Wind-to-X (Hydrogen, Desalination)
- 5.5 By Geography
- 5.5.1 North America
- 5.5.1.1 United States
- 5.5.1.2 Rest of North America
- 5.5.2 Europe
- 5.5.2.1 France
- 5.5.2.2 United Kingdom
- 5.5.2.3 Spain
- 5.5.2.4 Nordic Countries
- 5.5.2.5 Italy
- 5.5.2.6 Rest of Europe
- 5.5.3 Asia-Pacific
- 5.5.3.1 China
- 5.5.3.2 Japan
- 5.5.3.3 South Korea
- 5.5.3.4 Rest of Asia-Pacific
- 5.5.4 South America
- 5.5.4.1 Brazil
- 5.5.4.2 Argentina
- 5.5.4.3 Rest of South America
- 5.5.5 Middle East and Africa
- 5.5.5.1 United Arab Emirates
- 5.5.5.2 Saudi Arabia
- 5.5.5.3 South Africa
- 5.5.5.4 Rest of Middle East and Africa
- 5.5.1 North America
6 Competitive Landscape
- 6.1 Market Concentration
- 6.2 Strategic Moves (M&A, Partnerships, PPAs)
- 6.3 Market Share Analysis (Market Rank/Share for key companies)
- 6.4 Company Profiles (includes Global level Overview, Market level overview, Core Segments, Financials as available, Strategic Information, Products & Services, and Recent Developments)
- 6.4.1 Siemens Gamesa Renewable Energy SA
- 6.4.2 Vestas Wind Systems A/S
- 6.4.3 GE Vernova (GE Renewable Energy)
- 6.4.4 BW Ideol AS
- 6.4.5 Equinor ASA
- 6.4.6 Orsted A/S
- 6.4.7 Principle Power Inc.
- 6.4.8 Aker Solutions ASA
- 6.4.9 Hexicon AB
- 6.4.10 TotalEnergies SE
- 6.4.11 Shell plc
- 6.4.12 Ocean Winds (EDPR/ENGIE)
- 6.4.13 Copenhagen Infrastructure Partners
- 6.4.14 RWE AG
- 6.4.15 Marubeni Corporation
- 6.4.16 Doosan Enerbility Co., Ltd
- 6.4.17 MingYang Smart Energy
- 6.4.18 Goldwind Science & Technology
- 6.4.19 Cobra IS (Grupo ACS)
- 6.4.20 Gazelle Wind Power Ltd.
7 Market Opportunities & Future Outlook
- 7.1 White-space & Unmet-Need Assessment

 浮體式海上風電市場-2026-2032年全球市場預測
 全球浮體式海上風力發電機市場:按基礎類型、組件、水深、容量、最終用戶和地區分類-市場規模、產業動態、機會分析和預測(2026-2035 年)
 2034年全球浮體式海上風電市場預測:按組件、水深、技術、最終用戶和地區分類的分析2034年海上漂浮式風電技術市場預測:按平台類型、組件、水深、安裝類型、應用、最終用戶和地區分類的全球分析
 全球浮體式海上風電市場(至 2031 年):按渦輪機輸出功率(5MW 以下、5-10MW、11-15MW、15MW 以上)、浮體式平台(半潛式、立柱式浮標、張力腿式、駁船式和混合式)、組件、水深和地區分類。
 2026年全球浮體式海上電市場報告2026年全球浮體式海上風力發電市場報告
 浮體式海上風電市場-2026-2031年預測全球浮體式海上風電系統市場:預測至2032年-按組件、平台類型、風扇容量、水深、軸線、應用、最終用戶及地區進行分析
 海上漂浮式風電:全球市場佔有率和排名、總收入和需求預測(2025-2031年)