


 |
市場調查報告書
商品編碼
2122525
固態硬碟(SSD):市場佔有率分析、產業趨勢與統計資料、成長預測(2026-2031)Solid State Drive (SSD) - Market Share Analysis, Industry Trends & Statistics, Growth Forecasts (2026 - 2031) |
||||||

※ 本網頁內容可能與最新版本有所差異。詳細情況請與我們聯繫。
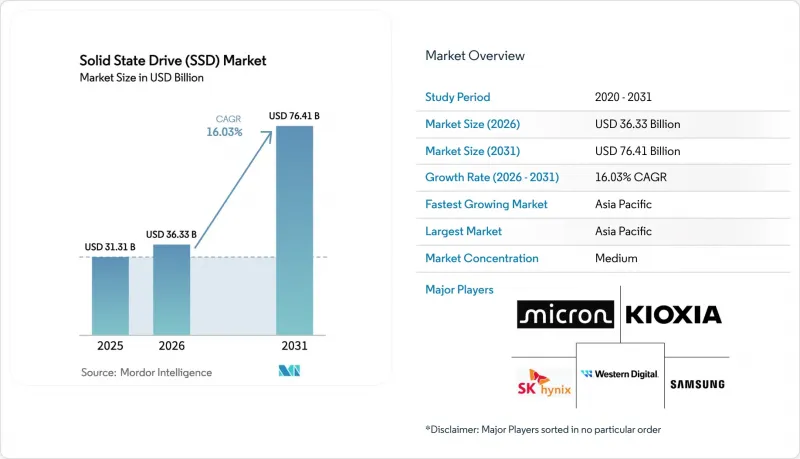
根據 Mordor Intelligence 預測,固態硬碟 (SSD) 市場規模將從 2025 年的 313.1 億美元成長到 2026 年的 363.3 億美元,然後在 2031 年達到 764.1 億美元,2026 年至 2031 年的複合年成長率為 16.03%。
本報告外形規格(2.5吋、M.2、U.2等)、介面(SATA、PCIe/NVMe、SAS)、技術/NAND類型(SLC、MLC等)、容量(500GB以下、500GB至1TB、其他)、最終用戶/應用程式(消費性電子產品、企業/資料中心伺服器等)、EM、1TB 、銷售管道(直銷/O)進行細分市場與地區銷售、O)、EMO)、Op)市場預測以美元(USD)為單位。
全球固態硬碟 (SSD) 市場趨勢與洞察
人工智慧和機器學習工作負載正在重塑資料中心儲存。
生成式人工智慧叢集現在不再從網路共用傳輸Terabyte級參數文件,而是從本地NVMe儲存層傳輸。根據Meta發布的2025年報告,Llama 3訓練將使用Exabyte的快閃記憶體,比2024年增加60%。因此,連續式寫入速度超過10GB/s的第五代PCIe硬碟正在取代SATA和更早一代的PCIe裝置。隨著邊緣人工智慧需求的成長,自動駕駛汽車現在配備了4TB到8TB的固態硬碟用於車載推理,毫秒級的延遲降低就能帶來更安全的控制迴路。在GTC 2025大會上,英偉達強調,儲存I/O而非GPU週期才是許多人工智慧管線的瓶頸。超大規模資料中心業者正在將預算分配轉向快閃存儲,以降低營運成本,因為消除資料路徑的延遲可以提高每個機架的虛擬機密度並降低功耗。
NVMe 在企業中的廣泛應用正在加速舊有系統的替換。
到 2025 年,企業級陣列中 NVMe 的出貨量將超過 60%。 NVMe over Fabrics (NVMe-oF) 正在取代 SAS 和光纖通道,在保持相似可靠性的同時,吞吐量可提升 10 倍。戴爾的 PowerStore 利用 NVMe-oF 的區域分類功能,實現了 700 萬 IOPS,使陣列整合在經濟上可行。 NVMe 2.0 規格新增了區域命名空間和鍵值指令,減少了 CPU 週期,使用戶能夠在 SATA 硬碟架的折舊免稅額淘汰。雖然 PCIe Gen4 目前支援混合工作負載,但早期採用者已經開始為分析叢集指定 Gen5,這使得協定遷移成為固態硬碟市場成長的最大驅動力。
雲採購價格波動
2024年至2025年間,NAND快閃記憶體的季度價格波動幅度高達35%,擠壓了OEM廠商的獲利空間,迫使買家簽訂24個月的合約以避免預算限制。 2023年晶圓產能過剩,加上QLC快閃記憶體的快速普及,導致固態硬碟(SSD)市場供應過剩,使得消費級SSD的平均售價(ASP)較去年同期下降28%。沒有晶片或控制器製造地的中小型品牌受到的衝擊最大。這凸顯了垂直整合在抵禦價格波動方面的重要角色。
細分市場分析
隨著「口香糖」式M.2介面逐漸成為筆記型電腦、小型桌上型電腦和遊戲機的標準配置,預計到2025年,M.2固態硬碟的市佔率將達到47.11%。然而,資料中心的固態硬碟市場正在經歷一場變革。 EDSFF E1.S、E1.L和E3.S模組預計到2031年將維持18.12%的複合年成長率,在外形規格中位居榜首。 Meta的Open Rack V3機架式伺服器每台1U伺服器可容納32塊E3.S固態硬碟,比U.2硬碟位元多出33%,從而降低了每Petabyte的儲存面積和散熱成本。
三星即將推出的 64TB E1.L 固態硬碟清楚地展示了超大規模資料中心業者企業為何偏愛覆蓋整個 PCB 的細長殼狀散熱片,即使在 18W 寫入負載下也能避免效能下降。在超大規模環境之外,EDSFF 的普及速度較為緩慢,因為傳統 IT 部門缺乏免工具安裝托架,也沒有足夠的預算來購買新的底盤。然而,EDSFF 佔阿里巴巴採購組合的 80%,這表明規模化將扭轉成本格局,預計到 2029 年,EDSFF 的新部署量將超過 U.2。同時,擴充卡仍然是市場佔有率不到 5% 的小眾產品。它們主要用於需要直接 x16頻寬的工作站和科學計算叢集。
預計到2025年,基於PCIe的NVMe將佔總銷售額的62.34%,複合年成長率(CAGR)為17.03%。與AHCI相比,NVMe簡化的命令集可將CPU開銷降低一半,其多隊列深度也與現代CPU核心數量完美匹配。相比之下,由於主機板連接埠減少以及通道重新部署到USB 4,SATA的市場佔有率已降至25%以下。雖然SAS在雙埠企業級陣列中仍有一席之地,但其市佔率仍低於8%,因為NVMe-oF在實現同等冗餘目標的同時,吞吐量卻是SAS的五倍。
PCIe Gen5 的普及進一步加速了 NVMe SSD 市場的成長。戴爾的 PowerEdge Gen5 伺服器標配 NVMe 固態硬碟,而 SATA 固態硬碟僅作為訂單產品 (BTO) 提供。未來,PCIe Gen6 的 PAM-4 訊號機制有望在提供相近頻寬的同時降低功耗,這意味著 NVMe 仍將是產品藍圖圖的核心,而傳統協定將僅用於現有系統的升級。
區域分析
預計到2025年,亞太地區將佔全球銷售額的46.73%,年複合成長率達18.67%,這得益於晶圓產量的增加和本地消費的成長。三星、SK海力士和鎧俠在韓國、台灣和日本經營200層晶圓廠,對全球成本曲線產生了顯著影響。相較之下,阿里雲已部署了Exabyte的快閃記憶體用於國內人工智慧訓練。在印度,隨著「數位印度」計畫推動新的銀行和電子政府工作負載,企業固態硬碟採購量增加了32%。儘管該地區的成長伴隨著地緣政治和地震風險,但目前還沒有其他成本結構可以與之匹敵的替代中心。
到2025年,北美和歐洲將佔總收入的約38%。 Azure和AWS每季部署50萬塊固態硬碟,以滿足日益成長的人工智慧流量需求。在美國《晶片法案》(CHIPS Act)的資助下,美光科技正在紐約建造一座價值150億美元的工廠,計劃於2028年運作,初期生產預計將以DRAM為主,之後再增加NAND快閃記憶體。歐洲的《一般資料保護規範》(GDPR)和即將推出的資料保護法正在鼓勵資料中心儲備本地快閃記憶體。同時,歐盟《晶片法案》(Chips Act)已撥款430億歐元(約503億美元)用於該地區的晶圓廠建設,但目前尚無任何晶圓廠投入試營運。
中東、非洲和南美洲的銷售額合計約佔總銷售額的15%。沙烏地阿拉伯的NEOM為智慧城市電網指定使用NVMe邊緣存儲,南非的銀行則採用快閃記憶體來滿足即時結算的需求。巴西零售商預計2025年的銷售額將成長24%,但進口關稅阻礙了高容量產品的普及。電網不穩定和光纖線路短缺仍然限制企業採用,但隨著數位化轉型迅速超越傳統IT,巴西的年成長率已超過全球平均。
其他好處:
- Excel格式的市場預測(ME)表
- 3個月的分析師支持
目錄
第1章:引言
- 研究假設和市場定義
- 調查範圍
第2章:調查方法
第3章執行摘要
第4章 市場狀況
- 市場概覽
- 市場促進因素
- 人工智慧/機器學習資料中心工作負載增加導致需求成長
- NVMe 在企業儲存陣列中的應用正在加速。
- 5G和物聯網中邊緣運算節點的快速擴展
- PCIe 5.0 和 EDSFF 外形尺寸的普及
- 由於政府推行綠色資料政策,快閃記憶體比機械硬碟更受青睞。
- OEM韌體定義的快閃記憶體正在創造一個新的升級週期。
- 市場限制因素
- NAND 位元供應過剩導致平均售價 (ASP) 出現劇烈波動。
- NAND晶圓製造供應鏈中的集中風險
- 超薄客戶端設備的溫度控管挑戰
- 企業安全認證成本日益增加
- 產業價值鏈分析
- 技術展望
- 監理情勢
- 波特五力分析
- 宏觀經濟因素對市場的影響
第5章 市場規模與成長預測
- 按外形規格
- 2.5英寸
- M.2
- U.2
- PCIe擴充卡
- EDSFF
- 其他外形規格
- 透過介面
- SATA
- PCIe/NVMe
- SAS
- 按技術(NAND 類型)
- SLC
- MLC
- TLC
- QLC
- 其他NAND類型
- 按產能
- 500 GB 或更少
- 500 GB~1 TB
- 1 TB~2 TB
- 2 TB 或以上
- 最終用戶/應用程式特定
- 客戶端電子設備(筆記型電腦、桌上型電腦)
- 企業/資料中心伺服器
- 工業和嵌入式系統
- 車
- 其他最終用戶/應用程式
- 按銷售管道
- 直接/OEM
- 分銷商和經銷商
- 線上零售
- 按地區
- 北美洲
- 美國
- 加拿大
- 墨西哥
- 南美洲
- 巴西
- 阿根廷
- 其他南美國家
- 歐洲
- 德國
- 英國
- 法國
- 義大利
- 西班牙
- 俄羅斯
- 其他歐洲國家
- 亞太地區
- 中國
- 日本
- 韓國
- 印度
- 澳洲
- 紐西蘭
- 其他亞太國家
- 中東
- 阿拉伯聯合大公國
- 沙烏地阿拉伯
- 土耳其
- 其他中東國家
- 非洲
- 南非
- 奈及利亞
- 肯亞
- 其他非洲國家
- 北美洲
第6章 競爭情勢
- 市場集中度
- 策略趨勢
- 市佔率分析
- 公司簡介
- Samsung Electronics Co., Ltd.
- Western Digital Corporation
- Kioxia Holdings Corporation
- SK hynix Inc.(incl. Solidigm)
- Micron Technology, Inc.
- Seagate Technology Holdings plc
- Kingston Technology Corporation
- ADATA Technology Co., Ltd.
- Transcend Information, Inc.
- Corsair Memory, Inc.
- Sabrent
- Silicon Motion Technology Corp.
- Phison Electronics Corporation
- Intel Corporation(Optane)
- Marvell Technology, Inc.
- Patriot Memory
- Team Group Inc.
- Mushkin Enhanced MFG
- Microsemi(Microchip Technology)
- Violin Systems LLC
第7章 市場機會與未來展望
According to Mordor Intelligence, the solid state drive market size is expected to grow from USD 31.31 billion in 2025 to USD 36.33 billion in 2026 and is forecast to reach USD 76.41 billion by 2031 at 16.03% CAGR over 2026-2031.
This report is Segmented by Form Factor (2. 5-Inch, M. 2, U. 2, and More), Interface (SATA, PCIe/NVMe, and SAS), Technology/NAND Type (SLC, MLC, and More), Capacity (Up To 500 GB, 500 GB-1 TB, and More), End-user/Application (Client Electronics, Enterprise/Data-Center Servers, and More), Sales Channel (Direct/OEM, Online Retail, and More), and Geography. The Market Forecasts are Provided in Terms of Value (USD).
Global Solid State Drive (SSD) Market Trends and Insights
AI and ML Workloads Reshape Data-Center Storage
Generative AI clusters now stream terabyte-scale parameter files from local NVMe tiers rather than network shares, and Meta's 2025 report showed Llama 3 training pulling 2.4 exabytes of flash, up 60% from 2024. PCIe Gen5 drives offering more than 10 GB/s sequential writes are therefore replacing SATA and early-generation PCIe devices. Edge AI compounds demand autonomous vehicles ship with 4 TB to 8 TB SSDs for onboard inference, and every millisecond saved translates into safer control loops. Nvidia highlighted at GTC 2025 that storage I/O, not GPU cycles, cap many AI pipelines. Hyperscalers have shifted budgets accordingly, viewing flash as an operating-expense reducer because they can increase VM density per rack and lower power draw once latency is removed from the data path.
Enterprise NVMe Uptake Accelerates Legacy Replacement
NVMe crossed a 60% shipment threshold for enterprise arrays in 2025, and NVMe-over-Fabrics is displacing SAS and Fibre Channel because it brings tenfold throughput at similar reliability. Dell's PowerStore uses NVMe-oF zoning to hit 7 million IOPS, making array consolidation economical. The NVMe 2.0 spec added zoned namespaces and key-value commands that cut CPU cycles, so buyers are scrapping SATA shelves years ahead of depreciation. PCIe Gen4 satisfies mixed workloads today, yet early adopters already specify Gen5 for analytics clusters, turning protocol migration into the fastest lever for solid state drive market growth.
Pricing Volatility Clouds Procurement
Quarterly NAND prices swung 35% during 2024-2025, compressing OEM margins and forcing buyers to lock in 24-month contracts to avoid budget shortfalls. Excess wafer starts in 2023 combined with rapid QLC conversions pushed the solid state drive market into oversupply, dropping consumer SSD ASPs 28% year-on-year. Smaller brands lacking die or controller plants felt the squeeze most, underscoring that vertical integration is an insurance policy against price cycles.
Other drivers and restraints analyzed in the detailed report include:
- Edge-Computing Nodes Boost Demand Beyond the Core
- PCIe 5.0 Bandwidth and EDSFF Density Reach the Mainstream
- Concentration Exposes the Supply Chain to Shock
For complete list of drivers and restraints, kindly check the Table Of Contents.
Segment Analysis
M.2 drives generated 47.11% of 2025 revenue as laptops, SFF desktops, and consoles standardized on the gum-stick layout. However, the solid state drive market is pivoting in the data center; EDSFF E1.S, E1.L, and E3.S modules are forecast to post an 18.12% CAGR through 2031, the highest among form factors. Meta's Open Rack V3 now accommodates 32 E3.S drives per 1U server, 33% more than U.2 bays, reducing floor space and cooling costs per petabyte.
Samsung's upcoming 64 TB E1.L showcases why hyperscalers prefer the elongated shell thermal spreader across the PCB, which avoids throttling even under 18 W write loads. Outside hyperscale halls, EDSFF uptake lags because traditional IT shops lack tool-free trays and budget for new chassis. Yet Alibaba's 80% EDSFF procurement mix signals that scale tips the cost balance, so EDSFF should eclipse U.2 for fresh deployments before 2029. Meanwhile, add-in cards stay niche at <5% share, mostly in workstations and scientific clusters craving direct x16 bandwidth.
NVMe over PCIe claimed 62.34% of revenue in 2025 and is marching toward ubiquity at a 17.03% CAGR. NVMe's lean command set halves CPU overhead compared to AHCI, and its multi-queue depth aligns perfectly with modern core counts. Conversely, SATA slid below 25% as motherboards drop ports or repurpose lanes for USB 4. SAS clings to dual-port enterprise arrays, yet its share is under 8% because NVMe-oF meets the same redundancy target with five times the throughput.
The adoption of PCIe Gen5 raises the solid-state drive market size for NVMe even faster. Dell's PowerEdge Gen5 servers ship NVMe as the default, offering SATA only on special, build-to-order SKUs. Looking ahead, PCIe Gen6's PAM-4 signaling promises equal bandwidth at lower watts, keeping NVMe firmly at the center of product roadmaps while legacy protocols linger only in brownfield refresh cycles.
Complete Report Scope:
- By Form Factor
- 2.5-inch
- M.2
- U.2
- PCIe Add-in Card
- EDSFF
- Other Form Factors
- By Interface
- SATA
- PCIe/NVMe
- SAS
- By Technology (NAND Type)
- SLC
- MLC
- TLC
- QLC
- Other NAND Types
- By Capacity
- Up to 500 GB
- 500 GB - 1 TB
- 1 TB - 2 TB
- Above 2 TB
- By End-user/Application
- Client Electronics (Laptops, Desktops)
- Enterprise/Data-Center Servers
- Industrial and Embedded Systems
- Automotive
- Other End-user/Application
- By Sales Channel
- Direct/OEM
- Distribution and Resellers
- Online Retail
- By Geography
- North America
- United States
- Canada
- Mexico
- South America
- Brazil
- Argentina
- Rest of South America
- Europe
- Germany
- United Kingdom
- France
- Italy
- Spain
- Russia
- Rest of Europe
- Asia Pacific
- China
- Japan
- South Korea
- India
- Australia
- New Zealand
- Rest of Asia Pacific
- Middle East
- United Arab Emirates
- Saudi Arabia
- Turkey
- Rest of Middle East
- Africa
- South Africa
- Nigeria
- Kenya
- Rest of Africa
- North America
Geography Analysis
The Asia Pacific region controlled 46.73% of the revenue in 2025 and is expected to advance at an 18.67% CAGR, benefiting from both increased wafer output and local consumption. Samsung, SK hynix, and Kioxia operate 200-layer fabs in South Korea, Taiwan, and Japan, which significantly influence global cost curves. In contrast, Alibaba Cloud has deployed 1.2 exabytes of flash for domestic AI training. India posted a 32% increase in enterprise SSD purchases as the Digital India agenda drove new banking and e-gov workloads. The region's growth faces geopolitical and earthquake risks, yet no alternative hub can yet match its cost structure.
North America and Europe generated approximately 38% of the revenue in 2025. Azure and AWS each inserted half a million SSDs per quarter to support the growing demand for generative AI traffic. U.S. CHIPS funding supports Micron's USD 15 billion New York fab, slated for a 2028 start-up, with early output focusing on DRAM before adding NAND. Europe's GDPR and pending Data Act are prompting colocation centers to stock local flash, while the EU Chips Act earmarks EUR 43 billion (USD 50.30 billion) for onshore fabs; yet, none have yet reached pilot runs.
Middle East and Africa and South America together yielded about 15% revenue. Saudi Arabia's NEOM specified NVMe edge storage for its smart-city grid, while South African banks adopted flash to meet instant-payment mandates. Brazilian retailers saw a 24% unit rise in 2025, though import tariffs temper high-capacity adoption. Power grid instability and limited fiber still curb enterprise rollouts, yet year-on-year growth rates eclipse global averages as digital transformation leapfrogs legacy IT.
- Samsung Electronics Co., Ltd.
- Western Digital Corporation
- Kioxia Holdings Corporation
- SK hynix Inc. (incl. Solidigm)
- Micron Technology, Inc.
- Seagate Technology Holdings plc
- Kingston Technology Corporation
- ADATA Technology Co., Ltd.
- Transcend Information, Inc.
- Corsair Memory, Inc.
- Sabrent
- Silicon Motion Technology Corp.
- Phison Electronics Corporation
- Intel Corporation (Optane)
- Marvell Technology, Inc.
- Patriot Memory
- Team Group Inc.
- Mushkin Enhanced MFG
- Microsemi (Microchip Technology)
- Violin Systems LLC
Additional Benefits:
- The market estimate (ME) sheet in Excel format
- 3 months of analyst support
TABLE OF CONTENTS
1 INTRODUCTION
- 1.1 Study Assumptions and Market Definition
- 1.2 Scope of the Study
2 RESEARCH METHODOLOGY
3 EXECUTIVE SUMMARY
4 MARKET LANDSCAPE
- 4.1 Market Overview
- 4.2 Market Drivers
- 4.2.1 Rising Demand From AI/ML Data-Center Workloads
- 4.2.2 Accelerating NVMe Adoption Across Enterprise Storage Arrays
- 4.2.3 Rapid Growth of Edge Computing Nodes in 5G and IoT
- 4.2.4 Mainstreaming of PCIe 5.0 and EDSFF Form-Factors
- 4.2.5 Government Green-Data Policies Favor Flash Over HDDs
- 4.2.6 OEM Firmware-Defined Flash Creating New Upgrade Cycles
- 4.3 Market Restraints
- 4.3.1 High ASP Volatility Due to NAND Bit Oversupply
- 4.3.2 Supply-Chain Concentration Risk in NAND Wafer Manufacturing
- 4.3.3 Thermal Management Challenges in Ultrathin Client Devices
- 4.3.4 Growing Security-Certification Costs for Enterprise Drives
- 4.4 Industry Value Chain Analysis
- 4.5 Technological Outlook
- 4.6 Regulatory Landscape
- 4.7 Porter's Five Forces Analysis
- 4.7.1 Bargaining Power of Suppliers
- 4.7.2 Bargaining Power of Buyers
- 4.7.3 Threat of New Entrants
- 4.7.4 Threat of Substitute Products
- 4.7.5 Intensity of Competitive Rivalry
- 4.8 Impact of Macroeconomic Factors on the Market
5 MARKET SIZE AND GROWTH FORECASTS (VALUE)
- 5.1 By Form Factor
- 5.1.1 2.5-inch
- 5.1.2 M.2
- 5.1.3 U.2
- 5.1.4 PCIe Add-in Card
- 5.1.5 EDSFF
- 5.1.6 Other Form Factors
- 5.2 By Interface
- 5.2.1 SATA
- 5.2.2 PCIe/NVMe
- 5.2.3 SAS
- 5.3 By Technology (NAND Type)
- 5.3.1 SLC
- 5.3.2 MLC
- 5.3.3 TLC
- 5.3.4 QLC
- 5.3.5 Other NAND Types
- 5.4 By Capacity
- 5.4.1 Up to 500 GB
- 5.4.2 500 GB - 1 TB
- 5.4.3 1 TB - 2 TB
- 5.4.4 Above 2 TB
- 5.5 By End-user/Application
- 5.5.1 Client Electronics (Laptops, Desktops)
- 5.5.2 Enterprise/Data-Center Servers
- 5.5.3 Industrial and Embedded Systems
- 5.5.4 Automotive
- 5.5.5 Other End-user/Application
- 5.6 By Sales Channel
- 5.6.1 Direct/OEM
- 5.6.2 Distribution and Resellers
- 5.6.3 Online Retail
- 5.7 By Geography
- 5.7.1 North America
- 5.7.1.1 United States
- 5.7.1.2 Canada
- 5.7.1.3 Mexico
- 5.7.2 South America
- 5.7.2.1 Brazil
- 5.7.2.2 Argentina
- 5.7.2.3 Rest of South America
- 5.7.3 Europe
- 5.7.3.1 Germany
- 5.7.3.2 United Kingdom
- 5.7.3.3 France
- 5.7.3.4 Italy
- 5.7.3.5 Spain
- 5.7.3.6 Russia
- 5.7.3.7 Rest of Europe
- 5.7.4 Asia Pacific
- 5.7.4.1 China
- 5.7.4.2 Japan
- 5.7.4.3 South Korea
- 5.7.4.4 India
- 5.7.4.5 Australia
- 5.7.4.6 New Zealand
- 5.7.4.7 Rest of Asia Pacific
- 5.7.5 Middle East
- 5.7.5.1 United Arab Emirates
- 5.7.5.2 Saudi Arabia
- 5.7.5.3 Turkey
- 5.7.5.4 Rest of Middle East
- 5.7.6 Africa
- 5.7.6.1 South Africa
- 5.7.6.2 Nigeria
- 5.7.6.3 Kenya
- 5.7.6.4 Rest of Africa
- 5.7.1 North America
6 COMPETITIVE LANDSCAPE
- 6.1 Market Concentration
- 6.2 Strategic Moves
- 6.3 Market Share Analysis
- 6.4 Company Profiles
- 6.4.1 Samsung Electronics Co., Ltd.
- 6.4.2 Western Digital Corporation
- 6.4.3 Kioxia Holdings Corporation
- 6.4.4 SK hynix Inc. (incl. Solidigm)
- 6.4.5 Micron Technology, Inc.
- 6.4.6 Seagate Technology Holdings plc
- 6.4.7 Kingston Technology Corporation
- 6.4.8 ADATA Technology Co., Ltd.
- 6.4.9 Transcend Information, Inc.
- 6.4.10 Corsair Memory, Inc.
- 6.4.11 Sabrent
- 6.4.12 Silicon Motion Technology Corp.
- 6.4.13 Phison Electronics Corporation
- 6.4.14 Intel Corporation (Optane)
- 6.4.15 Marvell Technology, Inc.
- 6.4.16 Patriot Memory
- 6.4.17 Team Group Inc.
- 6.4.18 Mushkin Enhanced MFG
- 6.4.19 Microsemi (Microchip Technology)
- 6.4.20 Violin Systems LLC
7 MARKET OPPORTUNITIES AND FUTURE OUTLOOK
- 7.1 White-space and Unmet-need Assessment

 固態硬碟 (SSD) 市場報告:趨勢、預測和競爭分析(至 2035 年)
 固態硬碟 (SSD) 市場:按類型、外形規格、儲存容量、技術類型、最終用戶和通路分類-2026-2032 年全球市場預測
 固態硬碟 (SSD) 市場報告:按類型、介面、外形規格、儲存容量、應用程式和地區分類 (2026–2034)
 固態硬碟市場-全球產業規模、佔有率、趨勢、機會、預測:按介面、技術、儲存、最終用戶、地區和競爭格局分類,2021-2031年
 企業級固態硬碟市場規模、佔有率和成長分析:按產品類型、儲存容量、快閃記憶體類型、應用、介面、最終用戶和地區分類-2026-2033年產業預測
 中國固態硬碟市場:市佔率分析、產業趨勢與統計及成長預測(2026-2031)企業級外接可攜式硬碟市場報告:趨勢、預測及競爭分析(至2035年)
 固態硬碟 (SSD) 市場:按 SSD 介面、應用和地區分類
 ZNS SSD全球市場報告2026
 固態硬碟 (SSD) 市場規模、佔有率和成長分析:按介面、外形規格、技術、儲存容量和地區分類-2026-2033 年產業預測