


 |
市場調查報告書
商品編碼
2122433
氨:市場佔有率分析、產業趨勢和統計數據、成長預測(2026-2031)Ammonia - Market Share Analysis, Industry Trends & Statistics, Growth Forecasts (2026 - 2031) |
||||||

※ 本網頁內容可能與最新版本有所差異。詳細情況請與我們聯繫。
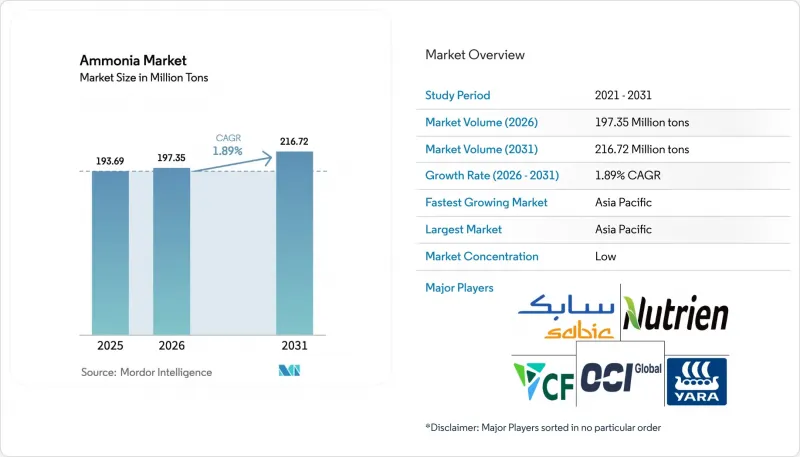
據 Mordor Intelligence 稱,2025 年氨市場價值為 1.9369 億噸,預計到 2031 年將達到 2.1672 億噸,而 2026 年為 1.9735 億噸,預測期(2026-2031 年)的複合年成長率為 1.89%。
本報告按類型(液體和氣體)、終端用戶行業(農業、採礦和金屬、紡織、製藥、工業製冷、發電及其他終端用戶行業)和地區(亞太地區、北美、歐洲、南美以及中東和非洲)進行細分。市場預測以噸為單位。
全球氨市場趨勢與洞察
亞洲各地對低碳肥料的需求激增
亞太地區各國政府已宣布將補貼與碳排放強度掛鉤的政策,並鼓勵大型化肥生產商將電解設備整合到現有的氨製造地中。印度的直接補貼計畫(DBT)規定,綠色氨的摻混比例必須達到5%,預計2027年將新增98萬噸的需求。同時,印尼國營企業Pupuku Indonesia已獲得12億美元的資金,用於維修Petrokymia Gresik工廠,使其能夠生產可再生氫。中國的「十四五」計畫對新增燃煤產能設定了上限,並強制要求年產量超過50萬噸的工廠進行二氧化碳捕集與儲存(CCS)準備,從而將生產集中在高效的國有企業。這些措施正在向氨市場注入大量新的供應,加劇化肥短缺經濟體對進口的依賴,並推動中東地區新的綠色氨商業項目的發展。
用作船用燃料的氫載體
在常溫常壓條件下,氨每立方公尺可儲存4.3兆瓦時的能量,其能量密度與船用柴油相當,且無需低溫系統。日本航運公司日本郵船(NYK)已於2024年訂購了12艘氨燃料散裝貨船。歐洲海事安全局(EMSA)也發布了操作指南,規範了雙層壁管道和蒸氣回收系統,從而降低了人們對操作風險的擔憂。新加坡已頒發三張加註許可證,目標是到2030年實現每年50萬噸的加註量,這將構成太平洋貨櫃航線初期需求的基礎。這些舉措加在一起,將建立一個專用加註網路,到2031年能夠吸收每年300萬噸的氨,從而推動氨市場的擴張。
天然氣價格波動推高了全球現金成本。
由於天然氣成本佔灰氨生產成本的80%之多,原物料價格的波動迫使那些處於損益平衡點的工廠停產。預計到2025年,歐洲生產商的平均TTF價格將達到每兆瓦時42歐元,這將使現金成本超過每噸600歐元,迫使Grupa Azoti公司停產18萬噸產能,為期四個月。美國營運商受惠於亨利樞紐價格低於每百萬英熱單位3美元,但由於液化天然氣出口和夏季高峰需求上升,供應趨緊,對其利潤率構成壓力。亞洲進口商為現貨氨支付每百萬英熱單位12-14美元,這使得本地氨的競爭力下降,並增加了對中東氨源的依賴。
細分市場分析
到2025年,液態氨將佔全球總量的91.28%,這得益於一套完善的物流系統,該系統透過管道將無水氨輸送到化肥廠,然後裝載到加壓油輪上進行海上貿易。儘管大規模儲存和冷藏成本約佔交付成本的30%,但投入的資金阻礙了快速轉型,液態氨在氨市場中仍佔據極為重要的地位。由於天然氣價格高企限制了當地產量,北非和中東的出口商正利用其油輪船隊進軍歐洲和亞洲市場;而墨西哥灣沿岸的出口商則利用鄰近的石化基礎設施向拉丁美洲市場供應氨。
預計到2031年,氣態氨市場將以4.18%的複合年成長率成長。據國際氨製冷協會(IIAR)稱,食品零售和製藥行業工業製冷設備的維修正在用現場生產的氣態氨取代合成冷媒,從而降低18%的電力消耗量。中國的尼龍和丙烯酸樹脂生產商正利用管道從鄰近的煤炭氣化裝置輸送氣態氨,以提高反應速率並減少純化工序。儘管氣態氨在該領域的市場規模相對較小,但這些終端應用效率的提升正在增強其吸引力。
區域分析
預計到2025年,亞太地區將佔全球氨產量的39.16%,並在2031年之前維持3.76%的年均成長率。在中國,關閉不符合每噸31吉焦能源效率標準的小規模煤炭氣化廠,並將生產集中到高效的國有綜合設施中,為進口綠色天然氣的需求成長創造了空間。在印度,儘管國內天然氣供應持續受限,但由於強制性摻混和補貼制度改革,預計需求仍將成長。日本和韓國正逐步退出成本高昂的國內生產,並重新開發其港口基礎設施,以期到2030年處理600萬噸的進口氨,從而強化其在氨市場中作為生產國和消費國的雙重角色。
北美受益於豐富的頁岩氣資源和《通貨膨脹抑制法案》提供的獎勵,該法案規定每噸二氧化碳最高可獲得 85 美元的補貼,這刺激了墨西哥灣沿岸藍氨產業叢集的發展,並支撐了墨西哥的氨市場。 CF Industries、Nutrien 和 Koch Fertilizer 等公司正在擴建其回收設施和管道連接,以確保每噸氨的交付成本低於 320 美元。在加拿大,水力資源豐富的省份正在提案利用零碳水力發電生產綠色氨,這些氨可以通過大西洋港口出口,從而將其區域影響力擴展到化肥行業之外。
在歐洲,預計2024年至2025年間天然氣價格將超過每兆瓦時50歐元,將限制產能並增加對北非和中東進口的依賴。歐盟委員會已根據《基本原料法》將氨列為「戰略性」原料,並致力於簡化國內低碳計畫的授權程序。同時,卡達、沙烏地阿拉伯和阿拉伯聯合大公國(阿拉伯聯合大公國)正利用每百萬英熱單位2美元的天然氣價格,向歐洲和亞洲出口低碳貨物。埃及和阿曼也在快速建造風能和太陽能發電廠,其出口平價目標低於每噸400美元。在南美洲,智利麥哲倫省正在建造風力發電設施,巴西佩塞姆正在建造太陽能發電工程,這將為跨大西洋貿易帶來新的競爭。
其他好處:
- Excel格式的市場預測(ME)表
- 3個月的分析師支持
目錄
第1章:引言
- 研究假設和市場定義
- 調查範圍
第2章:調查方法
第3章執行摘要
第4章 市場狀況
- 市場概覽
- 市場促進因素
- 亞洲各地對低碳肥料的需求激增
- 在船舶加油中作為氫載體的應用
- 增加對綠色氨出口中心的投資
- 在炸藥製造中增加使用
- 印度的化肥補貼政策轉向綠色混合肥料。
- 市場限制因素
- 天然氣價格的劇烈波動推高了全球現金成本。
- 安全性和毒性方面的擔憂限制了工業替代品的推廣應用。
- 電解槽供應鏈中的瓶頸
- 價值鏈分析
- 技術展望
- 波特五力模型
第5章 市場規模與成長預測
- 按類型
- 液體
- 氣體
- 按最終用戶行業分類
- 農業
- 採礦和金屬
- 紡織品
- 製藥
- 工業製冷
- 發電
- 其他終端用戶產業(水處理、橡膠、石油、紙漿和造紙)
- 按地區
- 亞太地區
- 中國
- 印度
- 日本
- 韓國
- 東南亞國協
- 其他亞太國家
- 北美洲
- 美國
- 加拿大
- 墨西哥
- 歐洲
- 德國
- 英國
- 法國
- 義大利
- 北歐國家
- 其他歐洲國家
- 南美洲
- 巴西
- 阿根廷
- 其他南美國家
- 中東和非洲
- 沙烏地阿拉伯
- 南非
- 其他中東和非洲國家
- 亞太地區
第6章 競爭情勢
- 市場集中度
- 策略趨勢
- 市佔率和排名分析
- 公司簡介
- Acron Group
- BASF
- CF Industries Holdings, Inc.
- CSBP
- Dyno Nobel
- EuroChem Group
- Group DF
- Grupa Azoty SA
- IFFCO
- Industries Qatar
- JSC Togliattiazot
- Koch Fertilizer, LLC
- LSB Industries
- Nutrien
- OCI
- Orica Limited
- PetroChina Company Limited
- PT Pupuk Sriwidjaja Palembang
- Rashtriya Chemicals & Fertilisers
- SABIC
- The Mosaic Company
- Yara
第7章 市場機會與未來展望
According to Mordor Intelligence, the ammonia market size was valued at 193.69 Million tons in 2025 and is estimated to grow from 197.35 Million tons in 2026 to reach 216.72 Million tons by 2031, at a CAGR of 1.89% during the forecast period (2026-2031).
This report is Segmented by Type (Liquid and Gas), End-User Industry (Agriculture, Mining and Metals, Textiles, Pharmaceutical, Industrial Refrigeration, Power Generation, and Other End-User Industries), and Geography (Asia-Pacific, North America, Europe, South America, and Middle East and Africa). The Market Forecasts are Provided in Terms of Volume (Tons).
Global Ammonia Market Trends and Insights
Surge in Low-Carbon Fertilizer Demand Across Asia
Asia-Pacific governments are linking subsidy disbursements to carbon intensity, prompting fertilizer majors to integrate electrolyzers at legacy ammonia sites. India's Direct Benefit Transfer scheme added a 5% green-ammonia blending requirement that opens 980,000 tons of incremental demand by 2027, while Indonesia's state-owned Pupuk Indonesia secured USD 1.2 billion to retrofit Petrokimia Gresik with renewable hydrogen. China's 14th Five-Year Plan caps new coal-based capacity and mandates capture readiness above 500,000 tons per year, crowding production into efficient state-owned complexes. These measures funnel fresh volume into the ammonia market, deepen import dependence in fertilizer-short economies, and underpin new merchant green-ammonia projects across the Middle East.
Adoption as Hydrogen Carrier for Maritime Bunkering
Ammonia stores 4.3 MWh per cubic meter at ambient conditions, matching marine-diesel energy density without cryogenic systems. Japanese shipper NYK ordered 12 ammonia-fueled bulk carriers in 2024 and the European Maritime Safety Agency published handling guidelines that standardize double-walled piping and vapor recovery, trimming perceived operational risk. Singapore granted three bunkering licenses targeting 500,000 tons per year by 2030, an early demand anchor for Pacific container routes. Together these actions seed a dedicated bunkering network that could absorb 3 million tons annually before 2031, widening the ammonia market.
Volatile Natural-Gas Prices Inflating Global Cash Costs
Natural gas forms up to 80% of grey-ammonia production cost, so feedstock swings shutter marginal plants. European producers faced average TTF prices of EUR 42 per MWh in 2025, pushing cash costs beyond EUR 600 per ton and forcing Grupa Azoty to idle 180,000 tons of capacity for four months. U.S. operators enjoy Henry Hub below USD 3 per MMBtu, yet LNG exports are tightening supply and lifting summer peaks, squeezing the margin cushion. Asian importers pay USD 12-14 per MMBtu for spot cargoes, making local ammonia uncompetitive and reinforcing reliance on Middle Eastern volumes.
Other drivers and restraints analyzed in the detailed report include:
- Rising Investments in Green-Ammonia Export Hubs
- Rising Usage in Explosive Production
- Safety and Toxicity Concerns Limiting Industrial Substitution
For complete list of drivers and restraints, kindly check the Table Of Contents.
Segment Analysis
Liquid retained 91.28% of global volume in 2025, underscoring entrenched logistics that pipe anhydrous ammonia into fertilizer plants and load pressurized tankers for ocean trade. Bulk storage and refrigeration account for about 30% of delivered cost, yet the sunk capital discourages rapid switching, keeping the liquid segment pivotal to the ammonia market. North African and Middle Eastern exporters leverage tanker fleets to penetrate Europe and Asia as high natural-gas prices curtail local output, while Gulf Coast exporters exploit contiguous petrochemical infrastructure to reach Latin America.
Gas-phase is projected to expand at a 4.18% CAGR through 2031. Industrial refrigeration retrofits in food retail and pharmaceuticals substitute synthetic refrigerants with on-site gaseous ammonia, shrinking power consumption by 18% according to the International Institute of Ammonia Refrigeration. China's nylon and acrylic producers pipe gaseous ammonia from adjacent coal-gasification units to boost reaction kinetics and trim purification steps. These end-use efficiencies widen the appeal of gaseous formats despite the segment's smaller base.
Complete Report Scope:
- By Type
- Liquid
- Gas
- By End-user Industry
- Agriculture
- Mining and Metals
- Textiles
- Pharmaceutical
- Industrial Refrigeration
- Power Generation
- Other End-user Industries (Water-treatment, Rubber, Petroleum, Pulp and Paper)
- By Geography
- Asia-Pacific
- China
- India
- Japan
- South Korea
- ASEAN Countries
- Rest of Asia-Pacific
- North America
- United States
- Canada
- Mexico
- Europe
- Germany
- United Kingdom
- France
- Italy
- NORDIC Countries
- Rest of Europe
- South America
- Brazil
- Argentina
- Rest of South America
- Middle East and Africa
- Saudi Arabia
- South Africa
- Rest of Middle East and Africa
- Asia-Pacific
Geography Analysis
Asia-Pacific captured 39.16% of global tonnage in 2025 and is forecast to compound at 3.76% through 2031. China is closing sub-scale coal units that fail to meet 31 GJ per ton energy benchmarks, channeling production to efficient state-owned complexes and opening space for imported green volumes. India's blending mandate and subsidy reforms lift incremental demand even as domestic natural-gas constraints persist. Japan and South Korea are retreating from high-cost local production and re-engineering port infrastructure for 6 million tons of imports by 2030, reinforcing Asia's dual role as producer and consumer of the ammonia market.
North America benefits from plentiful shale gas and Inflation Reduction Act incentives worth up to USD 85 per ton of CO2 sequestered, catalyzing blue-ammonia clusters around the Gulf Coast, supporting the Mexico ammonia market. CF Industries, Nutrien, and Koch Fertilizer are adding capture units and pipeline tie-ins, locking in sub-USD 320 per ton delivered costs. Canada's hydro-rich provinces pitch zero-carbon hydropower for green-ammonia projects that could export through Atlantic ports, extending regional influence beyond fertilizer.
In Europe, capacity is restricted in 2024-2025 as gas prices breached EUR 50 per MWh, reinforcing reliance on imports from North Africa and the Middle East. The European Commission now labels ammonia "strategic" under its Critical Raw Materials Act, intending to streamline permitting for domestic low-carbon projects. Meanwhile, Qatar, Saudi Arabia, and the UAE exploit USD 2 per MMBtu gas to ship low-carbon cargoes into Europe and Asia, while Egypt and Oman fast-track wind-and-solar-based plants that target sub-USD 400 per ton export parity. South America is building wind-powered facilities in Chile's Magallanes and solar-driven projects in Brazil's Pecem and injecting fresh competition into Atlantic trade flows.
- Acron Group
- BASF
- CF Industries Holdings, Inc.
- CSBP
- Dyno Nobel
- EuroChem Group
- Group DF
- Grupa Azoty S.A.
- IFFCO
- Industries Qatar
- JSC Togliattiazot
- Koch Fertilizer, LLC
- LSB Industries
- Nutrien
- OCI
- Orica Limited
- PetroChina Company Limited
- PT Pupuk Sriwidjaja Palembang
- Rashtriya Chemicals & Fertilisers
- SABIC
- The Mosaic Company
- Yara
Additional Benefits:
- The market estimate (ME) sheet in Excel format
- 3 months of analyst support
TABLE OF CONTENTS
1 Introduction
- 1.1 Study Assumptions and Market Definition
- 1.2 Scope of the Study
2 Research Methodology
3 Executive Summary
4 Market Landscape
- 4.1 Market Overview
- 4.2 Market Drivers
- 4.2.1 Surge in Low-Carbon Fertiliser Demand Across Asia
- 4.2.2 Adoption As a Hydrogen Carrier for Maritime Bunkering
- 4.2.3 Rising Investments in Green-Ammonia Export Hubs
- 4.2.4 Rising Usage in Explosive Production
- 4.2.5 India's Fertiliser-Subsidy Pivot Towards Green Blends
- 4.3 Market Restraints
- 4.3.1 Volatile Natural-Gas Prices Inflating Global Cash Costs
- 4.3.2 Safety and Toxicity Concerns Limiting Industrial Substitution
- 4.3.3 Electrolyser Supply-Chain Bottlenecks
- 4.4 Value Chain Analysis
- 4.5 Technological Outlook
- 4.6 Porter's Five Forces
- 4.6.1 Bargaining Power of Suppliers
- 4.6.2 Bargaining Power of Buyers
- 4.6.3 Threat of New Entrants
- 4.6.4 Threat of Substitutes
- 4.6.5 Degree of Competition
5 Market Size and Growth Forecasts (Volume)
- 5.1 By Type
- 5.1.1 Liquid
- 5.1.2 Gas
- 5.2 By End-user Industry
- 5.2.1 Agriculture
- 5.2.2 Mining and Metals
- 5.2.3 Textiles
- 5.2.4 Pharmaceutical
- 5.2.5 Industrial Refrigeration
- 5.2.6 Power Generation
- 5.2.7 Other End-user Industries (Water-treatment, Rubber, Petroleum, Pulp and Paper)
- 5.3 By Geography
- 5.3.1 Asia-Pacific
- 5.3.1.1 China
- 5.3.1.2 India
- 5.3.1.3 Japan
- 5.3.1.4 South Korea
- 5.3.1.5 ASEAN Countries
- 5.3.1.6 Rest of Asia-Pacific
- 5.3.2 North America
- 5.3.2.1 United States
- 5.3.2.2 Canada
- 5.3.2.3 Mexico
- 5.3.3 Europe
- 5.3.3.1 Germany
- 5.3.3.2 United Kingdom
- 5.3.3.3 France
- 5.3.3.4 Italy
- 5.3.3.5 NORDIC Countries
- 5.3.3.6 Rest of Europe
- 5.3.4 South America
- 5.3.4.1 Brazil
- 5.3.4.2 Argentina
- 5.3.4.3 Rest of South America
- 5.3.5 Middle East and Africa
- 5.3.5.1 Saudi Arabia
- 5.3.5.2 South Africa
- 5.3.5.3 Rest of Middle East and Africa
- 5.3.1 Asia-Pacific
6 Competitive Landscape
- 6.1 Market Concentration
- 6.2 Strategic Moves
- 6.3 Market Share(%)/Ranking Analysis
- 6.4 Company Profiles (includes Global Level Overview, Market Level Overview, Core Segments, Financials, Strategic Information, Market Rank/Share, Products and Services, Recent Developments)
- 6.4.1 Acron Group
- 6.4.2 BASF
- 6.4.3 CF Industries Holdings, Inc.
- 6.4.4 CSBP
- 6.4.5 Dyno Nobel
- 6.4.6 EuroChem Group
- 6.4.7 Group DF
- 6.4.8 Grupa Azoty S.A.
- 6.4.9 IFFCO
- 6.4.10 Industries Qatar
- 6.4.11 JSC Togliattiazot
- 6.4.12 Koch Fertilizer, LLC
- 6.4.13 LSB Industries
- 6.4.14 Nutrien
- 6.4.15 OCI
- 6.4.16 Orica Limited
- 6.4.17 PetroChina Company Limited
- 6.4.18 PT Pupuk Sriwidjaja Palembang
- 6.4.19 Rashtriya Chemicals & Fertilisers
- 6.4.20 SABIC
- 6.4.21 The Mosaic Company
- 6.4.22 Yara
7 Market Opportunities and Future Outlook
- 7.1 Ammonia Refrigeration Retro-fits in Food Retail
- 7.2 CCS Integration for Blue-Ammonia Clusters
- 7.3 White-Space and Unmet-Need Assessment

 2026年全球商業級無水氨市場報告2026年全球無水氨市場報告
 對工業氨催化劑市場進行分析和預測,直至 2035 年:按類型、產品、技術、應用、材料類型、工藝、最終用戶、功能和安裝類型分類。
 氨市場:2026-2032年全球市場預測(按類型、製造流程、水分含量、物理狀態、應用、最終用途和分銷管道分類)2026年全球選擇性催化還原(SCR)氨鼓泡器市場報告
 2026 年至 2035 年電化學氨合成的市場機會、成長促進因素、產業趨勢分析與預測。
 全球氨市場(2027-2037 年)
 全球氨市場:按類型、銷售管道、終端用戶產業和地區分類-預測(至2031年)
 液態有機氫載體市場預測至2034年-全球分析(按載體類型、製程類型、組成、技術類型、分銷模式、業務規模、經營模式、應用、最終用戶和地區分類)
 氨市場規模、佔有率、趨勢和預測:按物理形態、應用、最終用途行業和地區分類,2026-2034年