


 |
市場調查報告書
商品編碼
2101654
2026 年至 2035 年電化學氨合成的市場機會、成長促進因素、產業趨勢分析與預測。Electrochemical Ammonia Synthesis (Green NH3) Market Opportunity, Growth Drivers, Industry Trend Analysis, and Forecast 2026 - 2035 |
||||||

全球電化學氨合成(綠色 NH3)市場預計到 2025 年價值 5.6 億美元,並將以 30.9% 的複合年成長率成長,到 2035 年達到 147 億美元。
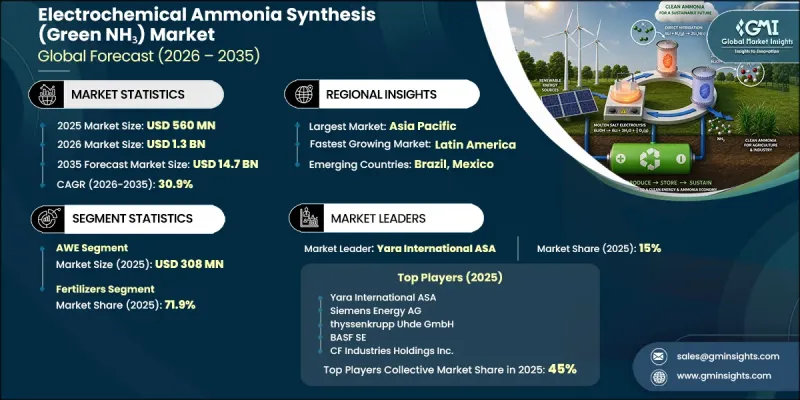
這項擴張是由一系列政策框架共同推動的,包括全球航運業的脫碳努力、歐洲強制性可再生氫政策以及加速的工業電氣化目標。同時,電解槽效率的快速提升和可再生能源發電成本的下降,正穩步降低其相對於傳統氨生產路線的「綠色溢價」。公共資金支持計畫顯著加快了商業化進程,並降低了早期計畫的風險。在美國,聯邦政府支持清潔氫能開發和電化學固氮技術的舉措,促進了示範計畫的擴展;數十億美元的氫能中心投資,也加強了區域生產生態系統。在歐洲,大型能源轉型計畫下制定的長期可再生氫進口和生產目標,正在推動對氨作為長途運輸氫載體的需求。這些發展共同推動電化學氨合成技術從試點階段走向早期商業部署,能源開發商、化學和綜合氫能生產商的參與度也日益提高。
| 市場範圍 | |
|---|---|
| 開始年份 | 2025 |
| 預測期 | 2026-2035 |
| 起始金額 | 5.6億美元 |
| 預測金額 | 147億美元 |
| 複合年成長率 | 30.9% |
預計到2025年,鹼性水電電解(AWE)市場規模將達到3.08億美元,反映出與其他電解技術相比,AWE具有較高的商業性成熟度和資金籌措潛力。 AWE系統通常在200–400 mA/cm²的電流密度範圍內運作,並採用成本相對較低的鎳基電極材料。 AWE系統在工業應用中擁有良好的記錄,其運作壽命超過8萬小時,其可靠的性能和相比新型競爭系統更低的預期實施風險,使其對專案投資者的吸引力日益增強。
預計肥料應用領域市場規模將從2025年的4.03億美元成長到2035年的73.5億美元。在整個預測期內,該領域預計將繼續佔據市場總收入的最大佔有率。需求成長與受監管市場和高階食品供應鏈中低碳農業投入品的日益普及密切相關。在這些市場中,經認證的可再生氨正日益受到青睞,成為實現永續性目標和減少氮肥生產生命週期排放的有效途徑。
預計到2025年,北美電化學合成氨(綠色氨)市場規模將達到1.01億美元,其中美國佔最大佔有率,而加拿大則透過新興的可再生能源相關氨計畫做出貢獻。自2022年以來,該地區的政策環境顯著改善,特別是聯邦政府推出的清潔氫氣生產獎勵,這些措施直接降低了電化學合成氨中氫氣的投入成本。這些獎勵透過降低每噸氨的生產成本,有效改善了專案的經濟效益,具體成本取決於能源來源和碳排放強度。
目錄
第1章:調查方法和範圍
第2章執行摘要
第3章 行業洞察
- 產業生態系分析
- 供應商情況
- 利潤率
- 每個階段增加的價值
- 影響價值鏈的因素
- 中斷
- 影響產業的因素
- 成長促進因素
- 產業潛在風險與挑戰
- 市場機遇
- 成長潛力分析
- 監理情勢
- 波特的分析
- PESTLE分析
- 價格趨勢
- 按地區
- 依產品類型
- 未來市場趨勢
- 技術與創新展望
- 最新科技趨勢
- 新興技術
- 專利趨勢
- 貿易統計
- 主要進口國
- 主要出口國
- 永續性和環境方面
- 永續計劃
- 減少廢棄物策略
- 生產中的能源效率
- 具有環保意識的舉措
- 考慮碳足跡
第4章 競爭情勢
- 介紹
- 企業市佔率分析
- 按地區
- 北美洲
- 歐洲
- 亞太地區
- 拉丁美洲
- 中東和非洲
- 按地區
- 企業矩陣分析
- 主要市場公司的競爭分析
- 競爭定位矩陣
- 主要進展
- 併購
- 夥伴關係和聯盟
- 新產品發布
- 業務拓展計劃
第5章 市場估計與預測:依電解技術分類,2022-2035年
- 鹼性水電電解(AWE)
- 質子交換膜(PEM)電解
- 固體氧化物電解池(SOEC)
- 其他
第6章 市場估算與預測:依生產規模分類,2022-2035年
- 大規模現場施工型工廠(日處理量超過600噸)
- 中小型模組化工廠(日處理量600噸或以下)
第7章 市場估計與預測:依應用領域分類,2022-2035年
- 肥料
- 儲能和氫載體
- 運輸燃料
- 工業原料
- 發電和燃料電池
- 其他
第8章 市場估算與預測:依最終用戶產業分類,2022-2035年
- 農業
- 能源與電力
- 運輸/航運
- 化工/石油化工
- 工業製造
- 其他
第9章 市場估計與預測:依地區分類,2022-2035年
- 北美洲
- 美國
- 加拿大
- 歐洲
- 德國
- 英國
- 法國
- 西班牙
- 義大利
- 其他歐洲國家
- 亞太地區
- 中國
- 印度
- 日本
- 澳洲
- 韓國
- 其他亞太國家
- 拉丁美洲
- 巴西
- 墨西哥
- 阿根廷
- 其他拉丁美洲國家
- 中東和非洲
- 沙烏地阿拉伯
- 南非
- UAE
- 其他中東和非洲國家
第10章:公司簡介
- Yara International ASA
- Siemens Energy AG
- thyssenkrupp Uhde GmbH
- BASF SE
- CF Industries Holdings Inc.
- Topsoe A/S
- Nel ASA
- Air Products & Chemicals Inc.
- Fertiglobe
- Uniper SE
- ITM Power plc
- ACME Group
- AM Green(formerly Greenko ZeroC)
- Fortescue Future Industries(FFI)
- First Ammonia
- Starfire Energy
- FuelPositive Corporation
- Casale SA
- Green Hydrogen Systems
- McPhy Energy SA
- Enapter Srl
- Technip Energies NV
- MAN Energy Solutions
The Global Electrochemical Ammonia Synthesis (Green NH3) Market was valued at USD 560 million in 2025 and is estimated to grow at a CAGR of 30.9% to reach USD 14.7 billion by 2035.
The expansion is shaped by overlapping policy frameworks, including global decarbonization commitments in shipping, renewable hydrogen mandates in Europe, and accelerating industrial electrification targets. At the same time, rapid improvements in electrolyzer efficiency and declining renewable power costs are steadily reducing the green premium versus conventional ammonia production routes. Public funding programs are significantly accelerating commercialization timelines and lowering early-stage project risk. In the United States, federal initiatives supporting clean hydrogen development and electrochemical nitrogen fixation are helping scale demonstration projects, while multi-billion-dollar hydrogen hub investments are strengthening regional production ecosystems. In Europe, long-term renewable hydrogen import and production targets under major energy transition programs are reinforcing demand for ammonia as a hydrogen carrier for long-distance transport. Collectively, these dynamics are pushing electrochemical ammonia synthesis from pilot-scale experimentation toward early commercial deployment, with increasing participation from energy developers, chemical manufacturers, and integrated hydrogen producers.
| Market Scope | |
|---|---|
| Start Year | 2025 |
| Forecast Year | 2026-2035 |
| Start Value | $560 Million |
| Forecast Value | $14.7 Billion |
| CAGR | 30.9% |
Alkaline water electrolysis (AWE) accounted for USD 308 million in 2025, reflecting its strong commercial maturity and bankability compared with alternative electrolysis technologies. AWE systems typically operate within current density ranges of 200-400 mA/cm2 and utilize comparatively low-cost nickel-based electrode materials. Industrial deployments have demonstrated operational lifetimes exceeding 80,000 hours, making the technology more attractive to project financiers due to its proven reliability profile and reduced perceived execution risk relative to newer competing systems.
The fertilizers application segment is expected to grow from USD 403 million in 2025 to USD 7,350 million by 2035. It continues to account for the largest share of total market revenue throughout the forecast period. Demand growth is closely tied to rising adoption of low-carbon agricultural inputs across regulated markets and premium food supply chains, where certified renewable ammonia is increasingly favored to meet sustainability targets and reduce lifecycle emissions in nitrogen-based fertilizer production.
North America Electrochemical Ammonia Synthesis (Green NH3) Market accounted for USD 101 million in 2025, with the United States holding the majority share and Canada contributing through emerging renewable energy-linked ammonia projects. The region's policy landscape has strengthened significantly since 2022, particularly through federal clean hydrogen production incentives that directly reduce hydrogen input costs for electrochemical ammonia synthesis. These incentives effectively improve project economics by lowering production costs per tonne of ammonia, depending on electricity sourcing and carbon intensity.
Major companies operating in the global electrochemical ammonia synthesis (green NH3) market include: BASF SE, FuelPositive Corporation, CF Industries Holdings Inc., Siemens Energy AG, McPhy Energy S.A., Air Products & Chemicals Inc., AM Green (formerly Greenko ZeroC), Fertiglobe, Casale SA, Topsoe A/S, thyssenkrupp Uhde GmbH, First Ammonia, ITM Power plc, Starfire Energy, Uniper SE, ACME Group, Enapter S.r.l., Yara International ASA, Green Hydrogen Systems, Nel ASA, Fortescue Future Industries (FFI), MAN Energy Solutions, and Technip Energies N.V. Electrochemical ammonia synthesis companies are prioritizing long-term offtake agreements with fertilizer producers and industrial gas buyers to secure predictable revenue streams and reduce project financing risk. Many players are integrating vertically with renewable energy developers to ensure low-cost green electricity supply, which is critical for improving production economics. Strategic partnerships with electrolyzer manufacturers are also being formed to optimize system efficiency and scale up capacity. Firms are investing heavily in pilot and demonstration plants to validate technology performance under real operating conditions and build bankability.
Table of Contents
Chapter 1 Methodology & Scope
- 1.1 Research approach
- 1.2 Quality Commitments
- 1.2.1 GMI AI policy & data integrity commitment
- 1.2.1.1 Source consistency protocol
- 1.2.1 GMI AI policy & data integrity commitment
- 1.3 Research Trail & Confidence Scoring
- 1.3.1 Research Trail Components
- 1.3.2 Scoring Components
- 1.4 Data Collection
- 1.4.1 Partial list of primary sources
- 1.5 Data mining sources
- 1.5.1 Paid sources
- 1.5.1.1 Sources, by region
- 1.5.1 Paid sources
- 1.6 Base estimates and calculations
- 1.6.1 Base year calculation for any one approach
- 1.7 Forecast model
- 1.7.1 Quantified market impact analysis
- 1.7.1.1 Mathematical impact of growth parameters on forecast
- 1.7.1 Quantified market impact analysis
- 1.8 Research transparency addendum
- 1.8.1 Source attribution framework
- 1.8.2 Quality assurance metrics
- 1.8.3 Our commitment to trust
Chapter 2 Executive Summary
- 2.1 Industry 360° synopsis
- 2.2 Key market trends
- 2.2.1 Regional
- 2.2.2 Electrolysis Technology
- 2.2.3 Production Scale
- 2.2.4 Application
- 2.2.5 End-User Industry
- 2.3 TAM Analysis, 2026-2035
- 2.4 CXO perspectives: Strategic imperatives
Chapter 3 Industry Insights
- 3.1 Industry ecosystem analysis
- 3.1.1 Supplier landscape
- 3.1.2 Profit margin
- 3.1.3 Value addition at each stage
- 3.1.4 Factor affecting the value chain
- 3.1.5 Disruptions
- 3.2 Industry impact forces
- 3.2.1 Growth drivers
- 3.2.2 Industry pitfalls and challenges
- 3.2.3 Market opportunities
- 3.3 Growth potential analysis
- 3.4 Regulatory landscape
- 3.4.1 North America
- 3.4.2 Europe
- 3.4.3 Asia Pacific
- 3.4.4 Latin America
- 3.4.5 Middle East & Africa
- 3.5 Porter’s analysis
- 3.6 PESTEL analysis
- 3.7 Price trends
- 3.7.1 By region
- 3.7.2 By product type
- 3.8 Future market trends
- 3.9 Technology and Innovation landscape
- 3.9.1 Current technological trends
- 3.9.2 Emerging technologies
- 3.10 Patent Landscape
- 3.11 Trade statistics (HS code)
- 3.11.1 Major importing countries
- 3.11.2 Major exporting countries
- 3.12 Sustainability and environmental aspects
- 3.12.1 Sustainable practices
- 3.12.2 Waste reduction strategies
- 3.12.3 Energy efficiency in production
- 3.12.4 Eco-friendly initiatives
- 3.13 Carbon footprint consideration
Chapter 4 Competitive Landscape, 2025
- 4.1 Introduction
- 4.2 Company market share analysis
- 4.2.1 By region
- 4.2.1.1 North America
- 4.2.1.2 Europe
- 4.2.1.3 Asia Pacific
- 4.2.1.4 LATAM
- 4.2.1.5 MEA
- 4.2.1 By region
- 4.3 Company matrix analysis
- 4.4 Competitive analysis of major market players
- 4.5 Competitive positioning matrix
- 4.6 Key developments
- 4.6.1 Mergers & acquisitions
- 4.6.2 Partnerships & collaborations
- 4.6.3 New Product Launches
- 4.6.4 Expansion Plans
Chapter 5 Market Estimates and Forecast, By Electrolysis Technology, 2022–2035 (USD Million)
- 5.1 Key trends
- 5.2 Alkaline Water Electrolysis (AWE)
- 5.3 Proton Exchange Membrane (PEM) Electrolysis
- 5.4 Solid Oxide Electrolyzer Cells (SOEC)
- 5.5 Others
Chapter 6 Market Estimates and Forecast, By Production Scale, 2022–2035 (USD Million)
- 6.1 Key trends
- 6.2 Large-Scale Stick-Built Plants (>600 MTPD)
- 6.3 Small-to-Medium Modular Plants (≤ 600 MTPD)
Chapter 7 Market Estimates and Forecast, By Application, 2022–2035 (USD Million)
- 7.1 Key trends
- 7.2 Fertilizers
- 7.3 Energy Storage & Hydrogen Carrier
- 7.4 Transportation Fuel
- 7.5 Industrial Feedstock
- 7.6 Power Generation & Fuel Cells
- 7.7 Others
Chapter 8 Market Estimates and Forecast, By End-User Industry, 2022–2035 (USD Million)
- 8.1 Key trends
- 8.2 Agriculture
- 8.3 Energy & Power
- 8.4 Transportation & Marine
- 8.5 Chemicals & Petrochemicals
- 8.6 Industrial Manufacturing
- 8.7 Others
Chapter 9 Market Estimates and Forecast, By Region, 2022–2035 (USD Million)
- 9.1 Key trends
- 9.2 North America
- 9.2.1 U.S.
- 9.2.2 Canada
- 9.3 Europe
- 9.3.1 Germany
- 9.3.2 UK
- 9.3.3 France
- 9.3.4 Spain
- 9.3.5 Italy
- 9.3.6 Rest of Europe
- 9.4 Asia Pacific
- 9.4.1 China
- 9.4.2 India
- 9.4.3 Japan
- 9.4.4 Australia
- 9.4.5 South Korea
- 9.4.6 Rest of Asia Pacific
- 9.5 Latin America
- 9.5.1 Brazil
- 9.5.2 Mexico
- 9.5.3 Argentina
- 9.5.4 Rest of Latin America
- 9.6 Middle East and Africa
- 9.6.1 Saudi Arabia
- 9.6.2 South Africa
- 9.6.3 UAE
- 9.6.4 Rest of Middle East and Africa
Chapter 10 Company Profiles
- 10.1 Yara International ASA
- 10.2 Siemens Energy AG
- 10.3 thyssenkrupp Uhde GmbH
- 10.4 BASF SE
- 10.5 CF Industries Holdings Inc.
- 10.6 Topsoe A/S
- 10.7 Nel ASA
- 10.8 Air Products & Chemicals Inc.
- 10.9 Fertiglobe
- 10.10 Uniper SE
- 10.11 ITM Power plc
- 10.12 ACME Group
- 10.13 AM Green (formerly Greenko ZeroC)
- 10.14 Fortescue Future Industries (FFI)
- 10.15 First Ammonia
- 10.16 Starfire Energy
- 10.17 FuelPositive Corporation
- 10.18 Casale SA
- 10.19 Green Hydrogen Systems
- 10.20 McPhy Energy S.A.
- 10.21 Enapter S.r.l.
- 10.22 Technip Energies N.V.
- 10.23 MAN Energy Solutions

 氨市場:2026-2032年全球市場預測(按類型、製造流程、水分含量、物理狀態、應用、最終用途和分銷管道分類)
 2026年全球選擇性催化還原(SCR)氨鼓泡器市場報告
 全球氨市場(2027-2037 年)
 全球氨市場:按類型、銷售管道、終端用戶產業和地區分類-預測(至2031年)
 液態有機氫載體市場預測至2034年-全球分析(按載體類型、製程類型、組成、技術類型、分銷模式、業務規模、經營模式、應用、最終用戶和地區分類)
 氨市場規模、佔有率、趨勢和預測:按物理形態、應用、最終用途行業和地區分類,2026-2034年
 氨市場:依形態、應用、終端用戶產業及地區分類2026年全球液態有機氫載體(LOHC)脫氫裝置裝置市場報告無水氨蒸發器市場:按類型、熱源、容量、終端用戶產業、應用和銷售管道,全球預測,2026-2032年
 氨市場分析及預測(至2035年):類型、產品、應用、技術、終端用戶、製程、組件、簡介