


 |
市場調查報告書
商品編碼
2122392
工業電池:市場佔有率分析、產業趨勢與統計、成長預測(2026-2031)Industrial Battery - Market Share Analysis, Industry Trends & Statistics, Growth Forecasts (2026 - 2031) |
||||||

※ 本網頁內容可能與最新版本有所差異。詳細情況請與我們聯繫。
根據 Mordor Intelligence 估計,2026 年工業電池市值為 419.3 億美元,預計在預測期(2026-2031 年)內將以 17.45% 的複合年成長率成長,到 2031 年達到 937.1 億美元。
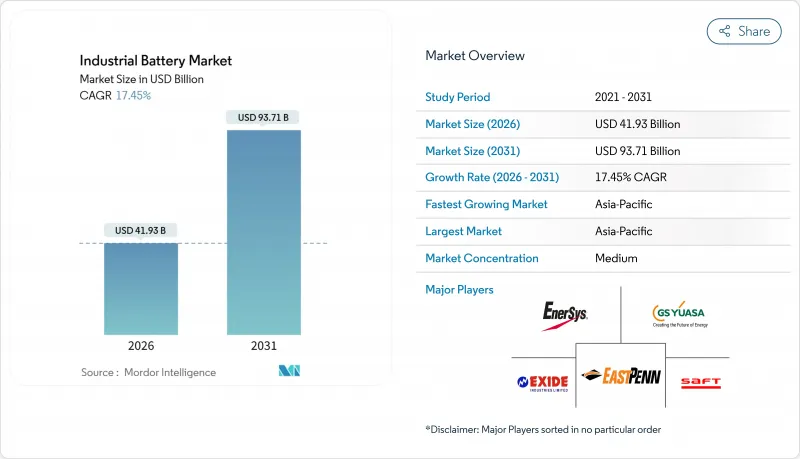
本報告按技術(鋰離子電池、鉛酸電池、鎳基電池、其他電池)、應用(堆高機和電力系統、通訊備用電源、UPS/資料中心、電網級儲能系統、其他電池)、終端用戶產業(電力和公用事業、石油和天然氣、製造和倉儲業、電信、其他產業)以及地區(北美、歐洲、亞太地區、分類、石油和非洲)。
全球工業電池市場趨勢與洞察
鋰離子電池的成本曲線正在下降。
2024年,電池組價格降至每度電115美元,創下2017年以來的最大跌幅。此外,由於電芯整合到電池組中降低了營運成本,主要銀行預測到2026年底,價格將跌破每千瓦時80美元。 2024年初,中國磷酸鐵鋰電池的交易價格為每千瓦時50至53美元,迫使西方競爭對手要麼轉向本地生產,要麼降低利潤率。目前,預計到2035年,公用事業規模的4小時備用電源系統價格將達到每千瓦時147至243美元,這將削弱鉛酸電池在通訊備用電源領域的整體成本優勢。儘管人們仍然擔憂熱失控問題,但買家擴大基於10年生命週期分析進行預算,導致鋰離子電池的訂單量增加。
擴大利用可再生能源的儲能系統(ESS)的引入。
預計到2025年10月,電網級電池部署量將以每年38%的速度成長,僅2025年就將新增94吉瓦/247吉瓦時。此外,由於間歇性的太陽能和風能發電組合需要穩定容量,預計到2035年,這一數字將飆升至220吉瓦/972吉瓦時。在美國,受投資稅額扣抵和州政府法規的推動,計劃在2025年新增18.2吉瓦的儲能容量。在中國,省級法規強制要求10%至20%的新建可再生能源發電發電廠配備儲能設施,這將創造短期需求,但由於套利利潤上限的限制,盈利尚不確定。在印度,目標是2026年安裝4吉瓦時的離網儲能,以穩定電網,而印度的電網中可再生能源佔比很高。在歐洲,頻率調節溢價對電池仍然很有吸引力,但互聯線路的擴張可能會在 2028 年後縮小差距。
重要礦產價格波動
碳酸鋰價格自2022年高峰暴跌75%,但由於庫存下降和強勁需求,2025年價格再次收緊。這給合約談判和現金流規劃帶來了不確定性。中國加工了全球90%以上的負極材料和85%的正極材料,增加了西方買家的地緣政治風險。精製磷酸和高純度硫酸錳的供應瓶頸可能導致原物料成本在一個季度內翻番,迫使買家縮短採購週期並增加營運資金緩衝。美國的戰略儲備更多是為了安全而非價格,這可能會限制現貨市場的供應。
細分市場分析
預計到2025年,鋰離子電池的銷售額將佔總銷售額的51.26%,並預計在2031年之前以18.56%的複合年成長率成長,從而鞏固主導地位。鉛酸電池傳統上佔據的通訊和啟動/照明等細分市場正在萎縮,因為買家更加關注產品生命週期的總成本。鎳基電池在航太和鐵路領域仍佔據重要地位,但其銷售量停滯反映了鋰離子電池更廣泛的工作溫度範圍。
新興的鈉離子電池利用儲量豐富的鈉取代稀少的鋰,預計與磷酸鋰鐵鋰(LFP)電池相比,成本可降低20-30%。同時,釩液流電池因其超過6小時的放電持續時間而備受關注。固態電池原型機的成本仍是鋰離子電池的3-5倍,因此大多數工業買家持觀望態度,而非立即採用。回收法規正在加速歐洲鉛酸電池的淘汰,投資正轉向利潤更高的鋰電池產品線。
區域分析
預計亞太地區將主導工業電池市場,到2025年將佔全球銷售額的49.92%,並維持19.53%的年均成長率至2031年。中國佔全球電池產量的85%,其需求受到將10-20%的儲能資源整合到新型可再生能源的需求的推動。同時,印度正透過一項24億美元的生產連結獎勵計畫計畫(PLI)吸引50吉瓦時的國內產能。韓國的LG能源解決方案公司和三星SDI公司總合擁有超過520吉瓦時的產能,產品出口到北美和歐洲。日本則繼續專注於為汽車和特定工業應用領域生產高鎳電池。
北美已宣布每千瓦時電力生產可享受35美元的稅額扣抵,併計劃從2022年起建設30多座超級工廠,目標是到2030年實現1太瓦時的發電能力。加拿大憑藉其豐富的礦產資源,已成為歐美替代的電力生產基地,但其提煉能力的發展未能跟上採礦能力的步伐。墨西哥正在吸引組裝投資,但在授權流程方面面臨瓶頸。
歐洲的《基本原物料法案》旨在2030年實現10%的國內原物料採購率和40%的本地加工率,以支持Northvolt、ACC和CATL等歐洲企業的生產線。德國、法國和英國在頻率調節儲能領域處於領先地位,但互聯線路的擴張可能會在2028年後對利潤率造成壓力。北歐水力發電正在吸引高能耗的陰極材料合成,但產量挑戰正在減緩生產擴張的步伐。
南美洲、中東和非洲仍處於發展階段,雖然巴西和阿拉伯聯合大公國(阿拉伯聯合大公國)正在試點公用事業規模的項目,但由於製造能力有限,其規模與亞太地區和北美相比仍然較小。
其他好處:
- Excel格式的市場預測(ME)表
- 3個月的分析師支持
目錄
第1章:引言
- 市場分析與定義的前提條件
- 分析範圍
第2章 分析方法
第3章執行摘要
第4章 市場狀況
- 市場概覽
- 市場促進因素
- 鋰離子電池的成本曲線正在下降。
- 開發由可再生能源驅動的儲能系統(ESS)
- 倉庫自動化和自動導引車(AGV)正在迅速發展。
- 資料中心的直流微電網
- 關於通訊塔存放的強制性要求
- 原始設備製造商主導的二次租賃模式
- 市場限制因素
- 重要礦產價格波動
- 關於鉛酸污染的法規
- 「觀望」態度對半導體技術的影響
- BESS的火災風險保險費正在飆升。
- 電池/原物料價格趨勢及預測
- 進出口分析
- 供應鏈分析
- 監理情勢
- 技術展望
- 波特五力分析
第5章:預測市場規模與成長率
- 透過技術
- 鋰離子
- 鉛酸(鉛酸電池)
- 鎳基
- 其他(包括液流電池和鈉離子電池)
- 透過使用
- 堆高機和動力設備
- 通訊備份
- UPS/資料中心
- 網格級儲能系統
- 其他(包括自動導引運輸車、鐵路和船舶)
- 按最終用戶行業分類
- 電力和公用事業
- 石油和天然氣
- 製造/倉儲業
- 溝通
- 其他(包括運輸和物流)
- 按地區
- 北美洲
- 美國
- 加拿大
- 墨西哥
- 歐洲
- 德國
- 法國
- 英國
- 義大利
- 西班牙
- 北歐國家
- 俄羅斯
- 其他歐洲國家
- 亞太地區
- 中國
- 日本
- 印度
- 韓國
- 東南亞國協
- 其他亞太國家
- 南美洲
- 巴西
- 阿根廷
- 其他南美國家
- 中東和非洲
- 阿拉伯聯合大公國
- 沙烏地阿拉伯
- 南非
- 其他中東和非洲國家
- 北美洲
第6章 競爭情勢
- 市場集中度
- 策略趨勢(併購、聯盟、購電協議)
- 市場佔有率分析(主要公司的市場排名和佔有率)
- 公司簡介
- EnerSys
- East Penn Manufacturing
- Exide Industries
- GS Yuasa Corp.
- Saft Groupe SA
- Amara Raja Batteries
- Panasonic Energy
- CATL
- BYD Co. Ltd.
- LG Energy Solution
- Samsung SDI
- Johnson Controls
- Leoch Int'l
- JYC Battery
- Narada Power
- Crown Battery
- Hoppecke Batteries
- NorthStar Battery
- Trojan Battery
- Vision Group
第7章 市場機會與未來展望
According to Mordor Intelligence, the industrial battery market size is estimated at USD 41.93 billion in 2026, and is expected to reach USD 93.71 billion by 2031, at a CAGR of 17.45% during the forecast period (2026-2031).
This report is Segmented by Technology (Lithium-Ion, Lead-Acid, Nickel-Based, and Others), Application (Forklift and Motive Power, Telecom Backup, UPS/Data Centres, Grid-Scale ESS, and Others), End-User Industry (Power and Utilities, Oil and Gas, Manufacturing and Warehousing, Telecom, and Others), and Geography (North America, Europe, Asia-Pacific, South America, and Middle East and Africa).
Global Industrial Battery Market Trends and Insights
Declining Lithium-Ion Battery Cost Curve
Pack prices slid to USD 115 per kWh in 2024, the sharpest drop since 2017, and major banks forecast sub-USD 80 per kWh by late 2026 as cell-to-pack integration cuts overhead. Chinese LFP cells traded at USD 50-53 per kWh in early 2024, forcing Western rivals to localize or cede margin. Utility-scale four-hour systems are now modeled to reach USD 147-243 per kWh by 2035, eroding lead-acid's total-cost supremacy in telecom backup. Buyers increasingly align budgets to ten-year life-cycle analyses, tilting orders toward lithium-ion despite residual thermal-runaway concerns.
Renewable-Powered ESS Build-Outs
Grid-scale battery additions rose 38% year-over-year to October 2025 and are set to add 94 GW/247 GWh in 2025 alone, jumping to 220 GW/972 GWh by 2035 as intermittent solar and wind portfolios require firming capacity. The United States plans 18.2 GW of storage in 2025, benefiting from investment-tax credits and state mandates. China's provincial rules force new renewables to pair 10-20% storage, creating near-term demand, although capped arbitrage margins cloud profitability. India targets 4 GWh of standalone storage by 2026 to stabilize high-renewable grids. Europe's frequency-regulation premiums remain attractive for batteries, though interconnector growth could compress spreads after 2028.
Critical-Mineral Price Volatility
Lithium carbonate plunged 75% from its 2022 peak, then tightened again in 2025 as inventory destocking met robust demand, unsettling contract negotiations and cash-flow planning. China processes more than 90% of anode materials and 85% of cathodes, amplifying geopolitical exposure for Western buyers. Supply bottlenecks in purified phosphoric acid and high-purity manganese sulfate can double input costs within a quarter, prompting buyers to shorten procurement cycles and raise working-capital buffers. U.S. strategic stockpiles address security rather than price, and may constrict spot availability.
Other drivers and restraints analyzed in the detailed report include:
- Warehouse Automation & AGVs Surge
- DC Micro-Grids in Data Centres
- Lead-Acid Pollution Regulations
For complete list of drivers and restraints, kindly check the Table Of Contents.
Segment Analysis
Lithium-ion held 51.26% revenue in 2025 and is projected to compound at 18.56% to 2031, solidifying its leadership in the industrial battery market. Lead-acid's legacy telecom and starter-lighting niches shrink as buyers weigh total cost over calendar life. Nickel-based chemistries stay relevant in aerospace and rail, yet flat volumes reflect lithium-ion's broadened temperature range.
Emerging sodium-ion cells promise 20-30% cost savings versus LFP by swapping abundant sodium for scarce lithium, while vanadium redox flow batteries gain traction for six-hour-plus discharge durations. Solid-state prototypes remain three-to-five-times costlier than lithium-ion, prompting most industrial buyers to monitor rather than commit. Recycling mandates accelerate lead-acid's retreat in Europe, redirecting investment to higher-margin lithium-based lines.
Complete Report Scope:
- By Technology
- Lithium-ion
- Lead-acid
- Nickel-based
- Others (incl. Flow Battery, Sodium-ion)
- By Application
- Forklift and Motive Power
- Telecom Backup
- UPS/Data Centres
- Grid-Scale ESS
- Others (incl Automated Guided Vehicles, Rail and Marine)
- By End-User Industry
- Power and Utilities
- Oil and Gas
- Manufacturing and Warehousing
- Telecom
- Others (incl Transportation and Logistics)
- By Geography
- North America
- United States
- Canada
- Mexico
- Europe
- Germany
- France
- United Kingdom
- Italy
- Spain
- Nordic Countries
- Russia
- Rest of Europe
- Asia-Pacific
- China
- Japan
- India
- South Korea
- ASEAN Countries
- Rest of Asia-Pacific
- South America
- Brazil
- Argentina
- Rest of South America
- Middle East and Africa
- United Arab Emirates
- Saudi Arabia
- South Africa
- Rest of Middle East and Africa
- North America
Geography Analysis
Asia-Pacific dominated the industrial battery market with 49.92% revenue in 2025 and will grow at 19.53% through 2031. China's 85% share of global cell output and mandatory 10-20% storage pairing for new renewables spur demand, while India's USD 2.4 billion Production-Linked Incentive lures 50 GWh of domestic capacity. South Korea's LG Energy Solution and Samsung SDI exceed 520 GWh of combined capacity, exporting to North America and Europe. Japan remains focused on high-nickel cells for automotive and niche industrial uses.
North America benefits from a USD 35 per kWh production credit and 30+ gigafactory announcements since 2022, targeting 1 TWh of capacity by 2030. Canada's mineral endowment positions it as a Western alternative, although refining lags extraction. Mexico attracts assembly investments but faces permitting bottlenecks.
Europe's Critical Raw Materials Act seeks 10% domestic sourcing and 40% local processing by 2030, supporting Northvolt, ACC, and CATL's European lines. Germany, France, and the U.K. lead in frequency-regulation storage, though expanded interconnectors may pressure margins after 2028. Nordic hydropower attracts energy-intensive cathode synthesis, yet yield challenges slow ramp-ups.
South America and the Middle East-Africa remain nascent, with Brazil and the U.A.E. piloting utility-scale projects, but limited manufacturing keeps scale small relative to Asia-Pacific and North America.
- EnerSys
- East Penn Manufacturing
- Exide Industries
- GS Yuasa Corp.
- Saft Groupe SA
- Amara Raja Batteries
- Panasonic Energy
- CATL
- BYD Co. Ltd.
- LG Energy Solution
- Samsung SDI
- Johnson Controls
- Leoch Int'l
- JYC Battery
- Narada Power
- Crown Battery
- Hoppecke Batteries
- NorthStar Battery
- Trojan Battery
- Vision Group
Additional Benefits:
- The market estimate (ME) sheet in Excel format
- 3 months of analyst support
TABLE OF CONTENTS
1 Introduction
- 1.1 Study Assumptions & Market Definition
- 1.2 Scope of the Study
2 Research Methodology
3 Executive Summary
4 Market Landscape
- 4.1 Market Overview
- 4.2 Market Drivers
- 4.2.1 Declining lithium-ion battery cost curve
- 4.2.2 Renewable-powered ESS build-outs
- 4.2.3 Warehouse automation & AGVs surge
- 4.2.4 DC micro-grids in data centres
- 4.2.5 Telecom tower storage mandates
- 4.2.6 OEM-driven 2nd-life leasing models
- 4.3 Market Restraints
- 4.3.1 Critical-mineral price volatility
- 4.3.2 Lead-acid pollution regulations
- 4.3.3 Solid-state tech "wait-and-see" effect
- 4.3.4 Rising BESS fire-risk insurance costs
- 4.4 Battery/Raw-Material Price Trends & Forecast
- 4.5 Import and Export Analysis
- 4.6 Supply-Chain Analysis
- 4.7 Regulatory Landscape
- 4.8 Technological Outlook
- 4.9 Porter's Five Forces
- 4.9.1 Bargaining Power of Suppliers
- 4.9.2 Bargaining Power of Buyers
- 4.9.3 Threat of New Entrants
- 4.9.4 Threat of Substitutes
- 4.9.5 Competitive Rivalry
5 Market Size & Growth Forecasts
- 5.1 By Technology
- 5.1.1 Lithium-ion
- 5.1.2 Lead-acid
- 5.1.3 Nickel-based
- 5.1.4 Others (incl. Flow Battery, Sodium-ion)
- 5.2 By Application
- 5.2.1 Forklift and Motive Power
- 5.2.2 Telecom Backup
- 5.2.3 UPS/Data Centres
- 5.2.4 Grid-Scale ESS
- 5.2.5 Others (incl Automated Guided Vehicles, Rail and Marine)
- 5.3 By End-User Industry
- 5.3.1 Power and Utilities
- 5.3.2 Oil and Gas
- 5.3.3 Manufacturing and Warehousing
- 5.3.4 Telecom
- 5.3.5 Others (incl Transportation and Logistics)
- 5.4 By Geography
- 5.4.1 North America
- 5.4.1.1 United States
- 5.4.1.2 Canada
- 5.4.1.3 Mexico
- 5.4.2 Europe
- 5.4.2.1 Germany
- 5.4.2.2 France
- 5.4.2.3 United Kingdom
- 5.4.2.4 Italy
- 5.4.2.5 Spain
- 5.4.2.6 Nordic Countries
- 5.4.2.7 Russia
- 5.4.2.8 Rest of Europe
- 5.4.3 Asia-Pacific
- 5.4.3.1 China
- 5.4.3.2 Japan
- 5.4.3.3 India
- 5.4.3.4 South Korea
- 5.4.3.5 ASEAN Countries
- 5.4.3.6 Rest of Asia-Pacific
- 5.4.4 South America
- 5.4.4.1 Brazil
- 5.4.4.2 Argentina
- 5.4.4.3 Rest of South America
- 5.4.5 Middle East and Africa
- 5.4.5.1 United Arab Emirates
- 5.4.5.2 Saudi Arabia
- 5.4.5.3 South Africa
- 5.4.5.4 Rest of Middle East and Africa
- 5.4.1 North America
6 Competitive Landscape
- 6.1 Market Concentration
- 6.2 Strategic Moves (M&A, Partnerships, PPAs)
- 6.3 Market Share Analysis (Market Rank/Share for key companies)
- 6.4 Company Profiles (includes Global level Overview, Market level overview, Core Segments, Financials as available, Strategic Information, Products & Services, and Recent Developments)
- 6.4.1 EnerSys
- 6.4.2 East Penn Manufacturing
- 6.4.3 Exide Industries
- 6.4.4 GS Yuasa Corp.
- 6.4.5 Saft Groupe SA
- 6.4.6 Amara Raja Batteries
- 6.4.7 Panasonic Energy
- 6.4.8 CATL
- 6.4.9 BYD Co. Ltd.
- 6.4.10 LG Energy Solution
- 6.4.11 Samsung SDI
- 6.4.12 Johnson Controls
- 6.4.13 Leoch Int'l
- 6.4.14 JYC Battery
- 6.4.15 Narada Power
- 6.4.16 Crown Battery
- 6.4.17 Hoppecke Batteries
- 6.4.18 NorthStar Battery
- 6.4.19 Trojan Battery
- 6.4.20 Vision Group
7 Market Opportunities & Future Outlook
- 7.1 White-space & Unmet-Need Assessment

 工業電池市場-2026-2032年全球市場預測
 北美工業電池:市場佔有率分析、產業趨勢與統計及成長預測(2026-2031 年)
 工業電池市場規模、佔有率和趨勢分析報告:按類型、應用、地區和細分市場分類(2026-2033 年)
 全球工業電池市場規模、佔有率、趨勢和成長分析報告(2026-2034年)
 工業電池市場報告:按驅動系統、技術、應用和地區分類(2026-2034 年)
 工業電池市場:按電池類型、應用和地區分類
 工業電池市場規模、佔有率和成長分析(適用於物料輸送設備):按電池類型、應用、最終用戶、技術採用、銷售管道和地區分類-2026-2033年產業預測
 2026年全球工業機器人電池市場報告2026年全球工業電池市場報告
 工業電池市場 - 全球產業規模、佔有率、趨勢、機會、預測(按類型、應用、地區和競爭格局分類),2021-2031年