


 |
市場調查報告書
商品編碼
2122368
液流電池:市場佔有率分析、產業趨勢與統計、成長預測(2026-2031)Flow Battery - Market Share Analysis, Industry Trends & Statistics, Growth Forecasts (2026 - 2031) |
||||||

※ 本網頁內容可能與最新版本有所差異。詳細情況請與我們聯繫。
根據 Mordor Intelligence 預測,液流電池市場預計將從 2025 年的 11.5 億美元成長到 2026 年的 13.9 億美元,到 2031 年達到 38.8 億美元,2026 年至 2031 年的複合年成長率預計為 22.84%。
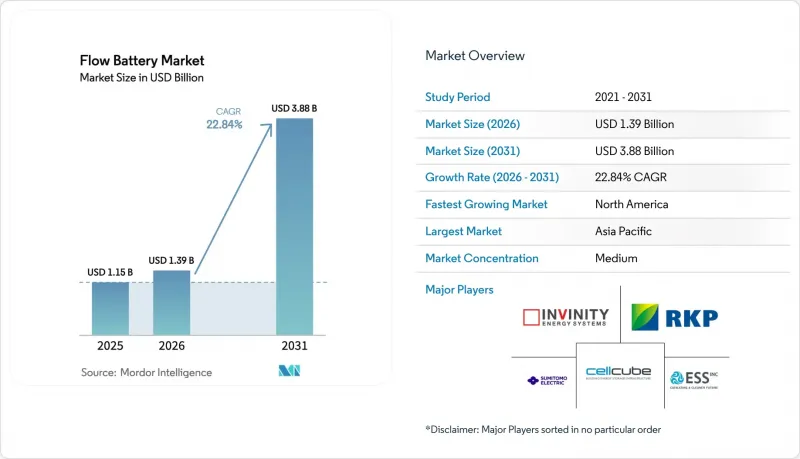
本報告涵蓋電池類型(釩氧化還原電池、鋅溴電池、鐵電池、鋅鐵電池、全鐵電池)、系統規模(大型、中型、小規模)、應用(可再生能源併網、峰值功率處理/負載轉移、微電網和離網)、最終用戶(公用事業、商業/工業、住宅)和地區(北美、歐洲、亞太地區、南美等)。
全球液流電池市場趨勢及洞察
可再生能源驅動的長期儲能需求
2024年,中國西北地區風能和太陽能發電的棄光率達到可再生能源發電的8.3%,導致業者損失21億美元的收入。目前,省級法規要求儲能時長達6至12小時,液流電池市場透過分離額定功率和能量容量,在經濟上滿足了這項要求。加州到2032年實現11.5吉瓦的長期儲能目標,優先考慮能夠持續放電8小時以上的技術,這實際上排除了大多數鋰離子電池系統。澳洲的亞德拉馬卡能源計畫和德國的負電價現象表明,當往返劣化可以忽略不計時,套利是有利可圖的。
降低電解租賃成本(新模式)
Panzifa 的 100 兆瓦/500 兆瓦時專案率先採用電解租賃模式,將初步投資降低了 35-40%。該模式只需每月支付每千瓦時 0.015 美元的費用,而無需一次性購買釩。 Largo Clean Energy 的「VPURE+」電解液目前提供 20 年的性能保證,並在使用壽命結束後回購,其模式與北美和歐洲的太陽能購電合約結構類似。在租賃會計處理下,電解被累計營運費用,使公用事業公司的內部收益率提高了多達 300 個基點。南非的 Bushfeld Minerals 公司正在將此模式應用於撒哈拉以南非洲地區礦場的微電網。
高昂的初始資本支出 (CAPEX) 和釩價格波動
截至2025年,10兆瓦時以下項目的承包釩氧化還原系統平均價格預計在每千瓦時600至750美元之間。假設電解佔總成本的30%至40%,2024年釩價上漲15%將導致均衡成本增加3%至4%。美國95%的釩依賴進口,使得開發商面臨關稅和供應中斷的風險。雖然租賃模式可以降低初始成本,但在尖峰時段和離峰時段價格差異有限的市場中,這種模式會縮小套利機會。
細分市場分析
釩液流電池憑藉其經證實的2萬次循環壽命和中國強大的供應鏈,預計到2025年將佔市場佔有率的80.2%,成為液流電池市場的核心化學品。鋅溴液流電池的電解成本僅為釩液流電池的三分之一,且授權制度更為簡便,預計到2031年將以25.1%的複合年成長率成長,並預計在2031年佔據商用和工業液流電池市場12%的佔有率。鐵基液流電池在ESS Tech向沙加緬度交付75兆瓦時系統後,正逐漸獲得認可。其無毒電解在人口密集的都市區備受關注。鋅鐵基和鐵基液流電池由於腐蝕和效率低下等問題,目前仍處於試驗階段,市佔率不足1%。
在中國,礦山開採、電解生產和組件製造實現了垂直整合,使得公用事業規模的釩成本低於每千瓦時300美元,並實現了20年的質保,從而支持了液流電池市場的規模經濟。鋅溴液流電池系統在澳洲和德國正逐漸普及,工商業用戶正在採用50-200千瓦時的模組化電池組,這些電池組無需對消防系統維修即可安裝在變電站中。鐵基液流電池市場的競爭對手正尋求美國聯邦政府的津貼優先考慮國產礦產資源。
到2025年,裝置容量超過10兆瓦時(MWh)的儲能系統將佔總銷量的61.8%。這主要得益於電力公司將長期儲能資產集中部署在多個變電站,以實現規模經濟,推動液流電池市場擴張。 2025年,小規模系統(以兆瓦時計算)的比例將僅為8%,但隨著微電網在島嶼和偏遠礦區的普及,預計將以28.9%的複合年成長率成長。 1至10兆瓦時的中型儲能系統旨在降低用電需求費用,但在空間受限的地區,它們正面臨來自鋰離子電池日益激烈的競爭。
成本曲線有利於面積較大的系統。在大連榮科鄂爾多斯計畫(200兆瓦/800兆瓦時),使用超過15公尺高的鋼製儲罐,使得每千瓦時的成本低於300美元。同時,微電網開發商正專注於容量小於1兆瓦時的模組化貨櫃式單元,儘管其成本高達每千瓦時550-600美元。加州的學校和資料中心正在試行2-4兆瓦時的系統,這些系統可降低峰值功率,並將需求成本降低每千瓦20-30美元。預計到2031年,小規模銷售仍將僅佔液流電池市場佔有率的一小部分,但它們將為住宅應用的可行性提供重要的示範。
區域分析
預計2025年,亞太地區將引領液流電池市場,佔44.7%的銷售額。這主要得益於中國擁有超過2吉瓦時的液流電池運作,並佔全球70%的釩產量。儘管各省強制要求將10-20%的可再生能源額定發電量與儲能結合,從而形成了一個穩固的買家基礎,但2025年2月的政策變化可能會抑制投機性建設。隨著核能發電廠除役導致備用容量收窄,日本柏崎計畫表明,人們對該領域的興趣重新燃起。
北美是成長最快的地區,年複合成長率高達25.6%,這得益於《通膨控制法案》提供的30%至50%的投資稅額扣抵以及美國能源局提供的示範津貼。加州電力公司正在增加超過300兆瓦時的需求,以實現其2026年的目標;同時,德克薩斯州的ERCOT改革為無限循環服務提供了激勵措施。在加拿大,亞伯達的微電網計畫已初見成效,但由於缺乏聯邦獎勵,企劃案融資仍處於起步階段。
預計到2025年,歐洲將佔全球銷售額的約15%。德國的能源轉型計劃(Energiewende)和英國的容量競標提供15年合約,以降低資本風險。荷蘭和西班牙正在考慮部署液流電池用於黑啟動和緩解擁塞。儘管由於許可程序和危險物質相關法規的分散性,進度較為緩慢,但國際電工委員會(IEC)的標準化工作正在減少認證延誤。
儘管中東和非洲的累計總量不足50兆瓦時,但隨著規劃中的太陽能和風能發電裝置容量超過50吉瓦,預計需求將持續成長,這主要得益於沙烏地阿拉伯的「2030願景」和南非為礦業建設的微電網計畫。拉丁美洲仍處於規劃階段,巴西電力公司傾向利用水力發電,而阿根廷則專注於鋰離子電池以滿足四小時的電力高峰需求。
其他好處:
- Excel格式的市場預測(ME)表
- 3個月的分析師支持
目錄
第1章:引言
- 研究假設和市場定義
- 調查範圍
第2章:調查方法
第3章執行摘要
第4章 市場狀況
- 市場概覽
- 市場促進因素
- 對可再生能源驅動的長期儲能的需求
- 降低電解租賃成本(新模式)
- 堆疊製造和薄膜技術的進步
- 中國電解產能擴張
- 公共產業的韌性與監管義務
- 市場限制因素
- 高昂的初始資本支出(CAPEX)和釩價格波動
- 低能量密度電池與鋰離子電池的比較
- 缺乏全球標準/實施記錄
- 大型電解儲槽的授權程序十分複雜。
- 供應鏈分析
- 監理情勢
- 技術展望
- 波特五力模型
第5章 市場規模與成長預測
- 依電池類型
- 釩氧化還原流動電池
- 鋅溴液流電池
- 鐵流電池
- 鋅鐵液流電池
- 全鐵液流電池
- 按系統大小
- 大型(10兆瓦時或以上)
- 中等規模(1-10兆瓦時)
- 小規模(小於 1 兆瓦時)
- 透過使用
- 可再生能源併網
- 電網調峰/負載轉移
- 微電網和離網
- 最終用戶
- 公用事業
- 商業和工業(C&I)
- 住宅
- 按地區
- 北美洲
- 美國
- 加拿大
- 歐洲
- 德國
- 英國
- 法國
- 義大利
- 北歐國家
- 俄羅斯
- 其他歐洲國家
- 亞太地區
- 中國
- 日本
- 印度
- 韓國
- 東南亞國協
- 澳洲和紐西蘭
- 其他亞太國家
- 南美洲
- 巴西
- 阿根廷
- 其他南美國家
- 中東和非洲
- 沙烏地阿拉伯
- 阿拉伯聯合大公國
- 南非
- 埃及
- 其他中東和非洲國家
- 北美洲
第6章 競爭情勢
- 市場集中度
- 策略趨勢(併購、聯盟、購電協議)
- 市場佔有率分析(主要公司的市場排名和佔有率)
- 公司簡介
- VRB Energy
- ESS Tech Inc.
- Vanadis Power GmbH
- Primus Power Corporation
- Redflow Ltd.
- Invinity Energy Systems PLC
- Dalian Rongke Power Co. Ltd.
- CellCube Energy Storage Systems Inc.
- Stryten Energy
- H2 Inc.
- Sumitomo Electric Industries Ltd.
- VFlow Tech Pte Ltd.
- Elestor BV
- Enerox GmbH
- Largo Clean Energy
- Lockheed Martin Corp.(GridStar Flow)
- SCHMID Energy Systems
- StorEn Technologies Inc.
- VoltStorage GmbH
- Jenabatteries GmbH
- Zinc8 Energy Solutions
- Big Pawer Co.
- Shanghai Electric Energy Storage Tech
第7章 市場機會與未來展望
According to Mordor Intelligence, the flow battery market size is expected to increase from USD 1.15 billion in 2025 to USD 1.39 billion in 2026 and reach USD 3.88 billion by 2031, growing at a CAGR of 22.84% over 2026-2031.
This report is Segmented by Battery Type (Vanadium Redox, Zinc-Bromine, Iron, Zinc-Iron, and All-Iron), System Size (Large-Scale, Medium-Scale, and Small-Scale), Application (Renewable Energy Integration, Grid-Peaking/Load-Shifting, and Microgrids and Off-Grid), End-User (Utilities, Commercial and Industrial, and Residential), and Geography (North America, Europe, Asia-Pacific, South America, and More)
Global Flow Battery Market Trends and Insights
Renewables-Driven Long-Duration Storage Demand
Curtailment of wind and solar reached 8.3% of renewable generation in China's northwest during 2024, costing operators USD 2.1 billion in lost revenue. Provincial rules now call for 6-12-hour storage, an interval that the flow battery market fulfills economically through decoupled power and energy ratings. California's 11.5 GW long-duration target by 2032 prioritizes technologies with eight-plus hour discharge, effectively excluding most lithium-ion systems. Australia's Yadlamalka Energy project and Germany's negative-pricing events showcase arbitrage earnings when round-trip degradation is negligible.
Falling Electrolyte Leasing Costs (New Model)
Panzhihua's 100 MW/500 MWh project pioneered electrolyte leasing that trimmed upfront capital 35-40%, replacing lump-sum vanadium purchase with USD 0.015 per kWh monthly fees. Largo Clean Energy's VPURE+ now offers 20-year performance guarantees and end-of-life buyback in North America and Europe, mirroring solar power-purchase constructs. Lease accounting recasts electrolyte as an operating expense, raising internal rates of return by up to 300 basis points for utilities. South Africa's Bushveld Minerals is porting the model to mining microgrids across sub-Saharan Africa.
High Upfront CAPEX & Vanadium Price Volatility
Turnkey vanadium redox systems averaged USD 600-750 per kWh for sub-10 MWh projects in 2025. Vanadium prices rose 15% in 2024, lifting levelized costs 3-4% when electrolyte represents 30-40% of spend. The United States imports 95% of its vanadium, exposing developers to tariff and disruption risk. Lease models mitigate upfront outlay yet narrow arbitrage margins in markets with limited peak-to-off-peak spreads.
Other drivers and restraints analyzed in the detailed report include:
- Stack Manufacturing And Membrane Advances
- China's Electrolyte Capacity Scale-Up
- Low Energy Density Versus Lithium-Ion
For complete list of drivers and restraints, kindly check the Table Of Contents.
Segment Analysis
Vanadium redox captured 80.2% of 2025 revenue on the back of a proven 20,000-cycle life and China's supply-chain control, positioning it as the anchor chemistry of the flow battery market. Zinc-bromine systems are projected to grow 25.1% CAGR through 2031, owing to one-third electrolyte cost versus vanadium and simpler permitting regimes, which help them penetrate the commercial and industrial flow battery market share at 12% by 2031. Iron flow chemistry commands growing mindshare after ESS Tech delivered 75 MWh to Sacramento; its non-toxic electrolyte appeals in dense urban settings. Zinc-iron and all-iron remain pilot-scale due to corrosion and low efficiency, holding less than 1% revenue.
China's vertically integrated mines, electrolyte plants, and module factories drive utility-scale vanadium costs below USD 300 per kWh, enabling 20-year warranties that protect flow battery market size economics. Zinc-bromine uptake is notable in Australia and Germany, where C&I users adopt modular 50-200 kWh racks that fit transformer yards without fire-suppression retrofits. Iron flow contenders aim to win U.S. federal grants that prioritize domestic mineral content.
Installations above 10 MWh held 61.8% of revenue in 2025 as utilities centralize long-duration assets across multiple substations, yielding flow battery market size advantages via economies of scale. Small-scale units, while only 8% of 2025 megawatt-hours, are set to expand 28.9% CAGR on microgrid adoption in islands and remote mines. Medium 1-10 MWh systems target demand-charge mitigation, but lithium-ion competition is intense where space premiums are high.
Cost curves favor big footprints. Dalian Rongke's 200 MW/800 MWh Ordos site achieved sub-USD 300 per kWh by using steel tanks taller than 15 m, whereas microgrid developers value modular containerized units under 1 MWh despite higher USD 550-600 per kWh tags. California schools and data centers are piloting 2-4 MWh systems that shave peaks to cut USD 20-30 per kW demand charges. Small-scale sales will remain a minority of the flow battery market share to 2031, yet supply critical proof points for residential viability.
Complete Report Scope:
- By Battery Type
- Vanadium Redox Flow Battery
- Zinc-Bromine Flow Battery
- Iron Flow Battery
- Zinc-Iron Flow Battery
- All-Iron Flow Battery
- By System Size
- Large-Scale (Above 10 MWh)
- Medium-Scale (1 to 10 MWh)
- Small-Scale (Up to 1 MWh)
- By Application
- Renewable Energy Integration
- Grid-Peaking/Load-Shifting
- Microgrids and Off-Grid
- By End-User
- Utilities
- Commercial and Industrial (C&I)
- Residential
- By Geography
- North America
- United States
- Canada
- Europe
- Germany
- United Kingdom
- France
- Italy
- NORDIC Countries
- Russia
- Rest of Europe
- Asia-Pacific
- China
- Japan
- India
- South Korea
- ASEAN Countries
- Australia and New Zealand
- Rest of Asia-Pacific
- South America
- Brazil
- Argentina
- Rest of South America
- Middle East and Africa
- Saudi Arabia
- United Arab Emirates
- South Africa
- Egypt
- Rest of Middle East and Africa
- North America
Geography Analysis
Asia-Pacific led the flow battery market with 44.7% revenue in 2025 because China commissioned over 2 GWh of capacity and commands 70% of global vanadium output. Provincial mandates pairing 10-20% of renewable nameplate with storage created a captive buyer base, though February 2025 policy changes may temper speculative builds. Japan's Kashiwazaki project underscores renewed interest as nuclear retirements tighten reserve margins.
North America is the fastest-growing region at 25.6% CAGR thanks to the Inflation Reduction Act's 30-50% investment tax credit and DOE demonstration grants. California utilities have queued over 300 MWh to hit 2026 goals, while Texas ERCOT reforms reward unlimited-cycling services. Canada sees early activity in Alberta microgrids, but project finance remains nascent without federal incentives.
Europe captured near 15% of 2025 revenue. Germany's Energiewende and the United Kingdom's capacity auctions offer 15-year contracts that derisk capital. The Netherlands and Spain explore flow batteries for black-start and congestion relief. Fragmented permitting and hazardous-materials rules lengthen timelines, yet IEC standardization is reducing certification delays.
The Middle East and Africa count under 50 MWh cumulative, yet Vision 2030 in Saudi Arabia and South African mining microgrids are poised to lift demand as solar and wind pipelines pass 50 GW. Latin America remains exploratory; Brazilian utilities favor hydropower reservoirs, and Argentina leans toward lithium-ion for four-hour peaks.
- VRB Energy
- ESS Tech Inc.
- Vanadis Power GmbH
- Primus Power Corporation
- Redflow Ltd.
- Invinity Energy Systems PLC
- Dalian Rongke Power Co. Ltd.
- CellCube Energy Storage Systems Inc.
- Stryten Energy
- H2 Inc.
- Sumitomo Electric Industries Ltd.
- VFlow Tech Pte Ltd.
- Elestor BV
- Enerox GmbH
- Largo Clean Energy
- Lockheed Martin Corp. (GridStar Flow)
- SCHMID Energy Systems
- StorEn Technologies Inc.
- VoltStorage GmbH
- Jenabatteries GmbH
- Zinc8 Energy Solutions
- Big Pawer Co.
- Shanghai Electric Energy Storage Tech
Additional Benefits:
- The market estimate (ME) sheet in Excel format
- 3 months of analyst support
TABLE OF CONTENTS
1 Introduction
- 1.1 Study Assumptions & Market Definition
- 1.2 Scope of the Study
2 Research Methodology
3 Executive Summary
4 Market Landscape
- 4.1 Market Overview
- 4.2 Market Drivers
- 4.2.1 Renewables-driven long-duration storage demand
- 4.2.2 Falling electrolyte leasing costs (new model)
- 4.2.3 Stack manufacturing & membrane advances
- 4.2.4 China's electrolyte capacity scale-up
- 4.2.5 Utility resilience & regulatory mandates
- 4.3 Market Restraints
- 4.3.1 High upfront CAPEX & vanadium price volatility
- 4.3.2 Low energy density vs. Li-ion
- 4.3.3 Lack of global standards / installer base
- 4.3.4 Permitting complexities for large electrolyte tanks
- 4.4 Supply-Chain Analysis
- 4.5 Regulatory Landscape
- 4.6 Technological Outlook
- 4.7 Porter's Five Forces
- 4.7.1 Bargaining Power of Suppliers
- 4.7.2 Bargaining Power of Buyers
- 4.7.3 Threat of New Entrants
- 4.7.4 Threat of Substitutes
- 4.7.5 Intensity of Rivalry
5 Market Size & Growth Forecasts
- 5.1 By Battery Type
- 5.1.1 Vanadium Redox Flow Battery
- 5.1.2 Zinc-Bromine Flow Battery
- 5.1.3 Iron Flow Battery
- 5.1.4 Zinc-Iron Flow Battery
- 5.1.5 All-Iron Flow Battery
- 5.2 By System Size
- 5.2.1 Large-Scale (Above 10 MWh)
- 5.2.2 Medium-Scale (1 to 10 MWh)
- 5.2.3 Small-Scale (Up to 1 MWh)
- 5.3 By Application
- 5.3.1 Renewable Energy Integration
- 5.3.2 Grid-Peaking/Load-Shifting
- 5.3.3 Microgrids and Off-Grid
- 5.4 By End-User
- 5.4.1 Utilities
- 5.4.2 Commercial and Industrial (C&I)
- 5.4.3 Residential
- 5.5 By Geography
- 5.5.1 North America
- 5.5.1.1 United States
- 5.5.1.2 Canada
- 5.5.2 Europe
- 5.5.2.1 Germany
- 5.5.2.2 United Kingdom
- 5.5.2.3 France
- 5.5.2.4 Italy
- 5.5.2.5 NORDIC Countries
- 5.5.2.6 Russia
- 5.5.2.7 Rest of Europe
- 5.5.3 Asia-Pacific
- 5.5.3.1 China
- 5.5.3.2 Japan
- 5.5.3.3 India
- 5.5.3.4 South Korea
- 5.5.3.5 ASEAN Countries
- 5.5.3.6 Australia and New Zealand
- 5.5.3.7 Rest of Asia-Pacific
- 5.5.4 South America
- 5.5.4.1 Brazil
- 5.5.4.2 Argentina
- 5.5.4.3 Rest of South America
- 5.5.5 Middle East and Africa
- 5.5.5.1 Saudi Arabia
- 5.5.5.2 United Arab Emirates
- 5.5.5.3 South Africa
- 5.5.5.4 Egypt
- 5.5.5.5 Rest of Middle East and Africa
- 5.5.1 North America
6 Competitive Landscape
- 6.1 Market Concentration
- 6.2 Strategic Moves (M&A, Partnerships, PPAs)
- 6.3 Market Share Analysis (Market Rank/Share for key companies)
- 6.4 Company Profiles (includes Global level Overview, Market level overview, Core Segments, Financials as available, Strategic Information, Products & Services, and Recent Developments)
- 6.4.1 VRB Energy
- 6.4.2 ESS Tech Inc.
- 6.4.3 Vanadis Power GmbH
- 6.4.4 Primus Power Corporation
- 6.4.5 Redflow Ltd.
- 6.4.6 Invinity Energy Systems PLC
- 6.4.7 Dalian Rongke Power Co. Ltd.
- 6.4.8 CellCube Energy Storage Systems Inc.
- 6.4.9 Stryten Energy
- 6.4.10 H2 Inc.
- 6.4.11 Sumitomo Electric Industries Ltd.
- 6.4.12 VFlow Tech Pte Ltd.
- 6.4.13 Elestor BV
- 6.4.14 Enerox GmbH
- 6.4.15 Largo Clean Energy
- 6.4.16 Lockheed Martin Corp. (GridStar Flow)
- 6.4.17 SCHMID Energy Systems
- 6.4.18 StorEn Technologies Inc.
- 6.4.19 VoltStorage GmbH
- 6.4.20 Jenabatteries GmbH
- 6.4.21 Zinc8 Energy Solutions
- 6.4.22 Big Pawer Co.
- 6.4.23 Shanghai Electric Energy Storage Tech
7 Market Opportunities & Future Outlook
- 7.1 White-Space & Unmet-Need Assessment

 液流電池市場-2026-2032年全球市場預測
 液流電池市場預測至2034年—按電池類型、額定功率、應用、最終用戶和地區分類的全球分析
 液流電池市場分析與預測(至2035年):按類型、產品、服務、技術、組件、應用、材料類型、部署方式、最終用戶和功能分類
 液流電池市場:按類型和地區分類
 液流電池市場規模、佔有率和趨勢分析報告:按類型、材料、儲存容量、應用、地區和細分市場分類(2026-2033 年)
 液流電池儲能市場規模、佔有率、成長及全球產業分析:按類型、應用和地區分類的洞察,2026-2034年預測
 2026年全球液流電池市場報告
 液流電池市場-全球產業規模、佔有率、趨勢、機會及預測(按類型、材料、儲存、應用、地區和競爭格局分類,2021-2031年)鐵液流電池市場-全球產業規模、佔有率、趨勢、機會、預測:按類型、應用、材料、地區和競爭格局分類,2021-2031年
 釩液流電池市場:依產品類型(大型、模組化、客製化)、應用領域(公用事業、商業及工業、電動車充電、國防)及地區劃分-全球預測至2036年