


 |
市場調查報告書
商品編碼
2122367
柴油發電機:市場佔有率分析、產業趨勢與統計、成長預測(2026-2031)Diesel Power Engine - Market Share Analysis, Industry Trends & Statistics, Growth Forecasts (2026 - 2031) |
||||||

※ 本網頁內容可能與最新版本有所差異。詳細情況請與我們聯繫。
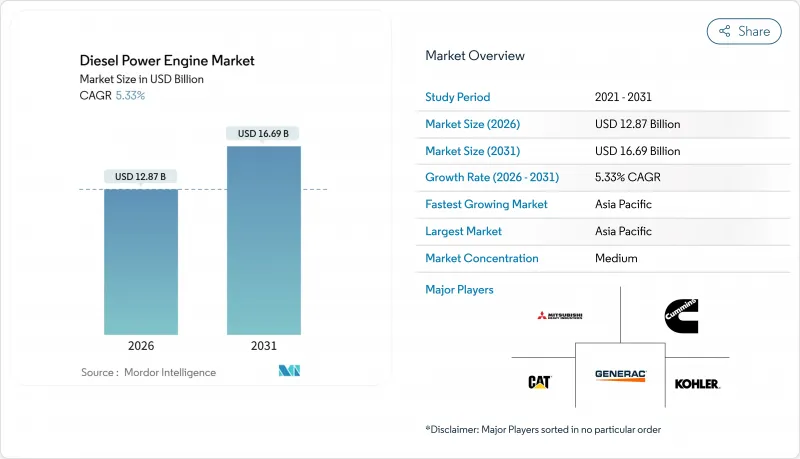
根據 Mordor Intelligence 估計,2026 年柴油發電機市值為 128.7 億美元,預計在預測期(2026-2031 年)內將以 5.33% 的複合年成長率成長,到 2031 年達到 166.9 億美元。
本報告按功率輸出範圍(75kVA及以下、75-375kVA、375-750kVA、750-2000kVA以及2000kVA以上)、應用領域(備用電源、主電源/連續運作、尖峰用電調節)、最終用戶(工業、商業、住宅)以及地區(北美、歐洲、亞太、以及中東地區和中東地區。市場規模和預測均以美元計價。
全球柴油發電機市場趨勢及洞察
投資加強新興市場的電網
在撒哈拉以南非洲和南亞,電力公司正在部署柴油和太陽能微電網作為臨時解決方案,直到長距離輸電線路和變電站能夠滿足電氣化目標。到2025年,世界銀行已撥款23億美元用於農村項目,這些項目將50-150千瓦的引擎與太陽能電池陣列相結合,使18個非洲國家的電力成本降至每千瓦時0.18-0.25美元。在印度的「Saubhagya」計畫中,雖然已完成家庭供電,但仍有40%的農村地區每天可靠供電時間不足12小時,這促使國有電力公司去年訂購了15,000台備用發電機。這些發電機通常每天運作6-10小時,導致磨損更快,更換週期更短。非洲開發銀行也證實了類似的經濟可行性,並指出在肯亞、坦尚尼亞和奈及利亞,即使沒有直接補貼,微電網也能以低於監管價格的價格運作。
亞洲資料中心建置快速成長
預計到2025年,亞太地區的超大規模資料中心營運商將新增1.2吉瓦的柴油間歇性發電容量,其中印度和中國將佔總部署量的68%。微軟和AWS已在海得拉巴園區投資65億美元,該園區需要N+1柴油冗餘系統以維持72小時的運作。同時,中國工業和資訊化部強制要求所有新建的三級資料中心在現場儲備三天的燃料。根據美國國家再生能源實驗室(NREL)最新的密度模型,電池系統在兆瓦級規模下的儲能效率要到2029年或更晚才能與柴油發電系統相提並論。
儲能電池的平準化度電成本快速下降
2024年,鋰離子電池組的價格降至每度電139美元,較2023年下降14%。這使得即使對於先前依賴柴油的商業建築而言,4小時的電池儲能也成為一個切實可行的選擇。加州的「私人發電獎勵計畫」(Incentive for Private Power Generation)在2025年撥款3.2億美元,用於支援醫院和資料中心安裝電池系統,作為短期停電的備用電源。根據拉札德(Lazard)2025年的分析,一套1兆瓦、4小時的電池系統,15年內的備用成本為每千瓦時0.18美元,而一台每年運作50小時的柴油發電機組的成本為每千瓦時0.22美元。然而,要為5兆瓦的負載實現72小時的自主供電,仍需要一套360兆瓦時的電池系統,成本約為5000萬美元,而柴油發電機組設備和燃料的成本僅為300萬美元。
細分市場分析
預計2026年至2031年間,375-750kVA柴油發電機市場將以7.5%的年均成長率成長,超過其他所有頻寬,這主要得益於醫院、電信樞紐和工廠等場所對更高可靠性規格的升級改造。 2025年,75kVA以下的機組仍佔據柴油發電機市場43.3%的佔有率,主要服務於住宅和小規模商業用戶,但隨著富裕消費者轉向太陽能電池解決方案,其增速已放緩至4.8%。 75-375kVA的中功率引擎正被應用於零售中心和食品加工廠,在這些場所,10秒內自動切換已成為標準的競標要求。在500-750kVA級別,Caterpillar的C18和羅爾斯·羅伊斯的MTU 12V 2000憑藉可變幾何渦輪增壓器和6%的燃油消耗降低,正在贏得醫療和電信行業的訂單。超過 2000 kVA 的機組仍然可用於超大規模園區,但營運商現在傾向於使用多個 1500-2000 kVA 的模組來實現冗餘,而不是使用單一 4 MW 的模組,這減慢了採購週期,但需求並沒有消失。
印度和印尼的電信業者正在用500-600kVA的發電機取代250kVA的發電機,以供應5G無線設備。 5G設備的耗電量比4G高出40%。普華永道發布的《2025年通訊能源審計報告》顯示,600kVA的設備由於效率更高,運作更短,因此可將每位用戶的碳排放強度降低12%。同樣,醫院管理者也正在指定使用600-750kVA的發電機組來應對擴建後的重症監護室和影像科室日益成長的負荷,這些訂單都包含8小時的負載測試,以確保獲得保險認證。預計75kVA以下的小型發電機在非洲和南亞的農村地區仍將受到歡迎,部分原因是小額信貸計畫允許將付款期限延長至五年。
區域分析
預計到2025年,亞太地區將佔總銷售額的38.1%,複合年成長率(CAGR)為6.6%。這主要得益於中國強制所有新建三級資料中心配備72小時備用電源,以及印度1.3兆美元的基礎設施發展計畫。在東協地區電力供應不穩定的情況下,電信塔建設蓬勃發展,洋馬計畫在2025年於印度和印尼的農村地區安裝2,500台發電機組。中東和非洲地區也保持著強勁的成長勢頭,複合年成長率達6.4%。沙烏地阿拉伯的NEOM新城已訂購了400兆瓦的備用電源,這些電源將配備Waltzila 31引擎;肯亞、坦尚尼亞和奈及利亞正在世界銀行的支持下擴大其微電網計畫。北美地區正呈現4.1%的成熟成長態勢,這主要得益於軍工合約和半導體產業回流,但電池獎勵和更嚴格的排放法規限制了其成長。歐洲 3.8% 的成長率也是由於類似的壓力造成的,特別是即將實施的“工業排放指令”,該指令可能會強制要求功率超過 1 兆瓦的引擎進行即時排放遙測。
在柴油發電機市場,亞太地區持續的投資項目和相對寬鬆的排放法規抵消了已開發國家面臨的不利因素。在中東,石油融資的大型企劃抵消了燃氣渦輪機部署擴張的影響;而在撒哈拉以南非洲,人們正依靠結合柴油和太陽能的混合微電網來彌合2035年之前的電氣化缺口。
其他好處
- Excel格式的市場預測(ME)表
- 3個月的分析師支持
目錄
第1章:引言
- 研究假設和市場定義
- 調查範圍
第2章:調查方法
第3章執行摘要
第4章 市場狀況
- 市場概覽
- 市場促進因素
- 投資加強新興市場的電網
- 亞洲資料中心建置快速成長
- 關鍵任務備份的工業自動化需求。
- 軍用行動電源現代化計劃
- 非洲農村微型公用事業(微電網)的發展
- 海事領域(輔助機構)為符合IMO III法規而進行的維修激增
- 市場限制因素
- 儲能電池的平準化度電成本快速下降
- 經合組織市場對氮氧化物和粒狀物排放標準更加嚴格。
- 小規模引進液化天然氣發電
- 一級半導體短缺對OEM供應鏈的影響
- 供應鏈分析
- 監理情勢
- 技術展望
- 波特五力模型
第5章 市場規模與成長預測
- 輸出範圍
- 75千伏安或以下
- 75~375kVA
- 375~750kVA
- 750~2,000kVA
- 2000千伏安或以上
- 透過使用
- 備用電源
- 主電源/連續運行
- 尖峰用電調節
- 最終用戶
- 工業的
- 商業的
- 住宅
- 按地區
- 北美洲
- 美國
- 加拿大
- 墨西哥
- 歐洲
- 英國
- 德國
- 法國
- 西班牙
- 北歐國家
- 俄羅斯
- 其他歐洲國家
- 亞太地區
- 中國
- 印度
- 日本
- 韓國
- ASEAN
- 澳洲和紐西蘭
- 其他亞太國家
- 南美洲
- 巴西
- 阿根廷
- 哥倫比亞
- 其他南美國家
- 中東和非洲
- 沙烏地阿拉伯
- 阿拉伯聯合大公國
- 南非
- 埃及
- 其他中東和非洲國家
- 北美洲
第6章 競爭情勢
- 市場集中度
- 策略趨勢(併購、聯盟、購電協議)
- 市場佔有率分析(主要公司的市場排名和佔有率)
- 公司簡介
- Caterpillar Inc.
- Cummins Inc.
- Generac Holdings Inc.
- Kohler Co.
- Mitsubishi Heavy Industries Ltd.
- Volvo Penta(AB Volvo)
- Wartsila Oyj Abp
- Rolls-Royce plc(mtu)
- MAN Energy Solutions SE
- Yanmar Holdings Co. Ltd.
- Hyundai Doosan Infracore
- Atlas Copco AB
- FG Wilson(Caterpillar)
- Perkins Engines Co. Ltd.
- Himoinsa SL
- Kirloskar Oil Engines Ltd.
- Guangxi Yuchai Machinery Group
- Mahindra Powerol
- Stamford-AvK(Cummins Generator Technologies)
- SDMO Industries(Kohler)
第7章 市場機會與未來展望
According to Mordor Intelligence, the diesel power engine market size is estimated at USD 12.87 billion in 2026, and is expected to reach USD 16.69 billion by 2031, at a CAGR of 5.33% during the forecast period (2026-2031).
This report is Segmented by Capacity Range (Up To 75 KVA, 75 To 375 KVA, 375 To 750 KVA, 750 To 2, 000 KVA, and Above 2, 000 KVA), Application (Stand-By, Prime/Continuous, and Peak-Shaving), End User (Industrial, Commercial, and Residential), and Geography (North America, Europe, Asia-Pacific, South America, and Middle East and Africa). The Market Sizes and Forecasts are Provided in Terms of Value (USD).
Global Diesel Power Engine Market Trends and Insights
Grid-Hardening Investments in Emerging Markets
Utilities in Sub-Saharan Africa and South Asia are adopting diesel-solar mini-grids as an interim solution while long-distance transmission lines and substations catch up with electrification targets. In 2025, the World Bank allocated USD 2.3 billion for rural projects pairing 50-150 kW engines with photovoltaic arrays, lowering delivered power costs to USD 0.18-0.25 per kWh in 18 African nations. India's Saubhagya program completed household connections yet still recorded sub-12-hour daily reliability in 40% of rural districts, prompting state utilities to order 15,000 standby gensets last year. These sets often run 6-10 hours per day, driving faster wear and replacement cycles. The African Development Bank confirms similar economics, noting that mini-grids can undercut regulated tariffs without direct subsidies in Kenya, Tanzania, and Nigeria.
Boom in Data-Center Construction Across Asia
Hyperscale operators installed 1.2 GW of new diesel standby capacity in Asia-Pacific during 2025, with India and China representing 68% of the total build-out. Microsoft and AWS committed USD 6.5 billion to campuses in Hyderabad requiring N+1 diesel redundancy for 72-hour operation, while China's Ministry of Industry and Information Technology obliges all new Tier-3 sites to store three days of fuel on-site. NREL's latest density models suggest battery systems will not match diesel's energy storage efficiency at the multi-megawatt scale until after 2029.
Rapid Fall in Battery-Storage LCOE
Lithium-ion battery pack prices fell to USD 139 per kWh in 2024, a 14% drop from 2023, making four-hour storage viable for commercial buildings previously reliant on diesel. California's Self-Generation Incentive Program distributed USD 320 million in 2025, allowing hospitals and data centers to substitute battery systems for short-duration outages. Lazard's 2025 analysis shows a 1 MW/4 h battery delivers backup at USD 0.18 per kWh over 15 years, versus USD 0.22 for a diesel set running 50 hours per year. Yet providing 72-hour autonomy for a 5 MW load still requires a 360 MWh battery system costing about USD 50 million, compared to USD 3 million for diesel hardware and fuel.
Other drivers and restraints analyzed in the detailed report include:
- Industrial Automation Demand for Mission-Critical Backup
- Military Mobile-Power Modernization Programs
- Tighter NOx & Particulate Limits in OECD Markets
For complete list of drivers and restraints, kindly check the Table Of Contents.
Segment Analysis
The diesel power engine market size for 375-750 kVA units is expanding at 7.5% per year during 2026-2031, outpacing every other band as hospitals, telecom hubs, and factories upgrade to higher reliability specifications. Sets up to 75 kVA retained 43.3% of the diesel power engine market share in 2025 by serving residential and small-commercial loads, yet growth moderates to 4.8% as affluent consumers migrate toward solar-battery solutions. Mid-range 75-375 kVA engines equip retail centers and food-processing sites where automatic transfer within 10 seconds is now a standard bid requirement. At 500-750 kVA, Caterpillar's C18 and Rolls-Royce's mtu 12V 2000 capture healthcare and telecom orders by coupling variable-geometry turbochargers with 6% lower fuel burn. Units above 2,000 kVA continue to serve hyperscale campuses, though operators now favor multiple 1,500-2,000 kVA modules for redundancy rather than single 4 MW blocks, tempering procurement cycles but not eliminating demand.
Telecom carriers in India and Indonesia are retiring 250 kVA gensets in favor of 500-600 kVA models to feed 5G radio units that consume 40% more power than 4G. PwC's 2025 telecom-energy audit found that 600 kVA machines cut carbon intensity 12% on a per-subscriber basis by reducing runtime through improved efficiency. Hospital administrators similarly specify 600-750 kVA arrays to cover expanded ICU and imaging loads, and these orders are bundled with eight-hour load-bank tests to secure insurance certification. Small sets under 75 kVA will still permeate rural Africa and South Asia, aided by micro-financing programs that spread payments over five years.
Complete Report Scope:
- By Capacity Range
- Up to 75 kVA
- 75 to 375 kVA
- 375 to 750 kVA
- 750 to 2,000 kVA
- Above 2,000 kVA
- By Application
- Stand-by
- Prime/Continuous
- Peak-shaving
- By End User
- Industrial
- Commercial
- Residential
- By Geography
- North America
- United States
- Canada
- Mexico
- Europe
- United Kingdom
- Germany
- France
- Spain
- NORDIC Countries
- Russia
- Rest of Europe
- Asia-Pacific
- China
- India
- Japan
- South Korea
- ASEAN Countries
- Australia and New Zealand
- Rest of Asia-Pacific
- South America
- Brazil
- Argentina
- Colombia
- Rest of South America
- Middle East and Africa
- Saudi Arabia
- United Arab Emirates
- South Africa
- Egypt
- Rest of Middle East and Africa
- North America
Geography Analysis
Asia-Pacific booked 38.1% of 2025 turnover and is set to deliver a 6.6% CAGR, backed by China's mandate for 72-hour reserves at all new Tier-3 data centers and India's USD 1.3 trillion infrastructure roadmap. ASEAN's telecom tower boom under unreliable grids spurred Yanmar to place 2,500 gensets in rural India and Indonesia during 2025. Middle-East-Africa clocks a robust 6.4% CAGR: Saudi Arabia's NEOM ordered 400 MW of standby power using Wartsila 31 engines, and Kenya, Tanzania, and Nigeria scale mini-grid programs with World Bank backing. North America posts a mature 4.1% trajectory, limited by battery incentives and stricter emissions but buoyed by military contracts and semiconductor reshoring. Europe's 3.8% clip reflects parallel pressures, especially with the pending Industrial Emissions Directive that may require live emissions telemetry on engines over 1 MW.
Across the diesel power engine market, Asia-Pacific's sustained investment pipeline and looser emissions rules offset headwinds in developed economies. The Middle East leverages petro-financed megaprojects to offset rising gas-turbine adoption, while Sub-Saharan Africa relies on hybrid diesel-solar mini-grids to bridge electrification gaps through 2035.
- Caterpillar Inc.
- Cummins Inc.
- Generac Holdings Inc.
- Kohler Co.
- Mitsubishi Heavy Industries Ltd.
- Volvo Penta (AB Volvo)
- Wartsila Oyj Abp
- Rolls-Royce plc (mtu)
- MAN Energy Solutions SE
- Yanmar Holdings Co. Ltd.
- Hyundai Doosan Infracore
- Atlas Copco AB
- FG Wilson (Caterpillar)
- Perkins Engines Co. Ltd.
- Himoinsa S.L.
- Kirloskar Oil Engines Ltd.
- Guangxi Yuchai Machinery Group
- Mahindra Powerol
- Stamford-AvK (Cummins Generator Technologies)
- SDMO Industries (Kohler)
Additional Benefits:
- The market estimate (ME) sheet in Excel format
- 3 months of analyst support
TABLE OF CONTENTS
1 Introduction
- 1.1 Study Assumptions & Market Definition
- 1.2 Scope of the Study
2 Research Methodology
3 Executive Summary
4 Market Landscape
- 4.1 Market Overview
- 4.2 Market Drivers
- 4.2.1 Grid-hardening investments in emerging markets
- 4.2.2 Boom in data-centre construction across Asia
- 4.2.3 Industrial automation demand for mission-critical backup
- 4.2.4 Military mobile power modernisation programmes
- 4.2.5 Micro-utility growth in rural Africa (mini-grids)
- 4.2.6 Maritime IMO III retrofit wave (aux. engines)
- 4.3 Market Restraints
- 4.3.1 Rapid fall in battery-storage LCOE
- 4.3.2 Tighter NOx & particulate limits in OECD markets
- 4.3.3 LNG-to-power small-scale deployments
- 4.3.4 OEM supply-chain exposure to Tier-1 chip shortages
- 4.4 Supply-Chain Analysis
- 4.5 Regulatory Landscape
- 4.6 Technological Outlook
- 4.7 Porter's Five Forces
- 4.7.1 Bargaining Power of Suppliers
- 4.7.2 Bargaining Power of Consumers
- 4.7.3 Threat of New Entrants
- 4.7.4 Threat of Substitute Products & Services
- 4.7.5 Intensity of Competitive Rivalry
5 Market Size & Growth Forecasts
- 5.1 By Capacity Range
- 5.1.1 Up to 75 kVA
- 5.1.2 75 to 375 kVA
- 5.1.3 375 to 750 kVA
- 5.1.4 750 to 2,000 kVA
- 5.1.5 Above 2,000 kVA
- 5.2 By Application
- 5.2.1 Stand-by
- 5.2.2 Prime/Continuous
- 5.2.3 Peak-shaving
- 5.3 By End User
- 5.3.1 Industrial
- 5.3.2 Commercial
- 5.3.3 Residential
- 5.4 By Geography
- 5.4.1 North America
- 5.4.1.1 United States
- 5.4.1.2 Canada
- 5.4.1.3 Mexico
- 5.4.2 Europe
- 5.4.2.1 United Kingdom
- 5.4.2.2 Germany
- 5.4.2.3 France
- 5.4.2.4 Spain
- 5.4.2.5 NORDIC Countries
- 5.4.2.6 Russia
- 5.4.2.7 Rest of Europe
- 5.4.3 Asia-Pacific
- 5.4.3.1 China
- 5.4.3.2 India
- 5.4.3.3 Japan
- 5.4.3.4 South Korea
- 5.4.3.5 ASEAN Countries
- 5.4.3.6 Australia and New Zealand
- 5.4.3.7 Rest of Asia-Pacific
- 5.4.4 South America
- 5.4.4.1 Brazil
- 5.4.4.2 Argentina
- 5.4.4.3 Colombia
- 5.4.4.4 Rest of South America
- 5.4.5 Middle East and Africa
- 5.4.5.1 Saudi Arabia
- 5.4.5.2 United Arab Emirates
- 5.4.5.3 South Africa
- 5.4.5.4 Egypt
- 5.4.5.5 Rest of Middle East and Africa
- 5.4.1 North America
6 Competitive Landscape
- 6.1 Market Concentration
- 6.2 Strategic Moves (M&A, Partnerships, PPAs)
- 6.3 Market Share Analysis (Market Rank/Share for key companies)
- 6.4 Company Profiles (includes Global level Overview, Market level overview, Core Segments, Financials as available, Strategic Information, Products & Services, and Recent Developments)
- 6.4.1 Caterpillar Inc.
- 6.4.2 Cummins Inc.
- 6.4.3 Generac Holdings Inc.
- 6.4.4 Kohler Co.
- 6.4.5 Mitsubishi Heavy Industries Ltd.
- 6.4.6 Volvo Penta (AB Volvo)
- 6.4.7 Wartsila Oyj Abp
- 6.4.8 Rolls-Royce plc (mtu)
- 6.4.9 MAN Energy Solutions SE
- 6.4.10 Yanmar Holdings Co. Ltd.
- 6.4.11 Hyundai Doosan Infracore
- 6.4.12 Atlas Copco AB
- 6.4.13 FG Wilson (Caterpillar)
- 6.4.14 Perkins Engines Co. Ltd.
- 6.4.15 Himoinsa S.L.
- 6.4.16 Kirloskar Oil Engines Ltd.
- 6.4.17 Guangxi Yuchai Machinery Group
- 6.4.18 Mahindra Powerol
- 6.4.19 Stamford-AvK (Cummins Generator Technologies)
- 6.4.20 SDMO Industries (Kohler)
7 Market Opportunities & Future Outlook
- 7.1 White-space & Unmet-need Assessment

 柴油引擎市場:全球預測,2026-2032年
 往復式發電引擎市場規模、佔有率和成長分析:按燃料類型、額定功率、應用、最終用戶和地區分類-2026-2033年產業預測
 往復式發電引擎主電源應用市場機會、成長要素、產業趨勢分析及預測(2026-2035 年)。
 全球柴油引擎市場分析及預測(至2032年)
 2026年全球主用往復式發電引擎市場報告2026年全球柴油引擎市場報告2026年全球往復式發電引擎市場報告
 柴油動力引擎市場-全球產業規模、佔有率、趨勢、機會與預測:按類型、估值、應用、產業垂直領域、地區和競爭格局分類,2021-2031年
 柴油引擎市場規模、佔有率和成長分析(按運轉類型、額定功率、轉速和地區分類)—產業預測(2026-2033 年)往復式發電引擎市場機會、成長促進因素、產業趨勢分析及預測(2026-2035年)