


 |
市場調查報告書
商品編碼
1892854
往復式發電引擎市場機會、成長促進因素、產業趨勢分析及預測(2026-2035年)Reciprocating Power Generating Engine Market Opportunity, Growth Drivers, Industry Trend Analysis, and Forecast 2026 - 2035 |
||||||
2025年全球往復式發電引擎市場價值為488億美元,預計2035年將以4%的複合年成長率成長至731億美元。
微電網計劃和農村工業電氣化項目的擴展推動了市場成長,也帶動了對可擴展、可靠電力解決方案的需求。往復式引擎因其啟動速度快、效率高和適應性強而備受青睞,使其適用於在城市中心和偏遠地區提供可靠的電力。這類引擎將活塞的直線運動轉化為旋轉機械能,並透過汽缸內可控的燃料燃燒產生電力。資料中心、採礦和油氣作業領域的投資不斷成長,以及新興經濟體日益提高的能源韌性需求,都在推動市場需求。這些引擎能夠使用多種燃料、管理可變負載並提供備用或調峰電力,進一步增強了其市場價值。技術進步和再生能源的併網正在擴大其作為間歇性發電靈活補充的作用。
| 市場範圍 | |
|---|---|
| 起始年份 | 2025 |
| 預測年份 | 2026-2035 |
| 起始值 | 488億美元 |
| 預測值 | 731億美元 |
| 複合年成長率 | 4% |
2025年,0.5兆瓦至1兆瓦引擎細分市場佔25%,預計到2035年將以3.5%的複合年成長率成長。受各行業對可靠備用電源解決方案需求不斷成長的推動,對緊湊、經濟高效且用途廣泛的工業動力裝置的需求正在上升。
預計到2025年,燃氣往復式引擎市場規模將達到112億美元,這反映出市場需求激增,主要原因是運行效率的提高、環保合規性的要求以及可再生能源的併網。這些引擎是支援可變和分散式能源發電的可靠解決方案。
預計到2025年,美國往復式發電引擎市場將佔據70%的市場佔有率,創造67億美元的市場規模。市場成長的促進因素包括:備用電源需求的不斷成長、電網基礎設施老化、分散式能源解決方案的普及、對清潔燃料的監管支持,以及工業和資料中心活動的日益活躍。
目錄
第1章:方法論與範圍
第2章:執行概要
第3章:行業洞察
- 產業生態系分析
- 原物料供應及採購分析
- 製造能力評估
- 供應鏈韌性與風險因素
- 配電網路分析
- 監管環境
- 產業影響因素
- 成長促進因素
- 產業陷阱與挑戰
- 成長潛力分析
- 波特的分析
- PESTEL 分析
- 往復式發電機的成本結構分析
- 價格趨勢分析(美元/兆瓦)
- 按地區
- 按額定功率
- 新興機會與趨勢
- 數位化和物聯網整合
- 新興市場滲透
- 顛覆性趨勢與未來展望
- 市場演變及歷史背景
- 技術基礎及性能特徵
- 引擎轉速類型和配置
- 效率曲線和運作參數
第4章:競爭格局
- 介紹
- 按地區分類的公司市佔率分析
- 北美洲
- 歐洲
- 亞太地區
- 中東和非洲
- 拉丁美洲
- 戰略儀錶板
- 策略舉措
- 重要夥伴關係與合作
- 主要併購活動
- 產品創新與發布
- 市場擴張策略
- 競爭性標竿分析
- 創新與永續發展格局
第5章:市場規模及預測:依燃料類型分類,2022-2035年
- 瓦斯式
- 0.5兆瓦 - 1兆瓦
- 1兆瓦 - 2兆瓦
- 2兆瓦 - 3.5兆瓦
- 3.5兆瓦 - 5兆瓦
- 5兆瓦 - 7.5兆瓦
- 大於 7.5 兆瓦
- 柴油燃燒
- 0.5兆瓦 - 1兆瓦
- 1兆瓦 - 2兆瓦
- 2兆瓦 - 3.5兆瓦
- 3.5兆瓦 - 5兆瓦
- 5兆瓦 - 7.5兆瓦
- 大於 7.5 兆瓦
- 雙燃料
- 0.5兆瓦 - 1兆瓦
- 1兆瓦 - 2兆瓦
- 2兆瓦 - 3.5兆瓦
- 3.5兆瓦 - 5兆瓦
- 5兆瓦 - 7.5兆瓦
- 大於 7.5 兆瓦
- 其他
- 0.5兆瓦 - 1兆瓦
- 1兆瓦 - 2兆瓦
- 2兆瓦 - 3.5兆瓦
- 3.5兆瓦 - 5兆瓦
- 5兆瓦 - 7.5兆瓦
- 大於 7.5 兆瓦
第6章:市場規模及預測:依額定功率分類,2022-2035年
- 0.5兆瓦 - 1兆瓦
- 1兆瓦 - 2兆瓦
- 2兆瓦 - 3.5兆瓦
- 3.5兆瓦 - 5兆瓦
- 5兆瓦 - 7.5兆瓦
- 大於 7.5 兆瓦
第7章:市場規模及預測:依應用領域分類,2022-2035年
- 工業的
- 加州公路巡邏隊
- 能源與公用事業
- 垃圾掩埋場和沼氣
- 石油和天然氣
- 其他
第8章:市場規模及預測:依最終用途分類,2022-2035年
- 備份
- 0.5兆瓦 - 1兆瓦
- 1兆瓦 - 2兆瓦
- 2兆瓦 - 3.5兆瓦
- 3.5兆瓦 - 5兆瓦
- 5兆瓦 - 7.5兆瓦
- 大於 7.5 兆瓦
- 主電源
- 0.5兆瓦 - 1兆瓦
- 1兆瓦 - 2兆瓦
- 2兆瓦 - 3.5兆瓦
- 3.5兆瓦 - 5兆瓦
- 5兆瓦 - 7.5兆瓦
- 大於 7.5 兆瓦
第9章:市場規模及預測:依地區分類,2022-2035年
- 北美洲
- 美國
- 加拿大
- 墨西哥
- 歐洲
- 英國
- 法國
- 德國
- 俄羅斯
- 義大利
- 西班牙
- 荷蘭
- 丹麥
- 挪威
- 亞太地區
- 中國
- 印度
- 日本
- 韓國
- 澳洲
- 泰國
- 新加坡
- 印尼
- 馬來西亞
- 菲律賓
- 中東和非洲
- 阿拉伯聯合大公國
- 沙烏地阿拉伯
- 卡達
- 阿曼
- 科威特
- 伊朗
- 埃及
- 土耳其
- 約旦
- 南非
- 拉丁美洲
- 巴西
- 阿根廷
- 智利
- 秘魯
第10章:公司簡介
- Ashok Leyland
- Briggs & Stratton
- Caterpillar
- Cummins
- Deere & Company
- Deutz AG
- Enerflex
- Escorts Kubota Limited
- GE Vernova
- Guascor Energy
- Kawasaki Heavy Industries
- Kirloskar
- MAN Energy Solutions
- Mitsubishi Heavy Industries
- Rehlko
- Rolls-Royce
- Scania
- TRITON DURO
- Wartsila
- Yanmar Holdings
- Honda Motor
- IHI Corporation
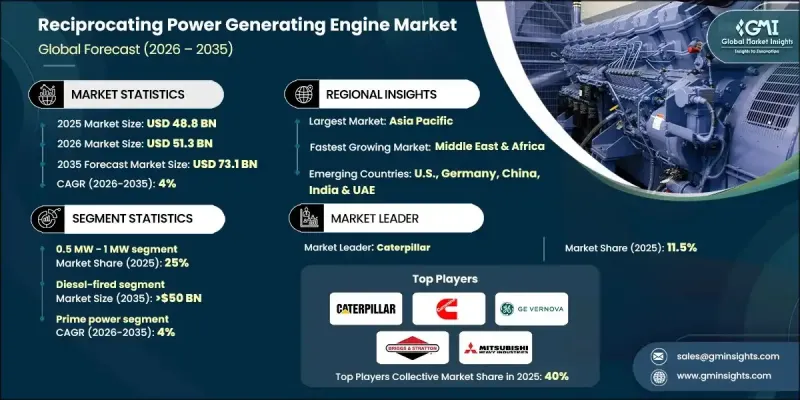
The Global Reciprocating Power Generating Engine Market was valued at USD 48.8 billion in 2025 and is estimated to grow at a CAGR of 4% to reach USD 73.1 billion by 2035.
The market growth is propelled by expanding microgrid initiatives and rural industrial electrification programs, which drive the need for scalable and reliable power solutions. Reciprocating engines are highly valued for their fast start-up, efficiency, and adaptability, making them suitable for delivering dependable electricity in both urban centers and remote locations. These engines convert the linear motion of pistons into rotational mechanical energy, producing electricity through controlled fuel combustion in cylinders. Growing investments in data centers, mining, and oil & gas operations, along with rising energy resilience requirements in emerging economies, are fueling demand. The ability of these engines to operate on diverse fuels, manage variable loads, and provide standby or peaking power further strengthens their market relevance. Technological advancements and the integration of renewable energy sources are expanding their role as flexible complements to intermittent power generation.
| Market Scope | |
|---|---|
| Start Year | 2025 |
| Forecast Year | 2026-2035 |
| Start Value | $48.8 Billion |
| Forecast Value | $73.1 Billion |
| CAGR | 4% |
The 0.5 MW - 1 MW engine segment accounted for a 25% share in 2025 and is expected to grow at a 3.5% CAGR through 2035. Demand for compact, cost-efficient, and versatile industrial power units is rising, driven by the growing need for reliable backup solutions across multiple sectors.
The gas-fired reciprocating engines segment reached USD 11.2 billion in 2025, reflecting a surge in demand due to improved operational efficiency, environmental compliance, and renewable energy integration. These engines serve as dependable solutions to support variable and distributed energy generation.
U.S. Reciprocating Power Generating Engine Market held a 70% share in 2025, generating USD 6.7 billion. Market growth is supported by the rising requirement for backup power, aging grid infrastructure, adoption of distributed energy solutions, regulatory support for cleaner fuels, and increasing industrial and data center activity.
Key companies operating in the Global Reciprocating Power Generating Engine Market include Wartsila, Mitsubishi Heavy Industries, IHI Corporation, Honda Motor, Cummins, Scania, Rolls-Royce, Caterpillar, Deutz AG, Kawasaki Heavy Industries, Deere & Company, Kirloskar, TRITON DURO, Ashok Leyland, Briggs & Stratton, Enerflex, GE Vernova, Escorts Kubota Limited, and Guascor Energy. Companies in the Reciprocating Power Generating Engine Market are strengthening their position by investing in R&D to enhance fuel efficiency, emissions compliance, and operational flexibility. Strategic partnerships with utilities, industrial firms, and microgrid operators enable wider adoption and service integration. Manufacturers are expanding global service networks and offering customized solutions to meet regional energy needs. Technological innovation, such as hybrid and gas-capable engines, supports compliance with environmental regulations and renewable integration.
Table of Contents
Chapter 1 Methodology & Scope
- 1.1 Research design
- 1.1.1 Research approach
- 1.1.2 Data collection methods
- 1.2 Base estimates and calculations
- 1.2.1 Base year calculation
- 1.2.2 Market estimates & forecast parameters
- 1.3 Forecast
- 1.3.1 Key trends for market estimates
- 1.3.2 Quantified market impact analysis
- 1.3.2.1 Mathematical impact of growth parameters on forecast
- 1.3.3 Scenario analysis framework
- 1.4 Primary research and validation
- 1.4.1 Some of the primary sources (but not limited to)
- 1.5 Data mining sources
- 1.5.1 Paid Sources
- 1.5.2 Sources, by region
- 1.6 Research trail & scoring components
- 1.6.1 Research trail components
- 1.6.2 Scoring components
- 1.7 Research transparency addendum
- 1.7.1 Source attribution framework
- 1.7.2 Quality assurance metrics
- 1.7.3 Our commitment to trust
- 1.8 Market definitions
Chapter 2 Executive Summary
- 2.1 Industry synopsis, 2022 - 2035
- 2.1.1 Business trends
- 2.1.2 Fuel type trends
- 2.1.3 Rated power trends
- 2.1.4 Application trends
- 2.1.5 End use trends
- 2.1.6 Regional trends
Chapter 3 Industry Insights
- 3.1 Industry ecosystem analysis
- 3.1.1 Raw material availability & sourcing analysis
- 3.1.2 Manufacturing capacity assessment
- 3.1.3 Supply chain resilience & risk factors
- 3.1.4 Distribution network analysis
- 3.2 Regulatory landscape
- 3.3 Industry impact forces
- 3.3.1 Growth drivers
- 3.3.2 Industry pitfalls & challenges
- 3.4 Growth potential analysis
- 3.5 Porter's analysis
- 3.5.1 Bargaining power of suppliers
- 3.5.2 Bargaining power of buyers
- 3.5.3 Threat of new entrants
- 3.5.4 Threat of substitutes
- 3.6 PESTEL analysis
- 3.6.1 Political factors
- 3.6.2 Economic factors
- 3.6.3 Social factors
- 3.6.4 Technological factors
- 3.6.5 Legal factors
- 3.6.6 Environmental factors
- 3.7 Cost structure analysis of reciprocating power generating engines
- 3.8 Price trend analysis (USD/MW)
- 3.8.1 By region
- 3.8.2 By rated power
- 3.9 Emerging opportunities & trends
- 3.9.1 Digitalization and IoT integration
- 3.9.2 Emerging market penetration
- 3.10 Disruptive trends & future outlook
- 3.11 Market evolution & historical context
- 3.12 Technology fundamentals & performance characteristics
- 3.12.1 Engine speed types & configurations
- 3.12.2 Efficiency curves & operational parameters
Chapter 4 Competitive Landscape, 2025
- 4.1 Introduction
- 4.2 Company market share analysis, by region, 2025
- 4.2.1 North America
- 4.2.2 Europe
- 4.2.3 Asia Pacific
- 4.2.4 Middle East & Africa
- 4.2.5 Latin America
- 4.3 Strategic dashboard
- 4.4 Strategic initiatives
- 4.4.1 Key partnerships & collaborations
- 4.4.2 Major M&A activities
- 4.4.3 Product innovations & launches
- 4.4.4 Market expansion strategies
- 4.5 Competitive benchmarking
- 4.6 Innovation & sustainability landscape
Chapter 5 Market Size and Forecast, By Fuel Type, 2022 - 2035 (USD Million, MW & Units)
- 5.1 Key trends
- 5.2 Gas-fired
- 5.2.1 0.5 MW - 1 MW
- 5.2.2 > 1 MW - 2 MW
- 5.2.3 > 2 MW - 3.5 MW
- 5.2.4 > 3.5 MW - 5 MW
- 5.2.5 > 5 MW - 7.5 MW
- 5.2.6 > 7.5 MW
- 5.3 Diesel-fired
- 5.3.1 0.5 MW - 1 MW
- 5.3.2 > 1 MW - 2 MW
- 5.3.3 > 2 MW - 3.5 MW
- 5.3.4 > 3.5 MW - 5 MW
- 5.3.5 > 5 MW - 7.5 MW
- 5.3.6 > 7.5 MW
- 5.4 Dual fuel
- 5.4.1 0.5 MW - 1 MW
- 5.4.2 > 1 MW - 2 MW
- 5.4.3 > 2 MW - 3.5 MW
- 5.4.4 > 3.5 MW - 5 MW
- 5.4.5 > 5 MW - 7.5 MW
- 5.4.6 > 7.5 MW
- 5.5 Others
- 5.5.1 0.5 MW - 1 MW
- 5.5.2 > 1 MW - 2 MW
- 5.5.3 > 2 MW - 3.5 MW
- 5.5.4 > 3.5 MW - 5 MW
- 5.5.5 > 5 MW - 7.5 MW
- 5.5.6 > 7.5 MW
Chapter 6 Market Size and Forecast, By Rated Power, 2022 - 2035 (USD Million, MW & Units)
- 6.1 Key trends
- 6.2 0.5 MW - 1 MW
- 6.3 > 1 MW - 2 MW
- 6.4 > 2 MW - 3.5 MW
- 6.5 > 3.5 MW - 5 MW
- 6.6 > 5 MW - 7.5 MW
- 6.7 > 7.5 MW
Chapter 7 Market Size and Forecast, By Application, 2022 - 2035 (USD Million, MW & Units)
- 7.1 Key trends
- 7.2 Industrial
- 7.3 CHP
- 7.4 Energy & utility
- 7.5 Landfill & biogas
- 7.6 Oil & gas
- 7.7 Others
Chapter 8 Market Size and Forecast, By End Use, 2022 - 2035 (USD Million, MW & Units)
- 8.1 Key trends
- 8.2 Backup
- 8.2.1 0.5 MW - 1 MW
- 8.2.2 > 1 MW - 2 MW
- 8.2.3 > 2 MW - 3.5 MW
- 8.2.4 > 3.5 MW - 5 MW
- 8.2.5 > 5 MW - 7.5 MW
- 8.2.6 > 7.5 MW
- 8.3 Prime power
- 8.3.1 0.5 MW - 1 MW
- 8.3.2 > 1 MW - 2 MW
- 8.3.3 > 2 MW - 3.5 MW
- 8.3.4 > 3.5 MW - 5 MW
- 8.3.5 > 5 MW - 7.5 MW
- 8.3.6 > 7.5 MW
Chapter 9 Market Size and Forecast, By Region, 2022 - 2035 (USD Million, MW & Units)
- 9.1 Key trends
- 9.2 North America
- 9.2.1 U.S.
- 9.2.2 Canada
- 9.2.3 Mexico
- 9.3 Europe
- 9.3.1 UK
- 9.3.2 France
- 9.3.3 Germany
- 9.3.4 Russia
- 9.3.5 Italy
- 9.3.6 Spain
- 9.3.7 Netherlands
- 9.3.8 Denmark
- 9.3.9 Norway
- 9.4 Asia Pacific
- 9.4.1 China
- 9.4.2 India
- 9.4.3 Japan
- 9.4.4 South Korea
- 9.4.5 Australia
- 9.4.6 Thailand
- 9.4.7 Singapore
- 9.4.8 Indonesia
- 9.4.9 Malaysia
- 9.4.10 Philippines
- 9.5 Middle East & Africa
- 9.5.1 UAE
- 9.5.2 Saudi Arabia
- 9.5.3 Qatar
- 9.5.4 Oman
- 9.5.5 Kuwait
- 9.5.6 Iran
- 9.5.7 Egypt
- 9.5.8 Turkey
- 9.5.9 Jordan
- 9.5.10 South Africa
- 9.6 Latin America
- 9.6.1 Brazil
- 9.6.2 Argentina
- 9.6.3 Chile
- 9.6.4 Peru
Chapter 10 Company Profiles
- 10.1 Ashok Leyland
- 10.2 Briggs & Stratton
- 10.3 Caterpillar
- 10.4 Cummins
- 10.5 Deere & Company
- 10.6 Deutz AG
- 10.7 Enerflex
- 10.8 Escorts Kubota Limited
- 10.9 GE Vernova
- 10.10 Guascor Energy
- 10.11 Kawasaki Heavy Industries
- 10.12 Kirloskar
- 10.13 MAN Energy Solutions
- 10.14 Mitsubishi Heavy Industries
- 10.15 Rehlko
- 10.16 Rolls-Royce
- 10.17 Scania
- 10.18 TRITON DURO
- 10.19 Wartsila
- 10.20 Yanmar Holdings
- 10.21 Honda Motor
- 10.22 IHI Corporation
 柴油引擎市場:按功率、技術、冷卻方式、汽缸數和應用分類-2026-2032年全球市場預測
 全球柴油引擎市場分析及預測(至2032年)
 2026年全球主用往復式發電引擎市場報告2026年全球柴油引擎市場報告2026年全球往復式發電引擎市場報告
 柴油動力引擎市場-全球產業規模、佔有率、趨勢、機會與預測:按類型、估值、應用、產業垂直領域、地區和競爭格局分類,2021-2031年
 柴油引擎市場規模、佔有率和成長分析(按運轉類型、額定功率、轉速和地區分類)—產業預測(2026-2033 年)
 柴油引擎:全球市場佔有率和排名、總銷售量和需求預測(2025-2031年)
 備用往復式發電引擎市場機會、成長動力、產業趨勢分析及 2025 - 2034 年預測
 柴油引擎:市場佔有率分析、行業趨勢和統計、成長預測(2025-2030 年)