


 |
市場調查報告書
商品編碼
2122359
石墨:市場佔有率分析、產業趨勢和統計數據、成長預測(2026-2031)Graphite - Market Share Analysis, Industry Trends & Statistics, Growth Forecasts (2026 - 2031) |
||||||

※ 本網頁內容可能與最新版本有所差異。詳細情況請與我們聯繫。
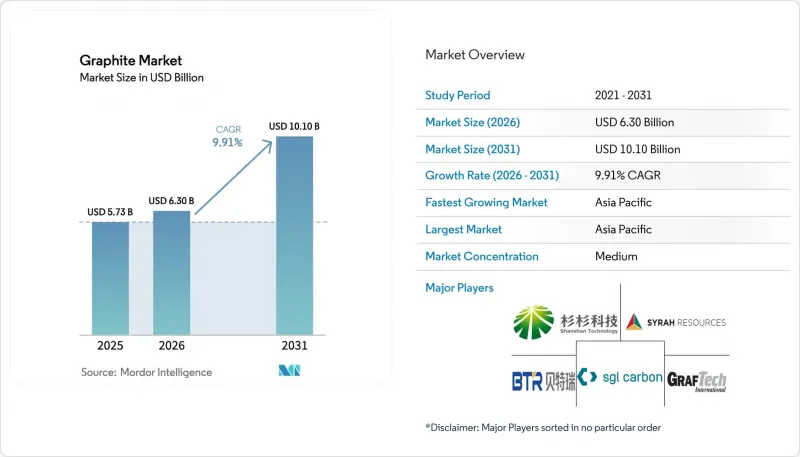
根據 Mordor Intelligence 預測,石墨市場規模將在 2025 年達到 57.3 億美元,2026 年達到 63 億美元,2031 年達到 101 億美元,2026 年至 2031 年的複合年成長率為 9.91%。
本報告按類型(天然石墨、合成石墨)、應用(電極、耐火材料、鑄件、鑄造廠、電池、潤滑劑及其他)、終端用戶產業(冶金、電子、汽車及其他)和地區(亞太、北美、歐洲、南美、中東和非洲)進行細分。市場預測以價值(美元)和數量(噸)兩種單位呈現。
全球石墨市場趨勢及洞察
鋰離子電池超級工廠建設激增
隨著新超級工廠每年新增約150吉瓦時(GWh)的電池產能,電池石墨的需求預計將從2024年的90萬噸增加到2030年的270萬噸,增加近三倍。為確保與寧德時代(CATL)和比亞迪(BYD)的契約,BTR新材料公司已於2025年將其負極材料產能提高12萬噸/年。在1.5億歐元股本的支持下,Vianode公司在挪威運作了一座年產1萬噸的合成石墨工廠,目標客戶是尋求中國替代產品的歐洲買家。在美國,Syrah Resources公司的Vidalia工廠在獲得美國能源部2.2億美元的貸款擔保後,預計到2025年中期產能將達到11250噸/年。磷酸鋰鐵(LFP)基化學成分可將負極填充效率提高15%,進而抵消高階電池中矽替代帶來的風險。
利用電弧爐(EAF)擴大鋼鐵產能
隨著脫碳措施加速高爐煉鋼製程的轉型,電弧爐(EAF)用石墨電極的需求預計將從2024年的85萬噸增加到2030年的每年110萬噸。為了滿足印度基礎建設主導的鋼鐵需求,HEG有限公司在2025會計年度將運轉率提高至72%。印度石墨公司新增了一條年產能2萬噸的超高高功率電極生產線,服務東南亞和中東的客戶。德國薩爾茨吉特股份公司計劃在2029年前完成電弧爐煉鋼,將使電極需求每年增加8,000噸。雖然高功率電極的價格溢價高達30%,但它們可以降低15%的爐能耗,從而提高鋼鐵廠的盈利。
合成石墨的原料針狀焦供不應求。
Philips 66於2024年停止生產石油基針狀焦,導致年產能減少18萬噸,全球供應收緊15%。 Graftec難以購買低硫焦,導致2025年第一季電極出貨量下降22%。 2025年上半年,現貨市場價格飆升18%,而日本和中國的主要企業則簽訂了煤焦油瀝青的多年期契約,並支付了每噸500美元的溢價。目前全球僅有12家煉油廠生產適用於超高高功率電極的針狀焦,自2022年以來,沒有一家公司宣布擴產。由於混合材料的使用會使電極壽命縮短10%,因此針狀焦在高功率熔爐中的應用受到限制。
細分市場分析
截至2025年,合成石墨憑藉其在電池負極材料和高功率電極領域的優異純度,維持了59.09%的市場佔有率。同時,天然石墨預計到2031年將以12.29%的複合年成長率成長,這主要得益於其在耐火材料、潤滑劑和膨脹石墨產品領域較低的成本。 2025年,天然石墨精礦的平均價格為每噸800至1200美元,而用於電池應用的天然石墨價格則高達每噸4500至6500美元,這一價格差異吸引了注重成本的買家。因此,即使合成石墨的絕對銷售量超過天然石墨,天然石墨應用領域的市場規模預計仍將以更快的速度成長。
生產基地分佈極化。中國、日本和韓國仍佔合成石墨產能的78%,但預計到2025年,北美和歐洲的產能將每年增加6萬噸,進而提高供應穩定性。天然石墨具有地理多樣性優勢,分佈於莫三比克、坦尚尼亞、馬達加斯加和巴西等國,這些國家的總合蘊藏量1億噸。合成石墨生產商由於石墨化過程能耗高,面臨碳價格風險,而天然石墨的加工能耗僅為合成石墨的五分之一,並且擴大受益於可再生能源選礦廠。
區域分析
亞太地區預計在2025年佔全球石墨銷售額的55.72%,並預計到2031年將以11.34%的複合年成長率成長。在中國,新增的年產120萬噸合成石墨產能已於2024-2025年運作,用於供應南德時代(CATL)和比亞迪(BYD)。日本和韓國佔半導體級石墨產量的65%,每年向台積電(TSMC)、三星(Samsung)和英特爾(Intel)的晶圓廠出口1.2萬噸超高純度石墨。為滿足印度國內日益成長的電弧爐(EAF)煉鋼需求,印度電極製造商在2025會計年度將運轉率提高至72%。因此,亞太地區石墨市場規模的持續成長得益於涵蓋礦場、陽極廠和下游超級工廠的一體化供應鏈。
預計北美市場佔有率將擴大,這得益於2025年一項旨在實現陽極材料國內自給自足的12億美元投資計畫。 Sira公司位於維達利亞的工廠預計到2025年年產量將達到11250噸,目標是到2028年達到4萬噸。 Novonix公司已獲得美國能源局1.5億美元的津貼,用於在田納西州建造一座年產3萬噸的合成石墨生產設施,該設施計劃於2027年運作。加拿大比塞特溪礦於2024年恢復運營,每年供應2.5萬噸精礦。此外,特斯拉計劃在墨西哥蒙特雷建設的超級工廠預計到 2027 年每年需要 8,000 噸陽極材料。隨著菲利普斯 66 公司於 2024 年撤出,當地的原料供應已經中斷,針狀焦的短缺仍然是該地區最大的限制。
在歐洲,預計石墨產業將迎來成長,其中挪威的Vianode工廠將引領這一成長。該公司於2025年3月獲得1.5億歐元融資,並計劃在2030年將年產能從1萬噸擴大到5萬噸。瑞典的Targa集團已從歐洲投資銀行獲得1.5億歐元貸款,並計劃在2027年將其Vitangi天然石墨專案年產能擴大至1.95萬噸。該計畫旨在利用水力發電,將二氧化碳排放量降至每公斤1.2公斤。德國的SGL Carbon和法國的Mersen公司已聯合起來,將其用於半導體和航太的高性能石墨年產能提高了5000噸。隨著歐盟碳邊境調節機制將於2026年起逐步實施,市場需求正轉向低排放石墨和電弧爐(EAF)鋼。北歐供應商利用廉價的可再生能源和接近性歐洲超級工廠的優勢,在石墨市場上開闢了一個環保的市場。
其他好處
- Excel格式的市場預測(ME)表
- 3個月的分析師支持
目錄
第1章:引言
第2章:調查方法
第3章執行摘要
第4章 市場狀況
- 市場概覽
- 市場促進因素
- 鋰離子電池超級工廠建設激增
- 利用電弧爐(EAF)擴大鋼鐵產能
- 半導體產業對超高純度合成石墨的需求不斷成長
- 中國的出口許可證制度加速了對中國以外供應鏈的投資。
- 生物基「綠色」合成石墨製造製程的出現。
- 市場限制因素
- 合成石墨的原料針狀焦供不應求。
- 煉油生產線中高頻(HF)輻射的嚴格監管
- 由於電池負極中採用矽取代石墨,每千瓦時石墨用量減少。
- 價值鏈分析
- 波特五力模型
第5章 市場規模與成長預測
- 按類型
- 天然石墨
- 合成石墨
- 透過使用
- 電極
- 耐火材料、鑄件及鑄造廠
- 電池
- 潤滑劑
- 其他應用(溫度控管材料、摩擦產品/煞車襯等)
- 按最終用戶行業分類
- 冶金
- 電子學
- 車
- 其他產業(能源、航太和國防等)
- 按地區
- 亞太地區
- 中國
- 印度
- 日本
- 韓國
- ASEAN
- 其他亞太國家
- 北美洲
- 美國
- 加拿大
- 墨西哥
- 歐洲
- 德國
- 英國
- 法國
- 義大利
- 西班牙
- 北歐國家
- 其他歐洲國家
- 南美洲
- 巴西
- 阿根廷
- 其他南美國家
- 中東和非洲
- 沙烏地阿拉伯
- 阿拉伯聯合大公國
- 埃及
- 南非
- 其他中東和非洲國家
- 亞太地區
第6章 競爭情勢
- 市場集中度
- 策略趨勢
- 市佔率和排名分析
- 公司簡介
- Graphit Kropfmuhl GmbH
- Asbury Carbons
- BTR New Material Group Co., Ltd.
- Fangda Carbon New Material Co., Ltd.
- GrafTech International Ltd.
- Graphit Kropfmuhl GmbH
- Graphite India Limited
- HEG Limited
- Imery
- Mason Resources Inc.
- Mersen
- Nippon Kokuen Group
- Northern Graphite
- POCO
- Resonac Holdings Corporation
- SGL Carbon
- Shanghai Shanshan Technology Co., Ltd.
- Syrah Resources Limited
- Tokai Carbon Co., Ltd.
- Triton Minerals Limited
第7章 市場機會與未來展望
According to Mordor Intelligence, the graphite market size is projected to be USD 5.73 billion in 2025, USD 6.30 billion in 2026, and reach USD 10.10 billion by 2031, growing at a CAGR of 9.91% from 2026 to 2031.
This report is Segmented by Type (Natural Graphite and Synthetic Graphite), Application (Electrodes, Refractories/Casting/Foundries, Batteries, Lubricants, and Other Applications), End-User Industry (Metallurgy, Electronics, Automotive, and Others), and Geography (Asia-Pacific, North America, Europe, South America, and Middle East and Africa). Market Forecasts are Provided in Terms of Value (USD) and Volume (Tons).
Global Graphite Market Trends and Insights
Soaring Li-Ion Battery Gigafactory Build-Outs
Battery-grade graphite demand is set to triple from 900,000 t in 2024 to 2.7 million t by 2030 as new gigafactories add roughly 150 GWh of cell capacity each year. BTR New Material added 120,000 t pa of anode output in 2025 to secure contracts with CATL and BYD. Vianode commissioned a 10,000 t pa synthetic-graphite plant in Norway, backed by EUR 150 million equity, targeting European buyers seeking non-Chinese supply. In the United States, Syrah Resources' Vidalia facility reached 11,250 t pa by mid-2025 after winning a USD 220 million Department of Energy loan guarantee. LFP chemistries raise anode loading by 15%, offsetting silicon substitution risk in high-end cells.
Expansion of Electric-Arc-Furnace Steel Capacity
EAF steel will require 1.1 million t of graphite electrodes annually by 2030, up from 850,000 t in 2024, as decarbonization policies spur blast-furnace conversions. HEG Limited lifted capacity utilization to 72% in FY2025 to meet India's infrastructure-led steel demand. Graphite India added a 20,000 t pa ultra-high-power electrode line aimed at Southeast Asia and Middle East customers. Germany's Salzgitter AG plans an EAF conversion that will add 8,000 t pa of electrode demand by 2029. Ultra-high-power electrodes carry a 30% price premium yet cut furnace energy use by 15%, improving steel-mill economics.
Needle-Coke Feedstock Bottlenecks for Synthetic Graphite
Phillips 66 exited petroleum needle-coke production in 2024, erasing 180,000 t pa of capacity and tightening global supply by 15%. GrafTech's Q1 2025 electrode shipments fell 22% as it struggled to source low-sulfur coke. Spot buyers saw an 18% price jump in H1 2025, while Japanese and Chinese majors secured multi-year coal-tar-pitch deals at a USD 500/t premium. Only a dozen refineries worldwide produce needle coke suitable for ultra-high-power electrodes, and none announced expansions after 2022. Blended feedstocks reduce electrode life by 10%, limiting their uptake in premium furnaces.
Other drivers and restraints analyzed in the detailed report include:
- Rising Demand for Ultra-High-Purity Synthetic Graphite in Semiconductors
- China's Export-Licence Regime Accelerating Ex-China Supply Investments
- Battery-Anode Silicon Substitution Eroding Graphite Intensity per kWh
For complete list of drivers and restraints, kindly check the Table Of Contents.
Segment Analysis
Synthetic graphite retained 59.09% of the market share in 2025, thanks to its purity advantage in battery anodes and ultra-high-power electrodes. Natural grades, however, are forecast to expand at a 12.29% CAGR to 2031, lifted by lower costs in refractories, lubricants, and expandable-graphite products. Natural concentrate averaged USD 800-1,200/t in 2025 versus USD 4,500-6,500/t for battery-grade synthetic, a spread that encourages cost-conscious buyers. The graphite market size for natural graphite applications is therefore set to widen faster than synthetic, even if the latter keeps higher absolute revenues.
Production footprints are diverging. China, Japan, and South Korea still host 78% of synthetic capacity, yet North America and Europe added 60,000 t pa in 2025, improving supply security. Natural graphite draws strength from geographic diversity across Mozambique, Tanzania, Madagascar, and Brazil, whose combined reserves exceed 100 million t. Energy-intensive graphitization subjects synthetic producers to carbon-pricing risk, whereas natural processing consumes one-fifth of the electricity per tonne and increasingly benefits from renewable-powered beneficiation plants.
Complete Report Scope:
- By Type
- Natural Graphite
- Synthetic Graphite
- By Application
- Electrodes
- Refractories, Casting and Foundries
- Batteries
- Lubricants
- Other Applications (Thermal Management Materials, Friction Products and Brake Linings,etc.)
- By End-user Industry
- Metallurgy
- Electronics
- Automotive
- Other Industries (Energy, Aerospace and Defence, etc.)
- By Geography
- Asia-Pacific
- China
- India
- Japan
- South Korea
- ASEAN Countries
- Rest of Asia-Pacific
- North America
- United States
- Canada
- Mexico
- Europe
- Germany
- United Kingdom
- France
- Italy
- Spain
- NORDIC Countries
- Rest of Europe
- South America
- Brazil
- Argentina
- Rest of South America
- Middle-East and Africa
- Saudi Arabia
- United Srab Emirates
- Egypt
- South Africa
- Rest of Middle-East and Africa
- Asia-Pacific
Geography Analysis
Asia-Pacific controlled 55.72% of 2025 revenue and is forecast to grow at an 11.34% CAGR through 2031. China commissioned 1.2 million t pa of new synthetic capacity between 2024 and 2025 to serve CATL and BYD. Japan and South Korea account for 65% of semiconductor-grade output, exporting 12,000 t pa of ultra-high-purity material to TSMC, Samsung, and Intel fabs. India's electrode producers raised utilization to 72% in FY2025 to meet domestic EAF steel growth. The graphite market size in Asia-Pacific, therefore, remains anchored by integrated supply chains spanning mines, anode plants, and downstream gigafactories.
North America's market share is projected to expand, propelled by USD 1.2 billion of 2025 investments aimed at domestic anode independence. Syrah's Vidalia plant hit 11,250 t pa in 2025 and targets 40,000 t pa by 2028. NOVONIX secured a USD 150 million Department of Energy grant to build a 30,000 t pa synthetic facility in Tennessee that will come online in 2027. Canada's Bissett Creek mine restarted in 2024 to supply 25,000 t pa of concentrate, and Tesla's upcoming Monterrey gigafactory in Mexico will need 8,000 t pa of anode material by 2027. Needle-coke scarcity remains the region's largest constraint since Phillips 66's 2024 exit removed a local feedstock source.
Europe will register growth, led by Norway's Vianode plant, which raised EUR 150 million in March 2025 to scale from 10,000 t pa to 50,000 t pa by 2030. Sweden's Talga Group secured a EUR 150 million European Investment Bank loan to expand its Vittangi natural-graphite project to 19,500 t pa by 2027, achieving a 1.2 kg CO2/kg footprint using hydropower. Germany's SGL Carbon and France's Mersen added a combined 5,000 t pa of specialty-graphite capacity for semiconductors and aerospace. The EU's Carbon Border Adjustment Mechanism, phased in from 2026, tilts demand toward low-emission graphite and EAF steel. Nordic suppliers leverage cheap renewables and proximity to European gigafactories to carve a green niche in the graphite market.
- Graphit Kropfmuhl GmbH
- Asbury Carbons
- BTR New Material Group Co., Ltd.
- Fangda Carbon New Material Co., Ltd.
- GrafTech International Ltd.
- Graphit Kropfmuhl GmbH
- Graphite India Limited
- HEG Limited
- Imery
- Mason Resources Inc.
- Mersen
- Nippon Kokuen Group
- Northern Graphite
- POCO
- Resonac Holdings Corporation
- SGL Carbon
- Shanghai Shanshan Technology Co., Ltd.
- Syrah Resources Limited
- Tokai Carbon Co., Ltd.
- Triton Minerals Limited
Additional Benefits:
- The market estimate (ME) sheet in Excel format
- 3 months of analyst support
TABLE OF CONTENTS
1 Introduction
2 Research Methodology
3 Executive Summary
4 Market Landscape
- 4.1 Market Overview
- 4.2 Market Drivers
- 4.2.1 Soaring Li-ion battery gigafactory build-outs
- 4.2.2 Expansion of electric-arc-furnace (EAF) steel capacity
- 4.2.3 Rising demand for ultra-high-purity synthetic graphite in the semiconductor industry
- 4.2.4 China's export-licence regime accelerating ex-China supply investments
- 4.2.5 Emergence of bio-based "green" synthetic graphite routes
- 4.3 Market Restraints
- 4.3.1 Needle-coke feedstock bottlenecks for synthetic graphite
- 4.3.2 Stringent HF-emission regulations on purification lines
- 4.3.3 Battery-anode silicon substitution eroding graphite intensity per kWh
- 4.4 Value Chain Analysis
- 4.5 Porter's Five Forces
- 4.5.1 Bargaining Power of Suppliers
- 4.5.2 Bargaining Power of Buyers
- 4.5.3 Threat of New Entrants
- 4.5.4 Threat of Substitute Products & Services
- 4.5.5 Degree of Competition
5 Market Size & Growth Forecasts (Value and Volume)
- 5.1 By Type
- 5.1.1 Natural Graphite
- 5.1.2 Synthetic Graphite
- 5.2 By Application
- 5.2.1 Electrodes
- 5.2.2 Refractories, Casting and Foundries
- 5.2.3 Batteries
- 5.2.4 Lubricants
- 5.2.5 Other Applications (Thermal Management Materials, Friction Products and Brake Linings,etc.)
- 5.3 By End-user Industry
- 5.3.1 Metallurgy
- 5.3.2 Electronics
- 5.3.3 Automotive
- 5.3.4 Other Industries (Energy, Aerospace and Defence, etc.)
- 5.4 By Geography
- 5.4.1 Asia-Pacific
- 5.4.1.1 China
- 5.4.1.2 India
- 5.4.1.3 Japan
- 5.4.1.4 South Korea
- 5.4.1.5 ASEAN Countries
- 5.4.1.6 Rest of Asia-Pacific
- 5.4.2 North America
- 5.4.2.1 United States
- 5.4.2.2 Canada
- 5.4.2.3 Mexico
- 5.4.3 Europe
- 5.4.3.1 Germany
- 5.4.3.2 United Kingdom
- 5.4.3.3 France
- 5.4.3.4 Italy
- 5.4.3.5 Spain
- 5.4.3.6 NORDIC Countries
- 5.4.3.7 Rest of Europe
- 5.4.4 South America
- 5.4.4.1 Brazil
- 5.4.4.2 Argentina
- 5.4.4.3 Rest of South America
- 5.4.5 Middle-East and Africa
- 5.4.5.1 Saudi Arabia
- 5.4.5.2 United Srab Emirates
- 5.4.5.3 Egypt
- 5.4.5.4 South Africa
- 5.4.5.5 Rest of Middle-East and Africa
- 5.4.1 Asia-Pacific
6 Competitive Landscape
- 6.1 Market Concentration
- 6.2 Strategic Moves
- 6.3 Market Share(%)/Ranking Analysis
- 6.4 Company Profiles (includes Global level Overview, Market level overview, Core Segments, Financials as available, Strategic Information, Market Rank/Share for key companies, Products & Services, and Recent Developments)
- 6.4.1 Graphit Kropfmuhl GmbH
- 6.4.2 Asbury Carbons
- 6.4.3 BTR New Material Group Co., Ltd.
- 6.4.4 Fangda Carbon New Material Co., Ltd.
- 6.4.5 GrafTech International Ltd.
- 6.4.6 Graphit Kropfmuhl GmbH
- 6.4.7 Graphite India Limited
- 6.4.8 HEG Limited
- 6.4.9 Imery
- 6.4.10 Mason Resources Inc.
- 6.4.11 Mersen
- 6.4.12 Nippon Kokuen Group
- 6.4.13 Northern Graphite
- 6.4.14 POCO
- 6.4.15 Resonac Holdings Corporation
- 6.4.16 SGL Carbon
- 6.4.17 Shanghai Shanshan Technology Co., Ltd.
- 6.4.18 Syrah Resources Limited
- 6.4.19 Tokai Carbon Co., Ltd.
- 6.4.20 Triton Minerals Limited
7 Market Opportunities & Future Outlook
- 7.1 White-space & Unmet-Need Assessment
- 7.2 Supply-Chain Diversification & Recycling Initiatives

 石墨回收市場規模、佔有率和成長分析:按來源、回收製程、最終產品、最終用途產業、供應管道和地區分類-2026-2033年產業預測
 特種石墨:市場佔有率分析、產業趨勢與統計、成長預測(2026-2031)
 鋪路磚市場規模、佔有率和成長分析:按材料、產品類型、應用、表面處理、最終用戶和地區分類-2026-2033年產業預測
 等向性石墨市場規模、佔有率和成長分析:按等級、製造流程、應用、終端用戶產業和地區分類-2026-2033年產業預測
 石墨市場:依類型、純度、形態、應用和終端用戶產業分類-2026-2032年全球市場預測
 石墨:科技與全球市場
 等靜壓石墨市場規模、佔有率和成長分析:按等級、應用、終端用戶產業、通路和地區分類-2026-2033年產業預測
 等向性及擠壓石墨市場規模、佔有率及成長分析:依產品類型、純度、應用、終端用戶產業、密度等級、通路及地區分類-2026-2033年產業預測
 水性膠體石墨市場:按應用和地區分類石墨坩堝市場:依材質、應用、終端用戶產業、產能、銷售管道、價格範圍、產品壽命、客製化程度、熱源和地區分類