


 |
市場調查報告書
商品編碼
2122227
身臨其境型虛擬實境:市場佔有率分析、產業趨勢與統計、成長預測(2026-2031)Immersive Virtual Reality - Market Share Analysis, Industry Trends & Statistics, Growth Forecasts (2026 - 2031) |
||||||

※ 本網頁內容可能與最新版本有所差異。詳細情況請與我們聯繫。
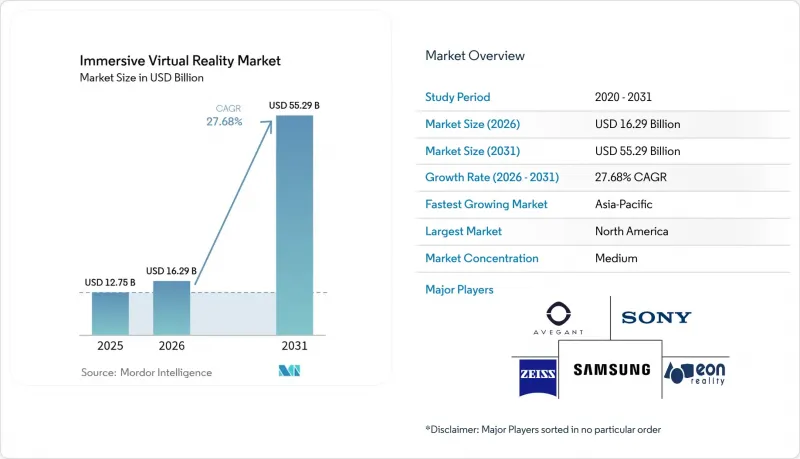
根據 Mordor Intelligence 預測,身臨其境型虛擬實境 (VR) 市場將從 2025 年的 127.5 億美元成長到 2026 年的 162.9 億美元,然後在 2031 年達到 552.9 億美元,2026 年至 2031 年的複合成長率為 27.68%。
本報告按設備(頭戴式顯示器 [HMD]、手勢追蹤設備、觸覺回饋設備、VR 攝影機)、終端用戶產業(娛樂和遊戲、航太和國防、醫療保健、教育和培訓等)、組件(硬體、軟體、服務)、沉浸類型(完全身臨其境型、半身臨其境型、非身臨其境型)和地區進行分類。
全球身臨其境型虛擬實境市場趨勢與洞察
VR在航太和國防領域的應用
國防機構正在將身臨其境型模擬器融入核心課程。美國空軍部署了225台虛擬擴增實境(VR)設備,作為其飛行員訓練轉型舉措的一部分,而Mass Virtual公司則獲得了價值6700萬美元的相關合約。洛克希德馬丁公司和Red 6公司為TF-50教練機整合了擴增實境(AR)疊加層,Vrgineers公司則參與了與捷克共和國的一項協議,旨在擴展F-35戰鬥機的模擬能力。隨著美國聯邦航空管理局(FAA)與Vertex Solutions和Varjo公司合作更新民用飛行模擬器的標準,監管協調工作也不斷推進。這些進展正在縮短技能習得週期,降低實際飛行中的燃油成本,並支持身臨其境型虛擬實境市場的持續成長。歐洲和亞洲正在進行的採購進一步增強了中期前景。
透過遊戲頭戴式顯示器在消費者中普及
預計到2024年,全球VR頭戴裝置貨量將增加至960萬台,其中Meta佔據73%的市場佔有率,而蘋果的Vision Pro儘管售價高達3499美元,仍成功佔據了5%的高階細分市場。獨立式頭戴裝置的複合年成長率(CAGR)高達33.20%,主要得益於消費者對無線使用的偏好。然而,即便像Quest 3S這樣定價模式發布,也未能完全彌補假期季節的銷售下滑,這表明內容的豐富程度與價格同樣重要。由於中國對進口硬體徵收105%的關稅以及區域性GPU短缺,零售價格面臨上漲風險,但大規模、地方政府投資的VR體驗項目仍在持續吸引新用戶,從而支撐短期銷售成長。隨著5G部署的加速和雲端渲染技術的進一步降低效能門檻,身臨其境型虛擬實境市場的發展勢頭有望持續。
多感官鑽機的整體擁有成本高
蘋果 Vision Pro 的組件成本為 1542 美元,其中 microOLED 顯示器就佔了 35% 的成本,凸顯了先進光學技術如何推高零售價格。颶風海倫破壞了北卡羅來納州的石英礦,這些礦藏佔全球高純度石英供應量的 90%,而高純度石英是半導體光刻技術的關鍵材料,這導致組件價格上漲。對中國製造的頭戴式設備徵收超過 100% 的關稅,加上台積電因地震導致營運中斷而造成的 GPU供不應求,都推高了消費者和企業的採購成本。美國半導體製造工廠的營運成本比亞洲同業高出 35%,阻礙了美國國內的價格控制。儘管各公司透過簽署批量預購協議來確保供應,但短期價格上漲正在減緩價格敏感地區的普及速度,從而抑制了身臨其境型虛擬實境市場的成長勢頭。
細分市場分析
到2025年,頭戴式顯示器(HMD)將主導身臨其境型虛擬實境市場,佔據85.40%的銷售佔有率。預計獨立式設備將成長最快,到2031年複合年成長率將達到32.20%,因為越來越多的消費者傾向於使用無線控制以加快初始設定。 Meta的Quest系列保持著73%的出貨量佔有率,但售價299美元的Quest 3S未能抓住假期季節的需求,這表明內容而非價格才是阻礙因素。隨著無線串流媒體降低延遲,有線設備的受歡迎程度正在下降,而隨著專用硬體價格更加親民且性能更佳,智慧型手機用戶也在減少。
手勢追蹤配件和觸覺手套在需要精準手部動作的企業培訓計畫中日益受到關注。 Meta、SONY和微軟等公司申請的觸覺回饋專利正在提升用戶的沉浸感,但由於成本高且清潔要求複雜,全身式虛擬實境服仍屬於小眾產品。 VR攝影機正被銷售給中國的線下娛樂營運商,中國計劃在2024年開設超過100家此類場所,這將豐富本地內容的錄製。儘管石英礦關閉導致的零件短缺可能會推高所有設備類別的零件成本,但預計從2026年起,顯示螢幕良率和電池密度的提升將緩解成本上漲,從而推動身臨其境型虛擬實境設備在市場上的普及。
2025年,娛樂和遊戲產業在身臨其境型虛擬實境市場中佔據45.55%的佔有率,這主要得益於熱門遊戲和電競賽事帶動了消費者支出。同時,醫療保健產業成長最為迅速,預計到2031年將實現28.65%的複合年成長率,這主要得益於FDA和CE的批准,為醫保報銷鋪平了道路。隨著「RelieVRx」和「DeepWell DTx」的獲批,治療性內容在疼痛管理和心理健康領域的應用正在加速普及,該領域正從實驗階段邁向處方箋階段。
在國防和航太領域,大規模模擬器的部署仍在繼續,美國空軍已建成225個訓練單元便是最好的證明。同時,教育機構也作為先驅者進入這一領域,沃爾瑪、波音和美國銀行等公司報告稱,其生產力實現了兩位數的成長。漢莎航空和CAE等汽車相關企業正在使用混合實境(MR)進行機組人員培訓和駕駛座熟練度訓練,而建築公司則利用全像來及早發現設計缺陷。零售業的應用仍處於探索階段,受到內容成本和頭戴式設備衛生問題的限制。英國石油公司(BP)等大型製造和能源公司正在部署安全培訓模組,這表明醫療領域已證實的有效性正在擴展到相鄰領域。這進一步加速了身臨其境型虛擬實境市場的成長動能。
區域分析
得益於巨額國防費用和企業早期採用,北美在2025年繼續引領身臨其境型虛擬實境市場,佔37.60%的銷售佔有率。美國企業受益於大規模的醫療報銷管道,但不斷上漲的半導體製造成本推高了硬體價格,使其高於亞洲競爭對手。該地區正在試點遠端渲染解決方案,利用雲端基礎設施和5G部署來抵消設備成本的障礙。沃爾瑪、波音和美國銀行等公司的企業培訓計畫提供了國內概念驗證案例,鼓勵供應商將重點放在北美客戶身上。
亞太地區以31.85%的複合年成長率(CAGR)領先全球,這主要得益於中國系統化的元宇宙政策框架以及2024年投入運作的100多個大型VR部署項目。工業和資訊化部成立了標準化委員會,以統一設備協議;國家電影局也大力推動VR影院的發展。 IDC預測,到2029年,該地區AR/VR相關支出將超過105億美元,佔全球整體支出的26.5%。日本和韓國正透過政府對教育和智慧製造試點計畫的津貼而加速發展,而印度低成本的開發者群體則正在加速在地化內容的創作。接近性零件供應鏈有助於減少運輸延誤,但自然災害的風險,例如台積電因地震和颱風導致的石英供應中斷,仍然是營運中需要關注的問題。
歐洲佔據戰略中間位置,這得益於歐盟委員會的虛擬世界藍圖以及德國由60家公司組成的「XR-Interaction」網路(該網路已獲得多年國家資助)。虛擬與擴增擴增實境產業聯盟預測,到2025年,歐洲將新增86萬個就業崗位,展現了歐洲與美國和中國生態系統競爭的政治意願。倫敦政經學院(LSE)正在倡導打造“元元宇宙版空中巴士”,以匯聚產業專長;與此同時,寶馬、宜家和博世等公司正在試驗可互通的數位孿生技術。儘管外匯波動和更嚴格的隱私法規可能會減緩消費者接受新技術的速度,但跨國在標準和倫理方面的合作將增強區域長期競爭力,並鞏固歐洲在身臨其境型虛擬實境市場中的貢獻。
其他好處:
- Excel格式的市場預測(ME)表
- 3個月的分析師支持
目錄
第1章:引言
- 研究假設和市場定義
- 調查範圍
第2章:調查方法
第3章執行摘要
第4章 市場狀況
- 市場促進因素
- VR技術在航太和國防訓練的應用。
- 透過遊戲頭戴式顯示器實現消費者普及
- 政府資助的虛擬實境醫療療法試點項目
- 用於遠端協作的企業級元宇宙平台
- 人工智慧驅動的虛擬實境教育自適應學習
- 用於 VR 串流媒體的雲端渲染降低了硬體准入門檻。
- 市場限制因素
- 多感測器鑽機的總擁有成本很高。
- 內容匱乏與生態系片段化
- 由於網路延遲導致暈動症,會話時長受到限制。
- 生物識別和眼動追蹤的隱私問題。
- 價值供應鏈分析
- 監理情勢
- 技術展望
- 波特五力分析
- 投資分析
第5章 市場規模與成長預測
- 透過裝置
- 頭戴式顯示器(HMD)
- 獨立式頭戴式顯示器
- 有線頭戴式顯示器
- 基於智慧型手機的頭戴式顯示器
- 手勢追蹤設備
- 觸覺手套
- 動作控制器
- 全身防護服
- 觸覺回饋裝置
- VR相機
- 頭戴式顯示器(HMD)
- 按最終用戶行業分類
- 娛樂和遊戲
- 航太/國防
- 衛生保健
- 外科手術程序和醫療培訓
- 復健治療
- 心理健康和疼痛管理
- 教育和培訓
- 汽車和運輸業
- 建築、工程和施工 (AEC)
- 零售與電子商務
- 其他行業
- 按組件
- 硬體
- 軟體
- 服務
- 按類型沉浸
- 完全身臨其境型
- 半沉浸式
- 非身臨其境型
- 按地區
- 北美洲
- 美國
- 加拿大
- 墨西哥
- 南美洲
- 巴西
- 阿根廷
- 其他南美國家
- 歐洲
- 英國
- 德國
- 法國
- 義大利
- 西班牙
- 其他歐洲國家
- 亞太地區
- 中國
- 日本
- 韓國
- 印度
- 其他亞太國家
- 中東
- 阿拉伯聯合大公國
- 沙烏地阿拉伯
- 土耳其
- 其他中東國家
- 非洲
- 南非
- 奈及利亞
- 肯亞
- 其他非洲國家
- 北美洲
第6章 競爭情勢
- 策略趨勢
- 市佔率分析
- 公司簡介
- Meta Platforms Inc.(Oculus)
- Sony Corporation
- HTC Corporation
- Apple Inc.
- Samsung Electronics Co., Ltd.
- Microsoft Corporation
- Pico Interactive(ByteDance Ltd.)
- Valve Corporation
- Varjo Technologies Oy
- HP Inc.
- Carl Zeiss AG
- Avegant Corporation
- Varjo Technologies
- Vrgineers
- Magic Leap, Inc.
- Google LLC
- Eon Reality, Inc.
- CyberGlove Systems LLC
- Ultraleap Ltd.(Leap Motion)
- Sixense Enterprises Inc.
- Vuzix Corporation
- Lenovo Group Ltd.
- Ultraleap Ltd.
第7章 市場機會與未來展望
According to Mordor Intelligence, the immersive virtual reality market size is expected to grow from USD 12.75 billion in 2025 to USD 16.29 billion in 2026 and is forecast to reach USD 55.29 billion by 2031 at 27.68% CAGR over 2026-2031.
This report is Segmented by Device (Head-Mounted Displays [HMDs], Gesture Tracking Devices, Haptic Feedback Devices, and VR Cameras), End-User Industry (Entertainment and Gaming, Aerospace and Defense, Healthcare, Education and Training, and More), Component (Hardware, Software, and Services), Immersion Type (Fully-Immersive, Semi-Immersive, and Non-Immersive), and Geography.
Global Immersive Virtual Reality Market Trends and Insights
Use of VR in Aerospace and Defence Training
Defense agencies are embedding immersive simulators into core curricula. The U.S. Air Force deployed 225 VR devices under its Pilot Training Transformation initiative, while Mass Virtual secured USD 67 million in related contracts. Lockheed Martin and Red 6 integrated augmented overlays for the TF-50 trainer, and Vrgineers joined a Czech agreement to extend F-35 simulation capability. Regulatory alignment is advancing as the Federal Aviation Administration collaborates with Vertex Solutions and Varjo to update standards for civilian flight simulators. These moves shorten skill-acquisition cycles, reduce live-flight fuel spending, and underpin sustained growth for the immersive virtual reality market. Continued procurement pipelines in Europe and Asia reinforce the medium-term outlook.
Consumer Adoption via Gaming HMDs
Global VR headset shipments rose to 9.6 million units in 2024, with Meta holding 73% share and Apple's Vision Pro securing a 5% premium niche despite a USD 3,499 price tag. Stand-alone HMDs are expanding at 33.20% CAGR as buyers favor cable-free use, yet lower-priced launches such as the Quest 3S did not fully offset holiday-season softness, suggesting that content breadth is as vital as price. China's 105% tariffs on overseas hardware and regional GPU shortages risk lifting retail prices, but large-scale location-based VR experiences funded by local authorities continue to attract first-time users, supporting near-term unit growth. Accelerated 5G roll-out and cloud rendering will further lower performance barriers, sustaining momentum for the immersive virtual reality market.
High Total Cost of Ownership of Multi-Sensory Rigs
Apple Vision Pro's bill of materials stands at USD 1,542, with micro-OLED displays alone forming 35% of the cost, underscoring how sophisticated optics inflate retail pricing. Hurricane Helene damaged North Carolina quartz mines that supply up to 90% of global high-purity quartz, vital for semiconductor photolithography, pushing component prices higher. Tariffs exceeding 100% on China-built headsets, plus GPU shortages after TSMC earthquake disruptions, elevate consumer and enterprise acquisition expenses. U.S. fabs operate at operating costs 35% above Asian peers, curbing domestic price relief. Enterprises respond with bulk pre-purchase contracts to lock in supply, yet near-term sticker shock trims adoption in price-sensitive regions and tempers the immersive virtual reality market trajectory.
Other drivers and restraints analyzed in the detailed report include:
- Government-Funded VR Healthcare Therapy Pilots
- Enterprise Metaverse Platforms for Remote Collaboration
- Content Scarcity and Ecosystem Fragmentation
For complete list of drivers and restraints, kindly check the Table Of Contents.
Segment Analysis
The immersive virtual reality market size for head-mounted displays stood dominant in 2025 as the form factor secured 85.40% revenue share. Stand-alone variants are poised for the fastest climb, advancing at a projected 32.20% CAGR to 2031 as buyers gravitate toward wire-free operation that speeds initial set-up. Meta's Quest line continues to hold 73% share of shipments, yet the USD 299 Quest 3S failed to ignite holiday demand, underscoring content rather than price as the limiting factor. Tethered rigs are losing favor as wireless streaming narrows latency, while smartphone-shell viewers retreat because dedicated hardware is more affordable and performant.
Gesture-tracking accessories and haptic gloves are gaining traction within enterprise training programs that need precise hand articulation. Patent filings from Meta, Sony, and Microsoft around tactile feedback elevate user immersion, though full-body suits remain niche given higher cost and cleaning complexity. VR cameras are selling into China's location-based entertainment operators that launched over 100 venues in 2024, enriching local content capture. Component shortages tied to quartz mine disruptions can raise the bill of materials across all device classes yet advances in display yield and battery density are expected to moderate cost escalation after 2026, supporting broader device penetration into the immersive virtual reality market.
Entertainment and gaming retained a 45.55% share of the immersive virtual reality market size during 2025 as blockbuster titles and esports events anchored consumer spend. Healthcare, however, is tracking the steepest ascent, estimated to deliver a 28.65% CAGR through 2031 on the back of FDA and CE approvals that open reimbursement lanes. RelieVRx and DeepWell DTx clearances usher therapeutic content into pain management and mental health, shifting the segment from experimental to prescription territory.
Defense and aerospace continue to procure large simulator fleets, evidenced by 225 USAF training units already fielded, while education providers join the vanguard as Walmart, Boeing, and Bank of America quantify double-digit productivity lifts. Automotive firms like Lufthansa and CAE apply mixed reality to crew guidance and cockpit familiarization, and architecture studios leverage holographic walkthroughs to identify design flaws early. Retail engagement remains exploratory, held back by content costs and headset hygiene concerns. Manufacturing and energy majors such as BP roll out safety modules, demonstrating how healthcare's validation effect is permeating adjacent sectors, which amplifies growth momentum for the immersive virtual reality market.
Complete Report Scope:
- By Device
- Head-Mounted Displays (HMDs)
- Stand-alone HMDs
- Tethered HMDs
- Smartphone-based HMDs
- Gesture Tracking Devices
- Haptic Gloves
- Motion Controllers
- Full-Body Suits
- Haptic Feedback Devices
- VR Cameras
- Head-Mounted Displays (HMDs)
- By End-user Industry
- Entertainment and Gaming
- Aerospace and Defence
- Healthcare
- Surgery and Medical Training
- Rehabilitation Therapy
- Mental Health and Pain Management
- Education and Training
- Automotive and Transportation
- Architecture, Engineering and Construction (AEC)
- Retail and E-commerce
- Other Industries
- By Component
- Hardware
- Software
- Services
- By Immersion Type
- Fully-Immersive
- Semi-Immersive
- Non-Immersive
- By Geography
- North America
- United States
- Canada
- Mexico
- South America
- Brazil
- Argentina
- Rest of South America
- Europe
- United Kingdom
- Germany
- France
- Italy
- Spain
- Rest of Europe
- Asia-Pacific
- China
- Japan
- South Korea
- India
- Rest of Asia-Pacific
- Middle East
- United Arab Emirates
- Saudi Arabia
- Turkey
- Rest of Middle East
- Africa
- South Africa
- Nigeria
- Kenya
- Rest of Africa
- North America
Geography Analysis
North America continued to lead the immersive virtual reality market with 37.60% revenue share in 2025, buoyed by substantial defense spending and early enterprise adoption. U.S. companies benefit from large pilot training budgets and healthcare reimbursement pipelines, although higher semiconductor fabrication costs raise hardware prices relative to Asian competitors. The region is leveraging cloud infrastructure and 5G roll-out to pilot remote rendering solutions that could offset device cost barriers. Corporate training programs at Walmart, Boeing, and Bank of America supply domestic proof points, reinforcing vendor focus on North American clients.
Asia Pacific registered the highest regional CAGR at 31.85%, propelled by China's structured metaverse policy framework and more than 100 large-scale VR installations commissioned in 2024. The Ministry of Industry and Information Technology formed a standards committee that aligns device protocols, while the National Film Administration encouraged VR cinema roll-outs. IDC projects regional AR/VR spending to surpass USD 10.5 billion by 2029, equal to 26.5% of global outlays. Japan and South Korea add momentum through government grants for education and smart-manufacturing pilots, and India's cost-efficient developer pool accelerates localized content creation. Proximity to component supply chains helps mitigate freight delays, though natural disaster risks such as TSMC's earthquake and typhoon-driven quartz disruptions remain operational concerns.
Europe holds a strategic middle position, supported by the European Commission's virtual worlds roadmap and Germany's XR-Interaction network of 60 firms receiving multi-year state funding. The Virtual and Augmented Reality Industrial Coalition forecasts 860,000 new European jobs by 2025, signaling political will to compete with U.S. and Chinese ecosystems. The London School of Economics champions an "Airbus for the metaverse" to pool industrial expertise, while companies such as BMW, IKEA, and Bosch experiment with interoperable digital twins. Currency fluctuations and stricter privacy rules can slow consumer uptake, yet cross-border collaboration on standards and ethics enhances long-term regional competitiveness, sustaining European contribution to the immersive virtual reality market.
- Meta Platforms Inc. (Oculus)
- Sony Corporation
- HTC Corporation
- Apple Inc.
- Samsung Electronics Co., Ltd.
- Microsoft Corporation
- Pico Interactive (ByteDance Ltd.)
- Valve Corporation
- Varjo Technologies Oy
- HP Inc.
- Carl Zeiss AG
- Avegant Corporation
- Varjo Technologies
- Vrgineers
- Magic Leap, Inc.
- Google LLC
- Eon Reality, Inc.
- CyberGlove Systems LLC
- Ultraleap Ltd. (Leap Motion)
- Sixense Enterprises Inc.
- Vuzix Corporation
- Lenovo Group Ltd.
- Ultraleap Ltd.
Additional Benefits:
- The market estimate (ME) sheet in Excel format
- 3 months of analyst support
TABLE OF CONTENTS
1 INTRODUCTION
- 1.1 Study Assumptions and Market Definition
- 1.2 Scope of the Study
2 RESEARCH METHODOLOGY
3 EXECUTIVE SUMMARY
4 MARKET LANDSCAPE
- 4.1 Market Drivers
- 4.1.1 Use of VR in aerospace and defence training
- 4.1.2 Consumer adoption via gaming HMDs
- 4.1.3 Government-funded VR healthcare therapy pilots
- 4.1.4 Enterprise metaverse platforms for remote collaboration
- 4.1.5 AI-powered adaptive learning in VR education
- 4.1.6 Cloud-rendered VR streaming lowers hardware barrier
- 4.2 Market Restraints
- 4.2.1 High total cost of ownership of multi-sensory rigs
- 4.2.2 Content scarcity and ecosystem fragmentation
- 4.2.3 Latency-driven motion-sickness limits session length
- 4.2.4 Privacy concerns over biometric and gaze analytics
- 4.3 Value/Supply-Chain Analysis
- 4.4 Regulatory Landscape
- 4.5 Technological Outlook
- 4.6 Porter's Five Forces Analysis
- 4.6.1 Threat of New Entrants
- 4.6.2 Bargaining Power of Buyers/Consumers
- 4.6.3 Bargaining Power of Suppliers
- 4.6.4 Threat of Substitute Products
- 4.6.5 Intensity of Competitive Rivalry
- 4.7 Investment Analysis
5 MARKET SIZE AND GROWTH FORECASTS (VALUE)
- 5.1 By Device
- 5.1.1 Head-Mounted Displays (HMDs)
- 5.1.1.1 Stand-alone HMDs
- 5.1.1.2 Tethered HMDs
- 5.1.1.3 Smartphone-based HMDs
- 5.1.2 Gesture Tracking Devices
- 5.1.2.1 Haptic Gloves
- 5.1.2.2 Motion Controllers
- 5.1.2.3 Full-Body Suits
- 5.1.3 Haptic Feedback Devices
- 5.1.4 VR Cameras
- 5.1.1 Head-Mounted Displays (HMDs)
- 5.2 By End-user Industry
- 5.2.1 Entertainment and Gaming
- 5.2.2 Aerospace and Defence
- 5.2.3 Healthcare
- 5.2.3.1 Surgery and Medical Training
- 5.2.3.2 Rehabilitation Therapy
- 5.2.3.3 Mental Health and Pain Management
- 5.2.4 Education and Training
- 5.2.5 Automotive and Transportation
- 5.2.6 Architecture, Engineering and Construction (AEC)
- 5.2.7 Retail and E-commerce
- 5.2.8 Other Industries
- 5.3 By Component
- 5.3.1 Hardware
- 5.3.2 Software
- 5.3.3 Services
- 5.4 By Immersion Type
- 5.4.1 Fully-Immersive
- 5.4.2 Semi-Immersive
- 5.4.3 Non-Immersive
- 5.5 By Geography
- 5.5.1 North America
- 5.5.1.1 United States
- 5.5.1.2 Canada
- 5.5.1.3 Mexico
- 5.5.2 South America
- 5.5.2.1 Brazil
- 5.5.2.2 Argentina
- 5.5.2.3 Rest of South America
- 5.5.3 Europe
- 5.5.3.1 United Kingdom
- 5.5.3.2 Germany
- 5.5.3.3 France
- 5.5.3.4 Italy
- 5.5.3.5 Spain
- 5.5.3.6 Rest of Europe
- 5.5.4 Asia-Pacific
- 5.5.4.1 China
- 5.5.4.2 Japan
- 5.5.4.3 South Korea
- 5.5.4.4 India
- 5.5.4.5 Rest of Asia-Pacific
- 5.5.5 Middle East
- 5.5.5.1 United Arab Emirates
- 5.5.5.2 Saudi Arabia
- 5.5.5.3 Turkey
- 5.5.5.4 Rest of Middle East
- 5.5.6 Africa
- 5.5.6.1 South Africa
- 5.5.6.2 Nigeria
- 5.5.6.3 Kenya
- 5.5.6.4 Rest of Africa
- 5.5.1 North America
6 COMPETITIVE LANDSCAPE
- 6.1 Strategic Moves
- 6.2 Market Share Analysis
- 6.3 Company Profiles (includes Global level Overview, Market level overview, Core Segments, Financials as available, Strategic Information, Market Rank/Share for key companies, Products and Services, and Recent Developments)
- 6.3.1 Meta Platforms Inc. (Oculus)
- 6.3.2 Sony Corporation
- 6.3.3 HTC Corporation
- 6.3.4 Apple Inc.
- 6.3.5 Samsung Electronics Co., Ltd.
- 6.3.6 Microsoft Corporation
- 6.3.7 Pico Interactive (ByteDance Ltd.)
- 6.3.8 Valve Corporation
- 6.3.9 Varjo Technologies Oy
- 6.3.10 HP Inc.
- 6.3.11 Carl Zeiss AG
- 6.3.12 Avegant Corporation
- 6.3.13 Varjo Technologies
- 6.3.14 Vrgineers
- 6.3.15 Magic Leap, Inc.
- 6.3.16 Google LLC
- 6.3.17 Eon Reality, Inc.
- 6.3.18 CyberGlove Systems LLC
- 6.3.19 Ultraleap Ltd. (Leap Motion)
- 6.3.20 Sixense Enterprises Inc.
- 6.3.21 Vuzix Corporation
- 6.3.22 Lenovo Group Ltd.
- 6.3.23 Ultraleap Ltd.
7 MARKET OPPORTUNITIES AND FUTURE OUTLOOK
- 7.1 White-space and unmet-need assessment

 全球身臨其境型虛擬實境市場規模、佔有率、趨勢和成長分析報告(2026-2034)
 2026-2030年全球沉浸式媒體市場
 自我調整虛擬實境(VR)環境市場:按組件、技術、應用、設備類型、國家和地區分類—全球產業分析、市場規模、市場佔有率和預測(2026-2033 年)
 身臨其境型培訓:市場佔有率分析、產業趨勢與統計、成長預測(2026-2031)
 身臨其境型VR教育市場預測至2034年-按組件、部署模式、設備類型、組織規模、應用、最終用戶和地區分類的全球分析身臨其境型語言訓練市場預測至2034年-全球分析(按組件、設備類型、技術、應用、最終用戶和地區分類)
 2026年全球延展實境(XR)虛擬工作室市場報告2026年全球國防沉浸式現實市場報告2026年全球智慧虛擬商店設計解決方案市場報告2026年全球沉浸式虛擬商店市場報告