


 |
市場調查報告書
商品編碼
2122219
Tidal Force:市場佔有率分析、產業趨勢與統計、成長預測(2026-2031)Tidal Power - Market Share Analysis, Industry Trends & Statistics, Growth Forecasts (2026 - 2031) |
||||||

※ 本網頁內容可能與最新版本有所差異。詳細情況請與我們聯繫。
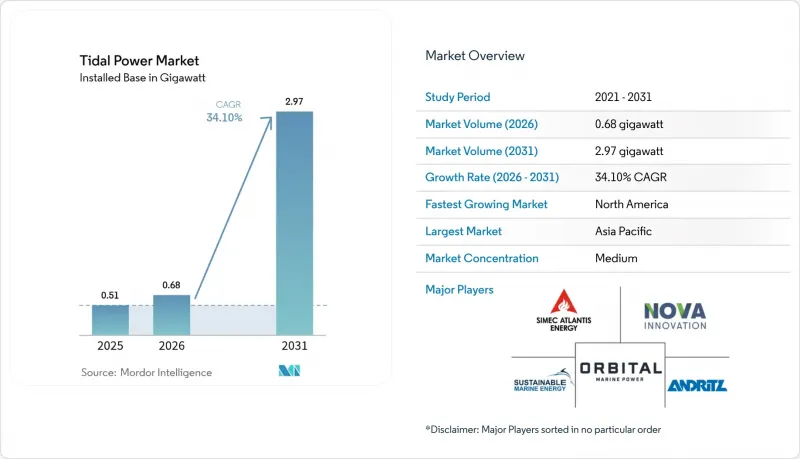
據 Mordor Intelligence 稱,潮汐能市場預計到 2026 年將達到 0.68 吉瓦,高於 2025 年的 0.51 吉瓦,預計到 2031 年將達到 2.97 吉瓦。
預計從 2026 年到 2031 年,其複合年成長率將達到 34.10%。
本報告按發電方式(潮汐堰、浮體式潮汐發電平台、潮汐流發電、動態潮汐發電)、潮汐能轉換設備(水平軸渦輪機等)、應用(發電、海水淡化、船舶推進等)、最終用戶(公共產業、獨立發電商 (IPP)、工業、商業)和地區(北美、歐洲、亞太地區等)進行分類。
全球潮汐能市場趨勢及洞察
全球脫碳和淨零排放目標
各國政府和企業都在尋求更穩定可靠的清潔能源來源,以彌補風能和太陽能的間歇性。中國舟山群島的旗艦電廠展現了國家雄心,而美國負責人預計,到2035年,庫克灣的潮汐能發電計畫將滿足當地高達20%的電力需求。根據二十國集團(G20)的數據,目前約有10%的可再生能源資金分配給了海洋能技術。持續的高產能利用率正在增強潮汐能市場對沿海工廠的提案,因為這些工廠無法承受生產中斷的風險。
在潮差較大的地區實現可預測的發電
由於潮汐週期可以提前數百年預測,營運商可以避免風能和太陽能發電中常見的預測誤差。庫克灣80太瓦時的理論資源容量清晰地展現了其規模。中國沿海地區高達8吉瓦的潛在資源也具有類似的規模。這種精準度顯著降低了備用容量需求,降低了併網成本,並促進了發電與海水淡化相結合的專案。
與其他可再生能源相比,資本投資較高
資本成本介於每千瓦 6,244 美元至 18,700 美元之間,而公用事業用太陽能發電的成本則低於每千瓦 1,000 美元。儘管產能利用率很高,但這仍然限制了資金籌措選擇。由於重型裝運船隻數量有限,啟動成本很高;而且由於複合材料葉片的製造仍然依賴客製化設備,因此前置作業時間很長。目前的平準化成本為每千瓦時 0.12 美元至 0.40 美元,遠高於目前市場價格。然而,根據學習曲線預測,採用歐盟委員會建議的模組化設計和標準化安裝程序可以將成本降低 29%。
細分市場分析
到2025年,潮汐堰將佔總發電量的44.12%,這主要得益於拉朗斯水壩和韓國始華湖等已驗證有效的潮汐壩項目,這些項目每年合計發電550吉瓦時。不受水深限制的浮體式平台預計到2031年將以35.30%的複合年成長率成長。雖然像蘇格蘭梅根陣列這樣的潮汐發電站每年都在增加新的發電容量,但動態潮汐發電的概念仍處於研發階段。將兩者融合是可能的。採用閘門技術的模組化浮體可以將堰式發電的效率與深海環境的柔軟性相結合,從而有可能在沒有河口的海岸線上拓展潮汐發電市場。
同時,平台製造商正轉向在駁船上進行預組裝,以減少40%的海上作業時間。這些措施可望降低最大的支出項目之一——船舶租賃成本,並隨著資本成本的下降,幫助企業在潮汐能市場保持競爭力。
到2025年,水平軸風力渦輪機將佔已安裝機組的62.05%。這主要得益於風電產業齒輪箱、軸承和SCADA邏輯系統的再利用。近期技術的進步使得轉子直徑超過20米,機艙重量也得以減輕。垂直軸機組可適應雙向水道,並最大限度地降低了偏航控制的複雜性。水下風箏利用緩流海域的潮汐流發電,即使在低水頭位置也能實現發電。隨著大規模生產的擴大,電纜、連接器和控制軟體等組件的標準化有望縮短採購前置作業時間。這將使潮汐能市場能夠在不增加成本的情況下擴展其轉換器產品線。
區域分析
到2025年,亞太地區將佔全球總發電量的50.35%,這主要得益於中國產業主導以及韓國在東南亞建成的首座併網電廠。屆時,日本和印尼的計畫將著重於擴大示範電廠的規模,而澳洲則與Minesto公司合作,為偏遠礦區提供電力。
預計北美將成為成長的主要驅動力,年複合成長率將達到49.80%。阿拉斯加庫克灣的資源潛力每年可提供80太瓦時電力,而離岸風力發電的稅額扣抵抵免政策正吸引專案投資者重返該地區。新斯科細亞省修訂後的租賃法加快了芬迪灣的授權流程,而西海岸電網正在探索沿著太平洋沿岸建造海底電纜的可能性。
歐洲仍然是政策趨勢的關鍵驅動力。英國最新的差價合約(CfD)競標為潮汐能項目籌集了資金,位於莫爾萊(Morlet)的240兆瓦潮汐能電站計劃於2025年開工。法國的朗斯大壩(La Rance Dam)建成數十年後,其容量係數仍保持在40%以上,為運維(O&M)方面的最佳實踐數據提供了基礎。北歐的造船廠目前正在將錨作拖船改裝成安裝船,這為潮汐能市場創造了當地的就業機會。
其他好處:
- Excel格式的市場預測(ME)表
- 3個月的分析師支持
目錄
第1章:引言
- 研究假設和市場定義
- 調查範圍
第2章:調查方法
第3章執行摘要
第4章 市場狀況
- 市場概覽
- 市場促進因素
- 全球脫碳和淨零排放目標
- 在潮差較大的地區實現可預測的發電
- 政府補助及上網電價補貼計劃
- 渦輪機和浮體式平台技術的進步
- 位置沿海氫能樞紐
- 與海岸保護和提高應對氣候變遷能力相關的應用
- 市場限制因素
- 與其他可再生能源相比,資本投資較高
- 對海洋生態系影響的擔憂
- 複合材料葉片供應鏈瓶頸
- 偏遠沿海地區電網容量的限制
- 供應鏈分析
- 監理情勢
- 技術展望
- 現有及未來重大項目
- 波特五力模型
第5章 市場規模與成長預測
- 透過發電方法
- 潮汐能
- 浮體式潮汐發電平台
- 潮汐發電
- 動態潮汐發電
- 按類型分列的潮汐發電設備
- 水平軸風力發電機
- 垂直軸風力渦輪機
- 其他潮汐發電裝置
- 透過使用
- 發電
- 海水淡化
- 船舶推進系統
- 數據和通訊平台
- 最終用戶
- 公共產業及獨立電力生產商(IPP)
- 產業
- 商業
- 按地區
- 北美洲
- 美國
- 加拿大
- 墨西哥
- 歐洲
- 英國
- 法國
- 西班牙
- 荷蘭
- 丹麥
- 俄羅斯
- 其他歐洲國家
- 亞太地區
- 中國
- 印度
- 日本
- 韓國
- 東南亞國協
- 澳洲和紐西蘭
- 其他亞太國家
- 南美洲
- 巴西
- 阿根廷
- 哥倫比亞
- 其他南美國家
- 中東和非洲
- 沙烏地阿拉伯
- 阿拉伯聯合大公國
- 南非
- 埃及
- 其他中東和非洲國家
- 北美洲
第6章 競爭情勢
- 市場集中度
- 策略趨勢(併購、聯盟、購電協議)
- 市場佔有率分析(主要公司的市場排名和佔有率)
- 公司簡介
- Andritz AG
- Nova Innovation Ltd
- Orbital Marine Power Ltd
- MAKO Turbines Pty Ltd
- SIMEC Atlantis Energy Ltd
- HydroQuest SAS
- Sustainable Marine Energy Ltd
- Lockheed Martin Corporation
- Verdant Power Inc
- Minesto AB
- Voith Hydro GmbH & Co KG
- Sabella SA
- Carnegie Clean Energy Ltd
- Blue Energy Canada Inc
- Instream Energy Systems Corp
- Kepler Energy Ltd
- Water Wall Turbine Inc
- Seaflow Marine Ltd
- Ocean Renewable Power Company(ORPC)
- GCK Energy SAS
第7章 市場機會與未來展望
According to Mordor Intelligence, tidal power market size in 2026 is estimated at 0.68 gigawatt, growing from 2025 value of 0.51 gigawatt with 2031 projections showing 2.97 gigawatt, growing at 34.10% CAGR over 2026-2031.
This report is Segmented by Power Generation Method (Tidal Barrage, Floating Tidal Power Platform, Tidal Stream Generation, and Dynamic Tidal Power), Tidal Energy Converters (Horizontal Axis Turbine, and More), Application (Power Generation, Desalination, Marine Propulsion, and More), End-User (Utilities and IPPs, Industrial, and Commercial), and Geography (North America, Europe, Asia Pacific, and More).
Global Tidal Power Market Trends and Insights
Global Decarbonization and Net-Zero Targets
Governments and corporations are chasing more predictable clean-power sources to backfill intermittent wind and solar. China's flagship array in the Zhoushan archipelago signals national intent, while U.S. planners see Cook Inlet covering up to 20% of regional demand by 2035. G-20 data show roughly 10% of renewable-finance packages are now directed to ocean-energy technology. Consistently high capacity factors strengthen the tidal power market value proposition for coastal factories that cannot afford production lapses.
Predictable Generation from High-Tidal-Range Sites
Because tidal cycles can be forecast centuries ahead, operators avoid the forecasting errors that plague wind and solar. Cook Inlet's theoretical 80 TWh resource illustrates the scale; China's eight-gigawatt coastal potential offers similar promise. Such precision slashes reserve-margin requirements, easing grid integration costs and supporting power-plus-desalination projects.
High CAPEX versus Other Renewables
Capital requirements range between USD 6,244/kW and USD 18,700/kW, compared to sub-USD 1,000/kW for utility solar, which restricts financing options despite superior capacity factors. Limited fleets of heavy-lift vessels inflate mobilization expenses, while composite-blade fabrication still depends on bespoke facilities, elongating lead times. Current levelized energy costs sit at USD 0.12-0.40/kWh-well above prevailing market rates. Nonetheless, learning-curve projections show potential cost declines of 29% through modular designs and standardized installation sequences endorsed by the European Commission.
Other drivers and restraints analyzed in the detailed report include:
- Government Subsidies and Feed-in Tariffs
- Advancements in Turbine and Floating-Platform Technology
- Marine-Ecosystem Impact Concerns
For complete list of drivers and restraints, kindly check the Table Of Contents.
Segment Analysis
Tidal-barrage plants held 44.12% of capacity in 2025 thanks to proven dams like La Rance and South Korea's 254 MW Sihwa Lake, which together produce 550 GWh a year. Floating platforms, free of depth limits, are on track for a 35.30% CAGR to 2031. Stream devices such as Scotland's MeyGen array add new megawatts yearly, while dynamic-tidal concepts remain in R&D. Convergence is likely: modular floats equipped with sluice-gate technology could merge barrage efficiency with deep-water flexibility, enriching the tidal power market size even where shorelines lack estuaries.
In parallel, platform OEMs are switching to barge-mounted pre-assembly to cut offshore time by 40%. Such tweaks trim vessel rental costs-one of the steepest expense lines-and should keep the tidal power market competitive as capital costs slide.
Horizontal-axis turbines controlled 62.05% of installations in 2025, largely because they borrow gearboxes, bearings, and SCADA logic from the wind sector. Upgrades now push rotor diameters past 20 m while shaving nacelle weight. Vertical-axis units serve bi-directional channels, minimizing yaw complexity, and underwater kites harvest slower currents to unlock low-head sites. As serial production ramps up, cross-item standardization-cables, connectors, control software-should shrink procurement lead times, helping the tidal power market broaden its converter mix without escalating costs.
Complete Report Scope:
- By Power Generation Method
- Tidal Barrage
- Floating Tidal Power Platform
- Tidal Stream Generation
- Dynamic Tidal Power
- By Tidal Energy Converters
- Horizontal Axis Turbine
- Vertical Axis Turbine
- Other Tidal Energy Converters
- By Application
- Power Generation
- Desalination
- Marine Propulsion
- Data and Telecom Platforms
- By End-User
- Utilities and IPPs
- Industrial
- Commercial
- By Geography
- North America
- United States
- Canada
- Mexico
- Europe
- United Kingdom
- France
- Spain
- Netherlands
- Denmark
- Russia
- Rest of Europe
- Asia Pacific
- China
- India
- Japan
- South Korea
- ASEAN Countries
- Australia and New Zealand
- Rest of Asia Pacific
- South America
- Brazil
- Argentina
- Colombia
- Rest of South America
- Middle East and Africa
- Saudi Arabia
- United Arab Emirates
- South Africa
- Egypt
- Rest of Middle East and Africa
- North America
Geography Analysis
Asia-Pacific held 50.35% of capacity in 2025, led by China's industrial drive and Southeast Asia's first grid-connected plant in South Korea. Japanese and Indonesian programs next focus on upscaling pilot devices, while Australia partners with Minesto to electrify isolated mining hubs.
North America is projected to be the growth champion at 49.80% CAGR. Alaska's Cook Inlet resource could feed 80 TWh a year, and tax-credit parity with offshore wind is drawing project financiers back to the region. Nova Scotia's revised leasing act speeds permitting in the Bay of Fundy, and West Coast grids study subsea cables for future Pacific builds.
Europe remains the policy trend-setter. The U.K.'s latest CfD round reserved a tidal budget, and the 240 MW Morlais zone entered early works in 2025. France's decades-old La Rance barrage still runs at more than 40% capacity factor, anchoring O&M best-practice data. Nordic yards now retrofit anchor-handling tugs into installation craft, adding local content jobs to the tidal power market narrative.
- Andritz AG
- Nova Innovation Ltd
- Orbital Marine Power Ltd
- MAKO Turbines Pty Ltd
- SIMEC Atlantis Energy Ltd
- HydroQuest SAS
- Sustainable Marine Energy Ltd
- Lockheed Martin Corporation
- Verdant Power Inc
- Minesto AB
- Voith Hydro GmbH & Co KG
- Sabella SA
- Carnegie Clean Energy Ltd
- Blue Energy Canada Inc
- Instream Energy Systems Corp
- Kepler Energy Ltd
- Water Wall Turbine Inc
- Seaflow Marine Ltd
- Ocean Renewable Power Company (ORPC)
- GCK Energy SAS
Additional Benefits:
- The market estimate (ME) sheet in Excel format
- 3 months of analyst support
TABLE OF CONTENTS
1 Introduction
- 1.1 Study Assumptions & Market Definition
- 1.2 Scope of the Study
2 Research Methodology
3 Executive Summary
4 Market Landscape
- 4.1 Market Overview
- 4.2 Market Drivers
- 4.2.1 Global decarbonization & net-zero targets
- 4.2.2 Predictable generation from high-tidal-range sites
- 4.2.3 Government subsidies & feed-in tariffs
- 4.2.4 Advancements in turbine & floating-platform tech
- 4.2.5 Co-location with coastal hydrogen hubs
- 4.2.6 Coastal-protection & climate-resilience applications
- 4.3 Market Restraints
- 4.3.1 High CAPEX versus other renewables
- 4.3.2 Marine-ecosystem impact concerns
- 4.3.3 Supply-chain bottlenecks for composite blades
- 4.3.4 Limited grid capacity in remote coastlines
- 4.4 Supply-Chain Analysis
- 4.5 Regulatory Landscape
- 4.6 Technological Outlook
- 4.7 Existing and Key Upcoming Projects
- 4.8 Porter's Five Forces
- 4.8.1 Bargaining Power of Suppliers
- 4.8.2 Bargaining Power of Buyers
- 4.8.3 Threat of New Entrants
- 4.8.4 Threat of Substitute Products
- 4.8.5 Intensity of Competitive Rivalry
5 Market Size & Growth Forecasts
- 5.1 By Power Generation Method
- 5.1.1 Tidal Barrage
- 5.1.2 Floating Tidal Power Platform
- 5.1.3 Tidal Stream Generation
- 5.1.4 Dynamic Tidal Power
- 5.2 By Tidal Energy Converters
- 5.2.1 Horizontal Axis Turbine
- 5.2.2 Vertical Axis Turbine
- 5.2.3 Other Tidal Energy Converters
- 5.3 By Application
- 5.3.1 Power Generation
- 5.3.2 Desalination
- 5.3.3 Marine Propulsion
- 5.3.4 Data and Telecom Platforms
- 5.4 By End-User
- 5.4.1 Utilities and IPPs
- 5.4.2 Industrial
- 5.4.3 Commercial
- 5.5 By Geography
- 5.5.1 North America
- 5.5.1.1 United States
- 5.5.1.2 Canada
- 5.5.1.3 Mexico
- 5.5.2 Europe
- 5.5.2.1 United Kingdom
- 5.5.2.2 France
- 5.5.2.3 Spain
- 5.5.2.4 Netherlands
- 5.5.2.5 Denmark
- 5.5.2.6 Russia
- 5.5.2.7 Rest of Europe
- 5.5.3 Asia Pacific
- 5.5.3.1 China
- 5.5.3.2 India
- 5.5.3.3 Japan
- 5.5.3.4 South Korea
- 5.5.3.5 ASEAN Countries
- 5.5.3.6 Australia and New Zealand
- 5.5.3.7 Rest of Asia Pacific
- 5.5.4 South America
- 5.5.4.1 Brazil
- 5.5.4.2 Argentina
- 5.5.4.3 Colombia
- 5.5.4.4 Rest of South America
- 5.5.5 Middle East and Africa
- 5.5.5.1 Saudi Arabia
- 5.5.5.2 United Arab Emirates
- 5.5.5.3 South Africa
- 5.5.5.4 Egypt
- 5.5.5.5 Rest of Middle East and Africa
- 5.5.1 North America
6 Competitive Landscape
- 6.1 Market Concentration
- 6.2 Strategic Moves (M&A, Partnerships, PPAs)
- 6.3 Market Share Analysis (Market Rank/Share for key companies)
- 6.4 Company Profiles (includes Global level Overview, Market level overview, Core Segments, Financials as available, Strategic Information, Products & Services, and Recent Developments)
- 6.4.1 Andritz AG
- 6.4.2 Nova Innovation Ltd
- 6.4.3 Orbital Marine Power Ltd
- 6.4.4 MAKO Turbines Pty Ltd
- 6.4.5 SIMEC Atlantis Energy Ltd
- 6.4.6 HydroQuest SAS
- 6.4.7 Sustainable Marine Energy Ltd
- 6.4.8 Lockheed Martin Corporation
- 6.4.9 Verdant Power Inc
- 6.4.10 Minesto AB
- 6.4.11 Voith Hydro GmbH & Co KG
- 6.4.12 Sabella SA
- 6.4.13 Carnegie Clean Energy Ltd
- 6.4.14 Blue Energy Canada Inc
- 6.4.15 Instream Energy Systems Corp
- 6.4.16 Kepler Energy Ltd
- 6.4.17 Water Wall Turbine Inc
- 6.4.18 Seaflow Marine Ltd
- 6.4.19 Ocean Renewable Power Company (ORPC)
- 6.4.20 GCK Energy SAS
7 Market Opportunities & Future Outlook
- 7.1 White-space & Unmet-Need Assessment
- 7.2 Emerging Blue-Economy Synergies
- 7.3 Coastal-Infrastructure Integration Projects


