


 |
市場調查報告書
商品編碼
2122218
備用電源系統:市場佔有率分析、產業趨勢與統計、成長預測(2026-2031)Backup Power Systems - Market Share Analysis, Industry Trends & Statistics, Growth Forecasts (2026 - 2031) |
||||||

※ 本網頁內容可能與最新版本有所差異。詳細情況請與我們聯繫。
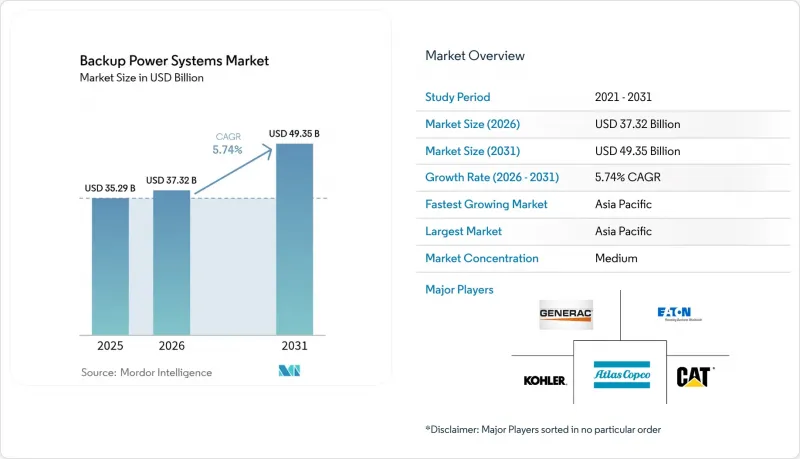
據 Mordor Intelligence 稱,2025 年備用電源系統市值為 352.9 億美元,預計到 2031 年將達到 493.5 億美元,而 2026 年為 373.2 億美元,預測期(2026-2031 年)的複合年成長率為 5.74%。
本報告按技術(柴油發電機、燃氣發電機、電池系統等)、額定功率(50 KVA 以下、51–280 KVA、501–2,000 KVA 等)、應用(備用/緊急電源、尖峰用電調節和負載管理等)、最終用戶(工業和製造業、資料中心和 IT 等)以及地區(北美、削峰和負載管理等)、最終用戶(工業和製造業、資料中心和 IT 等)以及地區(北美、分類歐洲、亞太地區等)進行分類。
全球備用電源系統市場趨勢及洞察
停電頻率和經濟損失
由於天氣因素的影響,電力公司正面臨日益頻繁且嚴重的停電問題。 2000年至2023年間,美國80%的重大停電事故都與天氣有關。長時間的停電,尤其是每小時損失超過10萬美元的停電,促使電力公司將備用容量視為營運的保障。 2021年的冬季風暴刺激了德克薩斯州微電網建設的激增,專案成本在每兆瓦200萬至500萬美元之間。因此,投資重點轉向能夠承受持續數天停電的高容量系統。老舊電網的現代化改造無法滿足日益成長的可靠性需求,分散式資產在2030年之前仍將是重要的風險對沖手段。這些因素共同推動了備用電源系統市場的成長。
超大規模和邊緣資料中心擴展
預計到2030年,光是美國資料中心的電力需求就將達到35吉瓦,其中超大規模超大規模資料中心業者中心將佔60%。目前,單一園區所需的備用容量就超過1吉瓦,遠超過傳統設施的標準。邊緣部署使節點數量翻倍,每個節點需要50至500千瓦的備用功率,才能確保延遲低於10毫秒。電池系統因其運作安靜和瞬時切換能力而日益普及,這對於噪音法規嚴格的都市區至關重要。可再生能源購電協議(PPA)帶來的間歇性正在推動柴油-電池混合系統的發展,以保護人工智慧工作負載,從而鞏固了對備用電源系統的強勁需求。
柴油燃料價格波動劇烈,營運成本高昂。
柴油發電機組的燃料成本佔其全生命週期運作成本的70%之多,而價格波動會削弱預算規劃的確定性。日本資料中心協會(JDCC)警告稱,在長時間的緊急情況下,發電機組的同步運作可能會對當地的柴油燃料供應鏈造成壓力。碳排放稅推高了燃料交付價格,使得柴油發電機組的總擁有成本高於電池儲能系統。城市地區的儲能法規通常會限制現場蘊藏量,而增加的運輸頻率也會增加物流風險。這些因素都在抑制柴油發電機組的普及,並減緩備用電源系統市場的成長速度。
細分市場分析
在備用電源系統市場,柴油發電機佔據39.74%的市場佔有率,而電池能源儲存系統(BESS)市場規模達57.6億美元,預計到2031年將以13.1%的複合年成長率成長。由於燃料物流系統成熟,柴油在偏遠地區的採礦和重工業領域仍然至關重要,但日益嚴格的排放法規正迫使資料中心和醫療機構營運商轉向鋰離子電池和新興的鈉離子電池。天然氣發電機在備用電源系統中保持強大的市場佔有率,因為天然氣管道能夠確保在電網中斷期間的長期運作。 UPS平台可將IT機架維持在線上數秒至數分鐘,從而彌補大規模設施恢復運作前的電力缺口。在獨立的微電網中,結合太陽能、電池和柴油的混合系統可減少35%的燃料消耗,在提高專案經濟效益的同時,也滿足了碳減排承諾。加州一家資料中心的燃料電池先導計畫展現了氫供應鏈成熟後的未來。
由於供應商群的不斷擴大,電池儲能系統(BESS)的成本每年降低8-10%,容量超過2兆瓦時的系統如今已能滿足邊緣園區4小時自主運作的目標。技術供應商正在整合人工智慧控制器,以實現電池循環和尖峰用電調節,即使沒有停電也能從同一套硬體中獲利。這種雙重價值模式正在提高投資報酬率,並加速備用電源系統市場的普及。
到2025年,501-2000 kVA等級的設備將佔據備用電源系統市場31.28%的佔有率,因為它們適用於中型資料中心、醫院和輕工業設施。預計其複合年成長率為7.43%,高於小規模住宅用可攜式發電機僅能為關鍵負載供電數小時的規模。標準化的1 MW模組允許營運商以1 MW為增量進行擴展,與客製化開發相比,設計前置作業時間縮短了25%。 2000 kVA以上的設備在公用事業規模的發電廠和石化聯合企業中佔據主導地位,但訂單週期不規律,且取決於大型企劃的批准。
280 kVA 以下的功率段主要用於通訊塔和零售商店,並採用磷酸鋰鐵鋰電池取代鉛酸電池,以減少現場維護。供應商正在整合遠距離診斷功能,使技術人員能夠管理分佈在數百個地點的設備,從而降低營運成本並擴大備用電源系統市場規模。
區域分析
到2025年,亞太地區將佔全球銷售額的39.12%,其6.18%的複合年成長率(CAGR)仍是所有地區中最高的。這主要得益於中國、印度和日本不斷擴大其超大規模資料中心和智慧工廠的產能(CBRE.COM)。中國的政策迫使本土電池供應商提高產量,從而降低了全部區域的成本,並進一步推動了電池的普及。印度針對電子產品的「生產連結獎勵計畫計畫」正在加速新建晶圓廠,而所有這些晶圓廠都需要高度可靠的備用電源。日本電力公司已承諾投資1,500億日圓(約10.4億美元)以加強與資料中心叢集相關的電網,這帶動了並行備用系統訂單的成長。
北美則位居第二,這主要得益於美國雲端服務供應商的支出以及天氣相關停電的風險(平均每位用戶每年停電時間超過7小時)。該地區的備用電源系統市場受益於《通貨膨脹削減法案》提供的電池稅額扣抵,從而促使鋰離子電池組採購量增加,用於抑低尖峰負載。柴油在加拿大偏遠礦區仍佔據主導地位,但氫柴油雙燃料系統的試點計畫旨在減少15%的排放。
在歐洲,隨著可再生能源的普及,間歇性停電的風險日益增加,市場也穩定擴張。德國規定,2024年電網風電裝置容量上限為6.4太瓦時(TWh),促使工廠採用熱電聯產機組,這些機組也可作為備用電源。在倫敦和巴黎的超低排放區,一旦發布霧霾預警,就禁止使用老舊的柴油發電機,這推動了電池能源儲存系統(BESS)的維修。在南歐,野火季不斷延長,電信公司正轉向採用符合靜音運作法規的貨櫃式太陽能發電和電池儲能解決方案。
在中東和非洲,強制資料在地化推動了利雅德、杜拜和內羅畢等地新建三級資料中心。由於高溫環境會縮短電池壽命,因此在初始部署階段,燃氣和電池混合解決方案通常是首選。在南美洲,電網投資落後於需求成長,乾旱導致水力發電減少,柴油進口量激增,進而帶動發電機訂單旺盛。這些趨勢共同促成了整個備用電源系統市場的廣泛成長。
其他好處:
- Excel格式的市場預測(ME)表
- 3個月的分析師支持
目錄
第1章:引言
- 研究假設和市場定義
- 調查範圍
第2章:調查方法
第3章執行摘要
第4章 市場狀況
- 市場概覽
- 市場促進因素
- 停電頻率和經濟損失
- 超大規模和邊緣資料中心擴展
- 自動化工業流程全年365天、每天24小時運作
- 關鍵設施的監管要求
- 離網電動車快速充電走廊
- 引入人工智慧驅動的預測性維護
- 市場限制因素
- 柴油價格波動和高營運成本(OPEX)
- 替換為長壽命儲能系統
- 資本密集型大規模實施
- 都市區的低噪音/超低排放區
- 供應鏈分析
- 監理情勢
- 技術展望
- 波特五力模型
第5章 市場規模與成長預測
- 透過技術
- 柴油發電機
- 瓦斯發電機
- 不斷電系統(UPS)
- 電池能源儲存系統(BESS)
- 混合電源解決方案
- 燃料電池備用系統
- 可攜式電源
- 額定功率
- 50千伏安或以下
- 51~280 kVA
- 281~500 kVA
- 501~2,000 kVA
- 超過2000千伏安
- 透過使用
- 備用/緊急電源
- 主電源/持續電源
- 抑低尖峰負載與負載管理
- 離網及偏遠地區電力
- 最終用戶
- 住宅
- 商業設施(零售、辦公室、飯店)
- 工業和製造業
- 資料中心和IT
- 醫療機構
- 通訊塔
- 公共產業和能源
- 政府/國防
- 按地區
- 北美洲
- 美國
- 加拿大
- 墨西哥
- 歐洲
- 德國
- 英國
- 法國
- 義大利
- 北歐國家
- 俄羅斯
- 其他歐洲國家
- 亞太地區
- 中國
- 印度
- 日本
- 韓國
- 東南亞國協
- 其他亞太國家
- 南美洲
- 巴西
- 阿根廷
- 其他南美國家
- 中東和非洲
- 沙烏地阿拉伯
- 阿拉伯聯合大公國
- 南非
- 埃及
- 其他中東和非洲國家
- 北美洲
第6章 競爭情勢
- 市場集中度
- 策略趨勢(併購、聯盟、購電協議)
- 市場佔有率分析(主要公司的市場排名和市場佔有率)
- 公司簡介
- Caterpillar Inc.
- Cummins Inc.
- Generac Holdings Inc.
- Kohler Co.
- Eaton Corporation plc
- Schneider Electric SE
- ABB Ltd.
- Vertiv Group Corp.
- Mitsubishi Heavy Industries Ltd.
- Rolls-Royce Holdings plc(MTU)
- Siemens AG
- Honda Motor Co., Ltd.
- Yanmar Holdings Co., Ltd.
- Atlas Copco AB
- Doosan Portable Power
- Delta Electronics Inc.
- Huawei Technologies Co. Ltd.
- Toshiba Corporation
- Perkins Engines Co. Ltd.
- FG Wilson
- Briggs & Stratton LLC
- Goal Zero LLC
第7章 市場機會與未來展望
According to Mordor Intelligence, the backup power systems market size was valued at USD 35.29 billion in 2025 and estimated to grow from USD 37.32 billion in 2026 to reach USD 49.35 billion by 2031, at a CAGR of 5.74% during the forecast period (2026-2031).
This report is Segmented by Technology (Diesel Generators, Gas Generators, Battery Energy Storage Systems, and More), Power Rating (Up To 50 KVA, 51 To 280 KVA, 501 To 2, 000 KVA, and More), Application (Standby/Emergency Power, Peak Shaving and Load Management, and More), End-User (Industrial and Manufacturing, Data Centres and IT, and More), and Geography (North America, Europe, Asia-Pacific, and More).
Global Backup Power Systems Market Trends and Insights
Grid-Outage Frequency & Economic Losses
Utilities are facing more frequent and severe-weather failures, and 80% of major U.S. outages between 2000 and 2023 were weather-related. Prolonged blackouts prompt enterprises to view backup capacity as operational insurance, particularly when downtime exceeds USD 100,000 per hour. Texas microgrid construction surged after the 2021 winter storm, with projects costing USD 2 million-USD 5 million per MW. Investments therefore favor higher-capacity systems that bridge multi-day disruptions. The modernization of aging grids trails behind reliability needs, so distributed assets remain a critical hedge through 2030. These conditions collectively drive the growth of the backup power systems market.
Expansion of Hyperscale & Edge Data-Centres
Global data-center power demand is on track to reach 35 GW in the United States alone by 2030, with hyperscalers accounting for 60% of that growth. Single campuses now request 1 GW or more of backup capacity, dwarfing previous facility norms. Edge roll-outs multiply the node count, each demanding 50-500 kW of standby supply to guarantee sub-10-millisecond latency. Battery systems gain favor for their silent operation and instantaneous switchover, a must in urban zones with strict noise limits. Renewable-energy power-purchase agreements introduce intermittency, prompting the development of hybrid diesel-battery stacks to protect AI workloads, thereby solidifying robust demand for the backup power systems market.
Volatile Diesel-Fuel Costs & High OPEX
Fuel accounts for up to 70% of a diesel set's lifetime operating expense, and price swings erode budgeting certainty. The Japan Data Center Council cautioned that simultaneous generator runs could strain regional diesel supply chains during lengthy emergencies.Carbon levies inflate delivered fuel prices, raising the total cost of ownership relative to batteries. Storage regulations in city centers often cap on-site volumes, forcing more frequent deliveries that raise logistics risk. These factors temper diesel uptake and moderate the growth rate of the backup power systems market.
Other drivers and restraints analyzed in the detailed report include:
- 24 X 7 Automated Industrial Operations
- Regulatory Mandates for Critical Facilities
- Substitution by Long-Duration BESS
For complete list of drivers and restraints, kindly check the Table Of Contents.
Segment Analysis
The backup power systems market size for diesel generators accounted for a 39.74% share, whereas BESS captured USD 5.76 billion and is projected to advance at a 13.1% CAGR through 2031. Diesel's entrenched fuel logistics keep it essential for remote mines and heavy industry, yet emissions caps motivate data-center and healthcare operators to pivot toward lithium-ion and emerging sodium-ion packs. The backup power systems market share for gas generators remains resilient because natural-gas pipelines offer extended runtimes during grid failures. UPS platforms keep IT racks online for seconds to minutes, bridging the gap until larger assets engage. Hybrid sets that blend PV, batteries, and diesel cut fuel consumption by 35% on islanded microgrids, improving project economics while satisfying carbon-reduction pledges. Fuel-cell pilots in California data centers illustrate future pathways if hydrogen supply chains mature.
A widening supplier base is reducing BESS system costs by 8-10% annually, and installations above 2 MWh now meet four-hour autonomy targets for edge campuses. Technology vendors embed AI controllers to cycle batteries for peak shaving, thereby monetizing the same hardware outside outage events. That dual-value model lifts return on investment and accelerates adoption across the backup power systems market.
Units rated 501-2,000 kVA captured 31.28% of the backup power systems market share in 2025, due to their suitability for mid-tier data halls, hospitals, and light-industrial campuses. Their 7.43% CAGR outlook exceeds that for smaller residential classes, where portable power stations satisfy only critical loads for a few hours. Standardized 1 MW blocks enable operators to scale in 1 MW increments, reducing engineering lead times by 25% compared to bespoke builds. Above-2,000 kVA packages dominate utility-scale stations and petrochemical complexes; however, order cycles are lumpy and tied to the approval of megaprojects.
Segments below 280 kVA serve telecom towers and retail stores, with lithium-iron-phosphate batteries replacing lead-acid banks to curb field maintenance. Vendors integrate remote diagnostics, allowing a single technician to oversee hundreds of dispersed installations, thereby lowering operating costs and supporting volume growth in the backup power systems market.
Complete Report Scope:
- By Technology
- Diesel Generators
- Gas Generators
- Uninterruptible Power Supply (UPS)
- Battery Energy Storage Systems (BESS)
- Hybrid Power Solutions
- Fuel-Cell Backup Systems
- Portable Power Stations
- By Power Rating
- Up to 50 kVA
- 51 to 280 kVA
- 281 to 500 kVA
- 501 to 2,000 kVA
- Above 2,000 kVA
- By Application
- Standby/Emergency Power
- Prime/Continuous Power
- Peak Shaving and Load Management
- Off-Grid and Remote Power
- By End-User
- Residential
- Commercial (Retail, Offices, Hospitality)
- Industrial and Manufacturing
- Data Centres and IT
- Healthcare Facilities
- Telecom Towers
- Utilities and Energy
- Government and Defence
- By Geography
- North America
- United States
- Canada
- Mexico
- Europe
- Germany
- United Kingdom
- France
- Italy
- NORDIC Countries
- Russia
- Rest of Europe
- Asia-Pacific
- China
- India
- Japan
- South Korea
- ASEAN Countries
- Rest of Asia-Pacific
- South America
- Brazil
- Argentina
- Rest of South America
- Middle East and Africa
- Saudi Arabia
- United Arab Emirates
- South Africa
- Egypt
- Rest of Middle East and Africa
- North America
Geography Analysis
Asia-Pacific captured 39.12% of 2025 revenue, and its 6.18% CAGR remains the highest among regions as China, India, and Japan add both hyperscale data halls and smart-factory capacity CBRE.COM. Chinese policy drives local battery suppliers to ramp production, which lowers regional costs and fuels further adoption. India's Production-Linked Incentive scheme for electronics stimulates the construction of new fabs, all of which require high-reliability backup. Japan's utilities pledge JPY 150 billion (USD 1.04 billion) in grid reinforcements tied to data-center clusters, spurring parallel backup system orders.
North America ranks second, driven by US cloud-provider spending and weather-related outage exposure that averages over 7 hours per customer annually. The backup power systems market size for the region benefits from tax credits on battery storage under the Inflation Reduction Act, tipping procurement toward lithium packs for peak shaving. Canada's remote mining belts still favor diesel, but pilot hydrogen-diesel dual-fuel rigs aim to cut emissions 15%.
Europe advances steadily as renewable penetration lifts intermittency risks. Germany's grid had 6.4 TWh of curtailed wind power in 2024, prompting factories to adopt combined heat-and-power engines that also serve as standby units. Ultra-Low-Emission Zones in London and Paris ban older diesel sets during smog alerts, catalyzing BESS retrofits. Southern Europe's wildfire seasons are lengthening, prompting telecoms to deploy containerized solar-battery solutions that meet silent-operation bylaws.
The Middle East and Africa benefit from data localization mandates that seed new Tier III colocation sites in Riyadh, Dubai, and Nairobi. High ambient temperatures shorten battery life, so hybrid gas-plus-battery solutions are often the preferred choice in initial builds. South America's grid investments trail demand growth, and diesel imports swell during drought-linked hydro-power deficits, keeping generator orders brisk. Together, these dynamics distribute growth widely across the backup power systems market.
- Caterpillar Inc.
- Cummins Inc.
- Generac Holdings Inc.
- Kohler Co.
- Eaton Corporation plc
- Schneider Electric SE
- ABB Ltd.
- Vertiv Group Corp.
- Mitsubishi Heavy Industries Ltd.
- Rolls-Royce Holdings plc (MTU)
- Siemens AG
- Honda Motor Co., Ltd.
- Yanmar Holdings Co., Ltd.
- Atlas Copco AB
- Doosan Portable Power
- Delta Electronics Inc.
- Huawei Technologies Co. Ltd.
- Toshiba Corporation
- Perkins Engines Co. Ltd.
- FG Wilson
- Briggs & Stratton LLC
- Goal Zero LLC
Additional Benefits:
- The market estimate (ME) sheet in Excel format
- 3 months of analyst support
TABLE OF CONTENTS
1 Introduction
- 1.1 Study Assumptions & Market Definition
- 1.2 Scope of the Study
2 Research Methodology
3 Executive Summary
4 Market Landscape
- 4.1 Market Overview
- 4.2 Market Drivers
- 4.2.1 Grid-outage frequency & economic losses
- 4.2.2 Expansion of hyperscale & edge data-centres
- 4.2.3 24 X 7 automated industrial operations
- 4.2.4 Regulatory mandates for critical facilities
- 4.2.5 Off-grid EV fast-charging corridors
- 4.2.6 AI-driven predictive maintenance adoption
- 4.3 Market Restraints
- 4.3.1 Volatile diesel-fuel costs & high OPEX
- 4.3.2 Substitution by long-duration BESS
- 4.3.3 Capital-intensive large-scale installs
- 4.3.4 Urban low-noise/ultra-low-emission zoning
- 4.4 Supply-Chain Analysis
- 4.5 Regulatory Landscape
- 4.6 Technological Outlook
- 4.7 Porter's Five Forces
- 4.7.1 Bargaining Power of Suppliers
- 4.7.2 Bargaining Power of Buyers
- 4.7.3 Threat of New Entrants
- 4.7.4 Threat of Substitutes
- 4.7.5 Competitive Rivalry
5 Market Size & Growth Forecasts
- 5.1 By Technology
- 5.1.1 Diesel Generators
- 5.1.2 Gas Generators
- 5.1.3 Uninterruptible Power Supply (UPS)
- 5.1.4 Battery Energy Storage Systems (BESS)
- 5.1.5 Hybrid Power Solutions
- 5.1.6 Fuel-Cell Backup Systems
- 5.1.7 Portable Power Stations
- 5.2 By Power Rating
- 5.2.1 Up to 50 kVA
- 5.2.2 51 to 280 kVA
- 5.2.3 281 to 500 kVA
- 5.2.4 501 to 2,000 kVA
- 5.2.5 Above 2,000 kVA
- 5.3 By Application
- 5.3.1 Standby/Emergency Power
- 5.3.2 Prime/Continuous Power
- 5.3.3 Peak Shaving and Load Management
- 5.3.4 Off-Grid and Remote Power
- 5.4 By End-User
- 5.4.1 Residential
- 5.4.2 Commercial (Retail, Offices, Hospitality)
- 5.4.3 Industrial and Manufacturing
- 5.4.4 Data Centres and IT
- 5.4.5 Healthcare Facilities
- 5.4.6 Telecom Towers
- 5.4.7 Utilities and Energy
- 5.4.8 Government and Defence
- 5.5 By Geography
- 5.5.1 North America
- 5.5.1.1 United States
- 5.5.1.2 Canada
- 5.5.1.3 Mexico
- 5.5.2 Europe
- 5.5.2.1 Germany
- 5.5.2.2 United Kingdom
- 5.5.2.3 France
- 5.5.2.4 Italy
- 5.5.2.5 NORDIC Countries
- 5.5.2.6 Russia
- 5.5.2.7 Rest of Europe
- 5.5.3 Asia-Pacific
- 5.5.3.1 China
- 5.5.3.2 India
- 5.5.3.3 Japan
- 5.5.3.4 South Korea
- 5.5.3.5 ASEAN Countries
- 5.5.3.6 Rest of Asia-Pacific
- 5.5.4 South America
- 5.5.4.1 Brazil
- 5.5.4.2 Argentina
- 5.5.4.3 Rest of South America
- 5.5.5 Middle East and Africa
- 5.5.5.1 Saudi Arabia
- 5.5.5.2 United Arab Emirates
- 5.5.5.3 South Africa
- 5.5.5.4 Egypt
- 5.5.5.5 Rest of Middle East and Africa
- 5.5.1 North America
6 Competitive Landscape
- 6.1 Market Concentration
- 6.2 Strategic Moves (M&A, Partnerships, PPAs)
- 6.3 Market Share Analysis (Market Rank/Share for key companies)
- 6.4 Company Profiles (includes Global level Overview, Market level overview, Core Segments, Financials as available, Strategic Information, Products & Services, and Recent Developments)
- 6.4.1 Caterpillar Inc.
- 6.4.2 Cummins Inc.
- 6.4.3 Generac Holdings Inc.
- 6.4.4 Kohler Co.
- 6.4.5 Eaton Corporation plc
- 6.4.6 Schneider Electric SE
- 6.4.7 ABB Ltd.
- 6.4.8 Vertiv Group Corp.
- 6.4.9 Mitsubishi Heavy Industries Ltd.
- 6.4.10 Rolls-Royce Holdings plc (MTU)
- 6.4.11 Siemens AG
- 6.4.12 Honda Motor Co., Ltd.
- 6.4.13 Yanmar Holdings Co., Ltd.
- 6.4.14 Atlas Copco AB
- 6.4.15 Doosan Portable Power
- 6.4.16 Delta Electronics Inc.
- 6.4.17 Huawei Technologies Co. Ltd.
- 6.4.18 Toshiba Corporation
- 6.4.19 Perkins Engines Co. Ltd.
- 6.4.20 FG Wilson
- 6.4.21 Briggs & Stratton LLC
- 6.4.22 Goal Zero LLC
7 Market Opportunities & Future Outlook
- 7.1 White-Space & Unmet-Need Assessment

 住宅緊急電源市場規模、佔有率和趨勢分析報告:按產品、輸出容量、緊急電源配置、地區和細分市場預測(2026-2033 年)美國住宅緊急電源市場規模、佔有率和趨勢分析報告:按產品、輸出功率、緊急電源配置、地區和細分市場分類(2026-2033 年)
 美國備用電源系統:市場佔有率分析、產業趨勢與統計及成長預測(2026-2031 年)
 緊急電源系統市場-2026-2032年全球市場預測
 家用電池備用系統市場規模:按類型、應用、地區和預測分類
 資料中心備用電源市場預測至2034年-按電源類型、輸出容量、資料中心類型、應用、最終用戶和地區分類的全球分析
 備用電源市場:按類型、應用程式、最終用戶和地區分類家用緊急電源市場規模、佔有率和成長率;全球產業分析;按類型、應用和地區分析;以及未來預測(2026-2034 年)。超級電容備用電源系統市場:按技術、額定電壓、外形規格、最終用戶和應用分類,全球預測(2026-2032年)全球資料中心進階備用電源解決方案市場:預測(至 2034 年)—按組件、電源、解決方案類型、功率容量、資料中心類型、最終用戶和地區進行分析