


 |
市場調查報告書
商品編碼
2116300
美國備用電源系統:市場佔有率分析、產業趨勢與統計及成長預測(2026-2031 年)United States Backup Power Systems - Market Share Analysis, Industry Trends & Statistics, Growth Forecasts (2026 - 2031) |
||||||

※ 本網頁內容可能與最新版本有所差異。詳細情況請與我們聯繫。
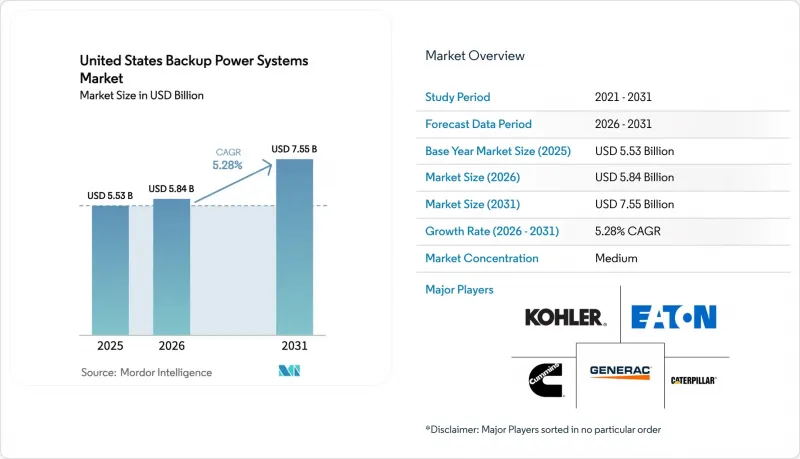
據 Mordor Intelligence 稱,2025 年美國備用電源系統市值為 55.3 億美元,預計到 2031 年將達到 75.5 億美元,而 2026 年為 58.4 億美元,預測期(2026-2031 年)的複合年成長率為 5.28%。
本報告按技術(燃氣發電機、電池能源儲存系統、燃料電池備用系統等)、額定輸出(50 KVA 以下、50–280 KVA、280–500 KVA、500–2,000 KVA、2,000 KVA 以上)、應用(備用/緊急電源、離網和遠程電源等製造業)以及終端數據和工業分類中心。
美國備用電源系統市場趨勢與洞察。
資料中心擴展
超大規模營運商將在2025年運作11吉瓦的新增閒置頻段,需要23吉瓦的冗餘現場電力來滿足N+1和2N拓撲結構的需求。在勞登縣,將新增1.2吉瓦的柴油和燃氣發電機組,這將對當地空氣品質法規的合規性構成壓力,並促使當地啟動一個利用電池輔助延長正常運作的試點計畫。隨著每個機架的功率密度提升至50-60千瓦,備用系統需要能夠在毫秒級內提供電壓穩定,這推動了對混合型UPS系統與快速啟動燃氣渦輪機相結合的需求。由於可再生能源和土地資源的便利,奧勒岡州和德克薩斯州的二級樞紐正在擴大規模,但電網擁塞也提升了現場備用電源的戰略價值。這些發展趨勢共同表明,美國備用電源系統市場將長期成長。
嚴重停電的頻率和持續時間
2024年,私人電力公司的電網平均持續時間指數(SAIDI)上升了15%,反映出極端天氣和基礎設施老化問題。 2025年颶風季期間,佛羅裡達州和路易斯安那州因颶風造成的停電平均持續時間為72小時,促使保險公司將安裝備用電源系統作為保單續保的必要條件。加州在2025年實施了為期38天的公共安全停電(PSPS),部分線路的停電時間超過200小時。這使得備用電源的經濟效益從不常用的資產轉變為運作資源。佛蒙特州和緬因州的冰暴導致長達一週的停電,促使州立法機構透過對超過10千瓦的住宅電力系統提供稅額扣抵。停電頻率的增加正促使各行各業將備用電源採購納入資本預算,進一步加速了美國備用電源系統市場的成長。
美國環保署收緊排放法規
第四階段最終排放標準將粒狀物排放量限制在0.03克/千瓦時,氮氧化物排放量限制在0.4克/千瓦時,而引入後處理系統會使每台發電機增加8000至15000美元的額外成本。加州空氣資源委員會強制要求增加過濾器再生循環次數,將使年度維護成本增加12%至18%。在洛杉磯和聖華金谷,最佳可行控制技術(BACT)的應用已使柴油發電工程的建設週期延長了多達九個月,買家正在轉向氮氧化物排放量降低60%的天然氣和丙烷發電機。不合規的設備無法轉售,導致二手發電機次市場低迷,生命週期成本上升。這些趨勢正在抑制短期柴油需求,並減緩二手備用電源系統市場的成長。
細分市場分析
到2025年,燃氣發電機將佔銷售額的40.2%,這得益於覆蓋77%商業設施的龐大管道網路,以及選擇性催化還原(SCR)技術相比柴油發電成本更低。燃料電池平台雖然目前規模仍然較小,但在企業淨零排放承諾和加州2028年零排放強制令的推動下,其在美國備用電源系統市場規模中的複合年成長率預計到2031年將達到9.6%,這些因素都對氫燃料電池和固體氧化物燃料電池系統的發展起到了獎勵。
對於年運作不到100小時且符合監管最低要求的備用電源應用而言,柴油發電機組仍然經濟實惠,但由於遵守Tier 4排放標準和轉售限制的相關成本,其市場佔有率正在萎縮。鋰離子UPS系統在50 kVA以下的領域佔據主導地位,用於保護關鍵的IT負載,而電池能源儲存系統(BESS)則透過避免需求費用和提供輔助服務來創造收入。柴油和電池結合的混合系統正在軍事基地和偏遠工業設施的微電網中興起,可將燃料消耗降低30-40%,並支撐美國整體備用電源系統市場的發展。
預計到2025年,500-2000 kVA等級的電源將佔據38.5%的市場佔有率,年成長率達5.8%,這充分體現了其對多租戶資料中心和需要N+1冗餘但又不需要過大容量的中型工廠的吸引力。模組化機殼支援以500 kW為增量進行並行運行,從而可根據不斷成長的需求調整容量,同時控制資本投入。
針對超大規模園區,我們提供超過 2000 kVA 的機組,這些機組可透過單一 3-4 MW 單元降低互連複雜性。但由於客製化開關設備的交貨前置作業時間長達 12-18 個月,因此推廣速度緩慢。 50 kVA 以下的機組主要用於住宅和小規模商業辦公場所,其中天然氣規格的機組佔總銷量的 65%,這些機組具有自動切換和無限運作等特點。 50-280 kVA 的機組涵蓋冷凍和生命安全負載,可為零售、飯店和小規模診所提供電力保障,並透過防止食品變質實現 3-5 年的投資回報。這種多樣化的配置組合支撐了美國備用電源系統市場的持續銷售量。
其他好處:
- Excel格式的市場預測(ME)表
- 3個月的分析師支持
目錄
第1章:引言
- 研究假設和市場定義
- 調查範圍
第2章:調查方法
第3章執行摘要
第4章 市場狀況
- 市場概覽
- 市場促進因素
- 資料中心面積擴大
- 大規模停電的頻率和持續時間
- 利用人工智慧擴展生產線
- 關鍵醫療資產的電氣化
- 關於商業建築抗災能力的強制性標準
- 人工智慧驅動的預測性維護平台可以降低整體擁有成本 (TCO)。
- 市場限制因素
- 美國環保署收緊排放上限(第四階段最終版)
- 利率上升推高了大型發電廠的投資成本。
- UPS機房內鋰離子電池的消防安全隱患
- 資本配置轉向現場太陽能發電+儲能系統
- 供應鏈分析
- 監理情勢
- 技術展望
- 波特五力模型
- PESTLE分析
第5章 市場規模與成長預測
- 透過技術
- 柴油發電機
- 瓦斯發電機
- 不斷電系統(UPS)
- 電池能源儲存系統(BESS)
- 混合電源解決方案
- 燃料電池備用系統
- 可攜式電源
- 按類型分類的額定輸出
- 50千伏安或以下
- 50~280 kVA
- 280~500 kVA
- 500~2,000 kVA
- 2000千伏安或以上
- 透過使用
- 備用/緊急電源
- 主電源/持續電源
- 尖峰用電調節與負載管理
- 離網及偏遠地區電力
- 最終用戶
- 住宅
- 商業設施(零售、辦公室、飯店)
- 工業和製造業
- 資料中心和IT
- 醫療機構
- 通訊塔
- 公共產業和能源
- 政府/國防
第6章 競爭情勢
- 市場集中度
- 策略趨勢(併購、聯盟、購電協議)
- 市場佔有率分析(主要公司的市場排名和市場佔有率)
- 公司簡介
- Atlas Copco AB
- Briggs & Stratton Corp.
- Caterpillar Inc.
- Cummins Inc.
- Eaton Corp. PLC
- Emerson Electric Co.
- Generac Holdings Inc.
- General Electric Co.
- Kohler Co.
- Mitsubishi Electric Corp.
- Schneider Electric SE
- Vertiv Group Corp.
- ABB Ltd.
- Tesla Inc.(Powerwall/Powerpack)
- Aggreko Ltd.
- United Rentals Inc.
- Honda Motor Co.(Generators)
- Rolls-Royce Power Systems(MTU)
- Wartsila Corp.
- Doosan Portable Power
第7章 市場機會與未來展望
According to Mordor Intelligence, the United States backup power systems market size was valued at USD 5.53 billion in 2025 and is estimated to grow from USD 5.84 billion in 2026 to reach USD 7.55 billion by 2031, at a CAGR of 5.28% during the forecast period (2026-2031).
This report is Segmented by Technology (Gas Generators, Battery Energy Storage Systems, Fuel-Cell Backup Systems, and More), Power Rating (Up To 50 KVA, 50 To 280 KVA, 280 To 500 KVA, 500 To 2, 000 KVA, and Above 2, 000 KVA), Application (Standby/Emergency Power, Off-Grid and Remote Power, and More), and End-User (Industrial and Manufacturing, Commercial, Data Centers and IT, and More).
United States Backup Power Systems Market Trends and Insights
Increasing Data-Center Footprint
Hyperscale operators commissioned 11 gigawatts of additional white-space in 2025, prompting 23 gigawatts of redundant onsite generation to satisfy N+1 and 2N topologies. Loudoun County added 1.2 gigawatts of diesel and gas sets, straining local air-quality compliance and catalyzing battery-assisted runtime pilots. Power-density escalation toward 50-60 kilowatts per rack now requires backup systems to stabilize voltage in milliseconds, elevating demand for hybrid UPS paired with quick-start gas turbines. Secondary hubs in Oregon and Texas are scaling because of renewable energy access and land availability, yet transmission congestion heightens the strategic value of onsite standby power. Collectively, these deployments embed long-term growth for the United States backup power systems market.
Severe Grid-Outage Frequency and Duration
The System Average Interruption Duration Index for investor-owned utilities rose 15% in 2024, reflecting extreme weather and equipment aging. Hurricane events in Florida and Louisiana during the 2025 season caused outages averaging 72 hours, spurring insurers to mandate backup generation for policy renewal. California logged 38 days of Public Safety Power Shutoffs in 2025, with some circuits de-energized for 200-plus hours, thereby shifting backup economics from rarely used assets to frequently dispatched resources. Ice storms in Vermont and Maine triggered week-long blackouts, leading to state bills that offer tax credits on residential units above 10 kilowatts. The persistent nature of outages embeds backup power procurement into capital budgets across every vertical, reinforcing growth in the United States backup power systems market.
Tightening EPA Emission Caps
Tier 4 Final rules cap particulate matter at 0.03 g/kWh and NOx at 0.4 g/kWh, adding USD 8,000-15,000 per genset for after-treatment hardware. California's Air Resources Board mandates extra filter regeneration cycles, lifting annual maintenance outlays 12-18%. Best Available Control Technology permitting extends diesel project timelines up to nine months in Los Angeles and the San Joaquin Valley, pushing buyers toward natural-gas and propane units that emit 60% less NOx. Secondary markets for used gensets weaken because non-compliant equipment cannot be resold, raising lifecycle costs. This dynamic trims near-term diesel demand, tempering growth for the United States backup power systems market.
Other drivers and restraints analyzed in the detailed report include:
- Growth of AI-Enabled Manufacturing Lines
- Mandatory Resiliency Codes for Commercial Buildings
- Capital-Allocation Shift Toward On-Site PV-Plus-Storage
For complete list of drivers and restraints, kindly check the Table Of Contents.
Segment Analysis
Gas generators captured 40.2% of 2025 revenue, reflecting widespread pipeline coverage to 77% of commercial sites and lower selective catalytic reduction costs compared with diesel. Fuel-cell platforms, although smaller today, are growing at a 9.6% CAGR in the United States backup power systems market size through 2031 because corporate net-zero pledges and California's 2028 zero-emission mandate incentivize hydrogen and solid-oxide systems.
Diesel sets remain economical for code-minimum standby use where annual operation remains below 100 hours, yet Tier 4 compliance outlays and resale limitations are eroding share. Lithium-ion UPS dominates the sub-50 kVA tier that guards sensitive IT loads, while battery energy storage systems monetize demand-charge avoidance and ancillary-services revenue. Hybrid diesel-plus-battery packages are emerging in microgrids for military bases and remote industrial sites, cutting fuel burn by 30-40% and supporting the broader United States backup power systems market.
The 500-2,000 kVA class held 38.5% of the 2025 market and is set to rise 5.8% annually, underscoring its appeal for multi-tenant data halls and mid-sized factories that need N+1 redundancy without oversizing. Modular enclosures allow parallel operation in 500-kW increments, aligning capacity with demand ramps and preserving capital.
Above-2,000 kVA sets serve hyperscale campuses where 3-4 MW singles reduce interconnect complexity, but they face 12-18 month lead times for custom switchgear, tempering uptake. Units up to 50 kVA dominate residential demand and small commercial offices; natural-gas variants command 65% because of automatic transfer and unlimited runtime. The 50-280 kVA cohort protects retail, hospitality, and small clinics by covering refrigeration and life-safety loads, offering a three-to-five-year payback via avoided spoilage. This nuanced mix supports sustained volume in the United States backup power systems market.
Complete Report Scope:
- By Technology
- Diesel Generators
- Gas Generators
- Uninterruptible Power Supply (UPS)
- Battery Energy Storage Systems (BESS)
- Hybrid Power Solutions
- Fuel-Cell Backup Systems
- Portable Power Stations
- By Power Rating
- Up to 50 kVA
- 50 to 280 kVA
- 280 to 500 kVA
- 500 to 2,000 kVA
- Above 2,000 kVA
- By Application
- Standby/Emergency Power
- Prime/Continuous Power
- Peak Shaving and Load Management
- Off-Grid and Remote Power
- By End-User
- Residential
- Commercial (Retail, Offices, Hospitality)
- Industrial and Manufacturing
- Data Centers and IT
- Healthcare Facilities
- Telecom Towers
- Utilities and Energy
- Government and Defence
List of Companies Covered in this Report:
- Atlas Copco AB
- Briggs & Stratton Corp.
- Caterpillar Inc.
- Cummins Inc.
- Eaton Corp. PLC
- Emerson Electric Co.
- Generac Holdings Inc.
- General Electric Co.
- Kohler Co.
- Mitsubishi Electric Corp.
- Schneider Electric SE
- Vertiv Group Corp.
- ABB Ltd.
- Tesla Inc. (Powerwall/Powerpack)
- Aggreko Ltd.
- United Rentals Inc.
- Honda Motor Co. (Generators)
- Rolls-Royce Power Systems (MTU)
- Wartsila Corp.
- Doosan Portable Power
Additional Benefits:
- The market estimate (ME) sheet in Excel format
- 3 months of analyst support
TABLE OF CONTENTS
1 Introduction
- 1.1 Study Assumptions & Market Definition
- 1.2 Scope of the Study
2 Research Methodology
3 Executive Summary
4 Market Landscape
- 4.1 Market Overview
- 4.2 Market Drivers
- 4.2.1 Increasing data-center footprint
- 4.2.2 Severe grid-outage frequency & duration
- 4.2.3 Growth of AI-enabled manufacturing lines
- 4.2.4 Electrification of critical healthcare assets
- 4.2.5 Mandatory resiliency codes for commercial buildings
- 4.2.6 AI-driven predictive-maintenance platforms unlock TCO savings
- 4.3 Market Restraints
- 4.3.1 Tightening EPA emission caps (Tier 4 Final)
- 4.3.2 Rising interest-rates inflate capex for large gensets
- 4.3.3 Lithium-ion fire-safety concerns in UPS rooms
- 4.3.4 Capital-allocation shift toward on-site PV-plus-storage
- 4.4 Supply-Chain Analysis
- 4.5 Regulatory Landscape
- 4.6 Technological Outlook
- 4.7 Porter's Five Forces
- 4.7.1 Threat of New Entrants
- 4.7.2 Bargaining Power of Buyers
- 4.7.3 Bargaining Power of Suppliers
- 4.7.4 Threat of Substitutes
- 4.7.5 Competitive Rivalry
- 4.8 PESTLE Analysis
5 Market Size & Growth Forecasts
- 5.1 By Technology
- 5.1.1 Diesel Generators
- 5.1.2 Gas Generators
- 5.1.3 Uninterruptible Power Supply (UPS)
- 5.1.4 Battery Energy Storage Systems (BESS)
- 5.1.5 Hybrid Power Solutions
- 5.1.6 Fuel-Cell Backup Systems
- 5.1.7 Portable Power Stations
- 5.2 By Power Rating
- 5.2.1 Up to 50 kVA
- 5.2.2 50 to 280 kVA
- 5.2.3 280 to 500 kVA
- 5.2.4 500 to 2,000 kVA
- 5.2.5 Above 2,000 kVA
- 5.3 By Application
- 5.3.1 Standby/Emergency Power
- 5.3.2 Prime/Continuous Power
- 5.3.3 Peak Shaving and Load Management
- 5.3.4 Off-Grid and Remote Power
- 5.4 By End-User
- 5.4.1 Residential
- 5.4.2 Commercial (Retail, Offices, Hospitality)
- 5.4.3 Industrial and Manufacturing
- 5.4.4 Data Centers and IT
- 5.4.5 Healthcare Facilities
- 5.4.6 Telecom Towers
- 5.4.7 Utilities and Energy
- 5.4.8 Government and Defence
6 Competitive Landscape
- 6.1 Market Concentration
- 6.2 Strategic Moves (M&A, Partnerships, PPAs)
- 6.3 Market Share Analysis (Market Rank/Share for key companies)
- 6.4 Company Profiles (includes Global level Overview, Market level overview, Core Segments, Financials as available, Strategic Information, Products & Services, and Recent Developments)
- 6.4.1 Atlas Copco AB
- 6.4.2 Briggs & Stratton Corp.
- 6.4.3 Caterpillar Inc.
- 6.4.4 Cummins Inc.
- 6.4.5 Eaton Corp. PLC
- 6.4.6 Emerson Electric Co.
- 6.4.7 Generac Holdings Inc.
- 6.4.8 General Electric Co.
- 6.4.9 Kohler Co.
- 6.4.10 Mitsubishi Electric Corp.
- 6.4.11 Schneider Electric SE
- 6.4.12 Vertiv Group Corp.
- 6.4.13 ABB Ltd.
- 6.4.14 Tesla Inc. (Powerwall/Powerpack)
- 6.4.15 Aggreko Ltd.
- 6.4.16 United Rentals Inc.
- 6.4.17 Honda Motor Co. (Generators)
- 6.4.18 Rolls-Royce Power Systems (MTU)
- 6.4.19 Wartsila Corp.
- 6.4.20 Doosan Portable Power
7 Market Opportunities & Future Outlook
- 7.1 White-space & Unmet-Need Assessment

 住宅緊急電源市場規模、佔有率和趨勢分析報告:按產品、輸出容量、緊急電源配置、地區和細分市場預測(2026-2033 年)美國住宅緊急電源市場規模、佔有率和趨勢分析報告:按產品、輸出功率、緊急電源配置、地區和細分市場分類(2026-2033 年)
 備用電源系統:市場佔有率分析、產業趨勢與統計、成長預測(2026-2031)
 緊急電源系統市場-2026-2032年全球市場預測
 家用電池備用系統市場規模:按類型、應用、地區和預測分類
 資料中心備用電源市場預測至2034年-按電源類型、輸出容量、資料中心類型、應用、最終用戶和地區分類的全球分析
 備用電源市場:按類型、應用程式、最終用戶和地區分類家用緊急電源市場規模、佔有率和成長率;全球產業分析;按類型、應用和地區分析;以及未來預測(2026-2034 年)。超級電容備用電源系統市場:按技術、額定電壓、外形規格、最終用戶和應用分類,全球預測(2026-2032年)全球資料中心進階備用電源解決方案市場:預測(至 2034 年)—按組件、電源、解決方案類型、功率容量、資料中心類型、最終用戶和地區進行分析