


 |
市場調查報告書
商品編碼
2122169
儲能:市場佔有率分析、產業趨勢與統計、成長預測(2026-2031)Energy Storage - Market Share Analysis, Industry Trends & Statistics, Growth Forecasts (2026 - 2031) |
||||||

※ 本網頁內容可能與最新版本有所差異。詳細情況請與我們聯繫。
根據 Mordor Intelligence 預測,儲能裝置容量將從 2026 年的 0.54兆瓦成長到 2031 年的 1.52兆瓦,在預測期(2026-2031 年)內複合年成長率為 23.05%。
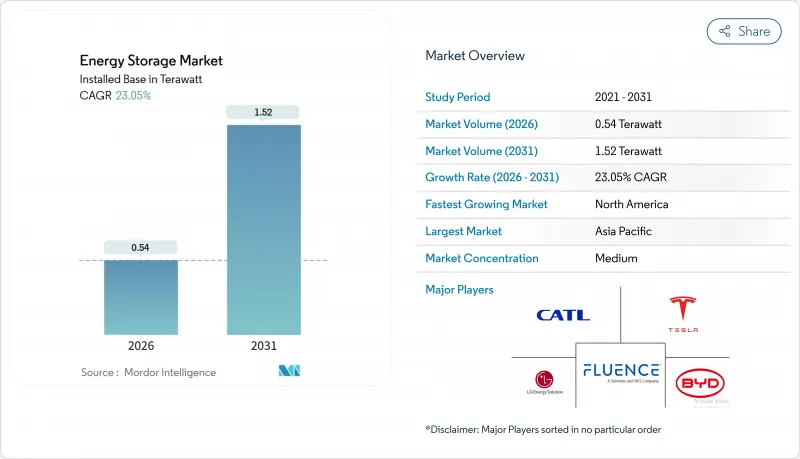
本報告按技術(電池、抽水蓄能水力發電、熱能儲存、壓縮空氣儲能、液態空氣/低溫儲能、飛輪儲能等)、連接類型(併網和離網)、應用(電網級電力企業、住宅後表系統等)和地區(北美、歐洲、亞太、南美、中東和非洲)進行分類。
全球儲能市場趨勢與洞察
磷酸鐵鋰電池成本的快速下降正在推動運行時間達到 6 小時或更長的建築能源管理系統 (BESS) 的普及。
到2025年底,固定式磷酸鐵鋰電池的價格已從上一年的每千瓦時115美元降至每千瓦時70美元。這使得6小時和8小時儲能系統在尖峰時段電價差超過每兆瓦時40美元的地區,與天然氣離峰時段發電相比更具成本效益。寧德時代(CATL)於2025年推出的鈉離子電池為寒冷地區的電力公司提供了一個成本更低的方案,進一步加劇了價格壓力。根據加州參議院第100號法案的目標,加州電力公司於2025年簽署了3.2吉瓦6小時儲能系統的契約,以取代老舊的燃氣渦輪機電廠。德克薩斯州電力可靠性委員會(ERCOT)於2025年投入商業營運了2.1吉瓦的商用儲能系統,旨在利用夏季超過每兆瓦時200美元的電價飆升。與 IEC 62619 安全認證相關的合規成本每千瓦時增加 5 至 8 美元,但由於創收時間從 4 小時延長至 6 小時,利潤率仍然強勁。
電網級獎勵機制(IRA、歐盟RED III、中國強制長期儲能)
美國《通貨膨脹控制法案》(IRA)有效期至2032年,為獨立儲能系統提供30%的投資稅額扣抵(ITC),預計到2025年將調動120億美元的公用事業規模資金籌措,其中以德克薩斯州、亞利桑那州和內華達州的項目為首。歐盟《RED III指令》將於2025年中期納入各國法律,該指令要求成員國確保電網柔軟性資產,以期到2030年將可再生能源佔比提高到42.5%。光是德國就已累計5億歐元(約5.45億美元)用於新增10吉瓦的儲能容量。中國計劃在2027年安裝180吉瓦的長期儲能系統,到2024年底將有73.76吉瓦運作,仍有106吉瓦的缺口,這推動了壓縮空氣儲能、抽水蓄能和氫能項目的開發。
缺乏合適的蓄水庫用地限制了新建抽水蓄能水力發電廠的發展。
在歐洲和日本,地理和環境障礙阻礙了抽水發電工程的擴張,導致2020年至2025年間歐盟新增裝置容量僅為1.2吉瓦,而同期電池儲能裝置容量卻增加了28吉瓦。自然2000計畫對棲地的保護、地震風險區的劃定以及可能長達十年的漫長授權流程,都促使投資者轉向壓縮空氣和氫能等替代技術。在美國,聯邦能源監管委員會(FERC)在2024年至2025年間僅收到12份授權申請,與12年前的40份相比大幅下降。澳洲的雪山2.0計畫預計在2025年將超出預算20億澳元(13億美元),凸顯了隧道挖掘帶來的風險。
細分市場分析
到2025年,電池將佔儲能市場總規模的53.84%,這主要得益於磷酸鋰鐵(LFP)電池出貨量的成長以及鈉離子電池市場佔有率的擴大。同時,由於電力公司尋求100小時的季節性調整後電力供應,預計到2031年,氫能儲存將以38.50%的複合年成長率成長。抽水蓄能、熔鹽儲能槽、壓縮空氣、液態空氣儲能、飛輪儲能及重力儲能系統合計佔市場佔有率的46.16%。儘管續航時間可達數天的技術正在縮小成本差距,但電化學儲能系統預計仍將主導短週期儲能市場。
固體鋰電池仍處於試驗階段,鉛酸電池在通訊和住宅備用電源領域的市佔率正在下降。另一方面,由於電解的不穩定性,液流電池的市場滲透率仍低於3%。儘管三菱電機在猶他州的氫氣儲存洞穴和Highview Power的低溫儲能電站都展現出了商業性可行性,但它們的高資本密集度(超過每千瓦時400美元)限制了其主流應用。然而,隨著規模的擴大,累積成本曲線正趨於一致,預計到2031年後,具有競爭力的長期儲能技術將佔據更大的儲能市場佔有率。
區域分析
到2025年,亞太地區將佔全球整體裝置容量的45.11%,其中中國裝置容量達73.76吉瓦,但隨著政策重點從單純擴大裝置容量轉向提高利用效率,成長速度正在放緩。印度2025年新增的4.2吉瓦裝置容量來自競標。同時,日本和韓國則專注於土地資源有限的市場中的頻率調節這一細分領域。
北美地區引領成長,在「通膨控制法」和各州法規的協同作用下,預計到2031年將以33.47%的複合年成長率成長。在美國,2025年將新增9.4吉瓦太陽能發電裝置容量,其中德克薩斯州和加州將佔近75%,其次是加拿大的亞伯達和安大略省。墨西哥一項1.2吉瓦的太陽能發電和儲能競標仍在接受監管審查,但如果政策進一步明確,則預示著潛在的成長空間。
在歐洲,到2025年,儲能裝置容量將達到5.1吉瓦,這主要得益於德國5億歐元的聯邦撥款計畫以及英國儲能市場一項為期15年的合約。西班牙和法國已將儲能系統納入其可再生能源競標,而北歐國家則將電池能源儲存系統(BESS)整合到其不斷擴展的資料中心叢集中,以實現頻率穩定服務的商業化。中東和非洲地區貢獻了1.6吉瓦的裝置容量,其中阿拉伯聯合大公國和沙烏地阿拉伯主導優先部署了適用於沙漠氣候的熱能和壓縮空氣儲能技術。在南美洲,儲能裝置容量為1.3吉瓦,主要集中在巴西和智利,這顯示以可靠供給能力為前提的競標機制正成為該地區的主要驅動力。
其他好處:
- Excel格式的市場預測(ME)表
- 3個月的分析師支持
目錄
第1章:引言
- 研究假設和市場定義
- 調查範圍
第2章:調查方法
第3章執行摘要
第4章 市場狀況
- 市場概覽
- 市場促進因素
- 磷酸鐵鋰電池成本的快速下降正在加速運行時間達到 6 小時或更長的 BESS(建築節能系統)的部署(亞太地區)。
- 應強制實施電網級獎勵機制(美國IRA、歐盟RED III、中國)。
- 海灣合作理事會的可再生能源部署目標正在推動火力發電和壓縮空氣儲能的發展。
- 資料中心對更高電力品質的需求推動了對飛輪和電池儲能系統(BESS)的需求(北美、北歐國家)。
- 隨著電動車充電走廊的發展,固定式儲能設備的必要性日益凸顯。
- 企業購電協議 (PPA) 的激增正在推動電錶後儲能的發展(歐盟、澳洲)。
- 市場限制因素
- 缺乏合適的蓄水池用地阻礙了新的抽水蓄能水力發電廠的擴張(歐盟、日本)。
- 釩鋅電解供應的波動阻礙了液流電池的規模化生產。
- 嚴格的消防安全標準(NFPA 855、IEC 62933)正在推高都市區)。
- 新興市場收入累積的不確定性
- 供應鏈分析
- 政府政策和法規
- 技術展望
- 儲能價格趨勢及預測
- 已部署容量和部署狀態分析
- 波特五力模型
第5章 市場規模與成長預測
- 透過技術
- 電池(鋰離子電池、固體鋰離子電池、鈉離子電池、鉛酸電池、鈉硫電池和液流電池(釩液流電池、鋅溴液流電池))
- 抽水蓄能水力發電
- 熱能儲存(顯熱(熔鹽、水)、潛熱(相變材料)、熱化學)
- 壓縮空氣儲能
- 液態空氣/低溫儲存
- 飛輪儲能
- 重力儲存
- 氫能儲存(電轉氫再電能)
- 其他新興技術(鐵空氣複合技術、鋅空氣複合技術)
- 按連線類型
- 併網
- 離網
- 透過使用
- 對於電網級電力公司(電錶前)
- 住宅用途(電錶內)
- 商業和工業用途(計量後)
- 資料中心和關鍵設施
- 偏遠及離網/微電網地區
- 其他(交通運輸和鐵路電氣化、電動車充電基礎設施、電力傳輸和分配延遲)
- 按地區
- 北美洲
- 美國
- 加拿大
- 墨西哥
- 歐洲
- 英國
- 德國
- 法國
- 西班牙
- 北歐國家
- 俄羅斯
- 其他歐洲國家
- 亞太地區
- 中國
- 印度
- 日本
- 韓國
- 東南亞國協
- 其他亞太國家
- 南美洲
- 巴西
- 阿根廷
- 哥倫比亞
- 其他南美國家
- 中東和非洲
- 阿拉伯聯合大公國
- 沙烏地阿拉伯
- 南非
- 埃及
- 其他中東和非洲國家
- 北美洲
第6章 競爭情勢
- 市場集中度
- 策略趨勢(併購、聯盟、購電協議)
- 市場佔有率分析(主要公司的市場排名和佔有率)
- 公司簡介
- Contemporary Amperex Technology Co. Ltd.(CATL)
- LG Energy Solution Ltd.
- Tesla Inc.
- BYD Co. Ltd.
- Fluence Energy Inc.
- Wartsila Energy
- Siemens Gamesa Renewable Energy
- GS Yuasa Corporation
- NGK Insulators Ltd.
- Samsung SDI Co. Ltd.
- General Electric(Vernova)
- ABB Ltd.
- Hitachi Energy Ltd.
- Eaton Corporation
- Mitsubishi Power Americas|
- AES Corporation
- Voith Hydro GmbH
- ANDRITZ AG
- Hydrostor Inc.
- Highview Powe
- Amber Kinetics Inc
第7章 市場機會與未來展望
According to Mordor Intelligence, the energy storage market size in terms of installed base is expected to grow from 0.54 Terawatt in 2026 to 1.52 Terawatt by 2031, at a CAGR of 23.05% during the forecast period (2026-2031).
This report is Segmented by Technology (Batteries, Pumped-Storage Hydroelectricity, Thermal Energy Storage, Compressed Air Energy Storage, Liquid Air/Cryogenic Storage, Flywheel Energy Storage, and More), Connectivity (On-Grid and Off-Grid), Application (Grid-Scale Utility, Residential Behind-The-Meter, and More), and Geography (North America, Europe, Asia-Pacific, South America, and Middle East and Africa).
Global Energy Storage Market Trends and Insights
Rapid LFP Battery Cost Declines Driving above 6-Hour BESS Adoption
Stationary-grade lithium-iron-phosphate cell prices slid to USD 70 per kWh in late 2025, down from USD 115 a year earlier, enabling six-hour and eight-hour installations to beat natural-gas peakers wherever peak-to-off-peak spreads exceed USD 40 per MWh. CATL's commercial launch of sodium-ion cells in 2025 added extra price pressure by offering utilities a lower-cost option for cold-weather regions. California utilities awarded 3.2 GW of six-hour contracts during 2025 to replace retiring gas turbines under Senate Bill 100 targets. Texas ERCOT saw 2.1 GW of merchant storage reach COD in 2025, aimed at exploiting summer price spikes that crest above USD 200 per MWh. Compliance costs tied to IEC 62619 safety certification add USD 5-8 per kWh, yet margins remain robust because the revenue window has widened from four to six hours.
Grid-Scale Incentive Schemes (IRA, EU RED III, China Long-Duration Mandate)
The U.S. Inflation Reduction Act's 30% standalone storage ITC, in force through 2032, unlocked USD 12 billion of utility-scale financing in 2025, led by projects in Texas, Arizona, and Nevada. Europe's RED III directive, transposed into national law by mid-2025, obliges member states to secure grid-flexibility assets to reach a 42.5% renewables share by 2030; Germany alone earmarked EUR 500 million (USD 545 million) for a 10 GW build-out. China mandated 180 GW of long-duration storage by 2027 and had 73.76 GW online at end-2024, leaving a 106 GW gap that is propelling compressed-air, pumped-hydro, and hydrogen projects.
Scarcity of Suitable Reservoir Sites Limiting New Pumped Hydro
Europe and Japan face topographical and environmental hurdles that curtail new pumped-hydro projects, holding additions to just 1.2 GW across the EU between 2020 and 2025, while batteries added 28 GW. Natura 2000 habitat protections, seismic risk zoning, and decade-long permitting cycles are steering investors toward compressed-air and hydrogen alternatives. In the U.S., the Federal Energy Regulatory Commission received only 12 license applications during 2024-2025 versus 40 twelve years earlier. Australia's Snowy 2.0 overrun of AUD 2 billion (USD 1.3 billion) in 2025 underscored tunneling risks.
Other drivers and restraints analyzed in the detailed report include:
- Mandatory GCC Renewable-Integration Targets Boosting Thermal & CAES
- Data-Center Power-Quality Demands Spurring Flywheel & BESS
- Vanadium/Zinc Electrolyte Supply Volatility Hindering Flow-Battery Scale-Up
For complete list of drivers and restraints, kindly check the Table Of Contents.
Segment Analysis
Batteries accounted for 53.84% of the 2025 energy storage market size, anchored by LFP and growing sodium-ion volumes, while hydrogen storage is forecast to expand at a 38.50% CAGR through 2031 as utilities seek 100-hour seasonal balancing resources. Pumped hydro, thermal molten-salt tanks, compressed-air, liquid-air, flywheel, and gravity systems collectively held a 46.16% share, positioning electrochemical providers to dominate short-cycle revenues even as multi-day technologies close the cost gap.
Solid-state lithium remains confined to pilot lines, lead-acid is losing share in telecom and residential backup, and flow batteries languish below 3% market penetration because of electrolyte volatility. Mitsubishi Power's Utah hydrogen cavern and Highview Power's cryogenic plant showcase commercial viability, but capital intensity above USD 400 per kWh limits mainstream uptake. Nonetheless, cumulative cost curves are converging as scale-up proceeds, suggesting long-duration challengers will secure greater energy storage market share beyond 2031.
Complete Report Scope:
- By Technology
- Batteries (Lithium-ion, Solid-State Li, Sodium-ion, Lead-acid, Sodium-Sulfur, and Flow Batteries (Vanadium, Zinc-Bromine))
- Pumped-Storage Hydroelectricity
- Thermal Energy Storage (Sensible Heat (Molten Salt, Water), Latent Heat (Phase-Change Materials), Thermochemical)
- Compressed Air Energy Storage
- Liquid Air/Cryogenic Storage
- Flywheel Energy Storage
- Gravity-Based Storage
- Hydrogen-Based Storage (Power-to-H2-to-Power)
- Other Emerging Technologies (Iron-Air, Zinc-Air)
- By Connectivity
- On-Grid
- Off-Grid
- By Application
- Grid-Scale Utility (Front-of-Meter)
- Residential Behind-the-Meter
- Commercial and Industrial Behind-the-Meter
- Data Centers and Critical Facilities
- Remote and Off-Grid/Microgrids
- Others (Transportation and Rail Electrification, EV-Charging Infrastructure, Transmission and Distribution Deferral)
- By Geography
- North America
- United States
- Canada
- Mexico
- Europe
- United Kingdom
- Germany
- France
- Spain
- Nordic Countries
- Russia
- Rest of Europe
- Asia-Pacific
- China
- India
- Japan
- South Korea
- ASEAN Countries
- Rest of Asia-Pacific
- South America
- Brazil
- Argentina
- Colombia
- Rest of South America
- Middle East and Africa
- United Arab Emirates
- Saudi Arabia
- South Africa
- Egypt
- Rest of Middle East and Africa
- North America
Geography Analysis
Asia-Pacific possessed 45.11% of global capacity in 2025 owing to China's 73.76 GW installed base, yet growth is moderating as policy emphasis migrates from pure capacity to utilization efficiency. India's 4.2 GW of 2025 additions stemmed from tenders that bundled eight GW of solar with two GW of four-hour storage, while Japan and South Korea focused on frequency-regulation niches within land-constrained markets.
North America is the velocity leader, forecast to advance at a 33.47% CAGR through 2031 as the Inflation Reduction Act and state mandates converge. The United States added 9.4 GW in 2025, with Texas and California accounting for nearly 75% of that total, and Canada's Alberta and Ontario provinces following suit. Mexico's 1.2 GW solar-plus-storage tender remains in regulatory review, signaling latent upside once policy clarity improves.
Europe installed 5.1 GW in 2025, spurred by Germany's EUR 500 million federal grant program and the UK capacity market's 15-year contracts. Spain and France integrated storage into renewable auctions, and Nordic countries embedded BESS in expanding data-center clusters to monetize frequency-containment services. The Middle East and Africa contributed 1.6 GW, with the UAE and Saudi Arabia leading deployments that favor thermal and compressed-air chemistries suited for desert climates. South America's 1.3 GW, mostly in Brazil and Chile, shows that auction frameworks contingent on firm capacity are becoming the region's primary accelerator.
- Contemporary Amperex Technology Co. Ltd. (CATL)
- LG Energy Solution Ltd.
- Tesla Inc.
- BYD Co. Ltd.
- Fluence Energy Inc.
- Wartsila Energy
- Siemens Gamesa Renewable Energy
- GS Yuasa Corporation
- NGK Insulators Ltd.
- Samsung SDI Co. Ltd.
- General Electric (Vernova)
- ABB Ltd.
- Hitachi Energy Ltd.
- Eaton Corporation
- Mitsubishi Power Americas
- AES Corporation
- Voith Hydro GmbH
- ANDRITZ AG
- Hydrostor Inc.
- Highview Powe
- Amber Kinetics Inc
Additional Benefits:
- The market estimate (ME) sheet in Excel format
- 3 months of analyst support
TABLE OF CONTENTS
1 Introduction
- 1.1 Study Assumptions & Market Definition
- 1.2 Scope of the Report
2 Research Methodology
3 Executive Summary
4 Market Landscape
- 4.1 Market Overview
- 4.2 Market Drivers
- 4.2.1 Rapid LFP Battery Cost Declines Driving >6-Hour BESS Adoption (Asia-Pacific)
- 4.2.2 Grid-Scale Incentive Schemes (IRA-US, EU RED III, China) Long-Duration Mandate
- 4.2.3 Mandatory GCC Renewable-Integration Targets Boosting Thermal & CAES
- 4.2.4 Data-Center Power-Quality Demands Spurring Flywheel & BESS (NA, Nordics)
- 4.2.5 EV-Charging Corridor Build-outs Requiring Stationary Storage
- 4.2.6 Corporate PPA Surge Triggering Behind-the-Meter Storage (EU, AUS)
- 4.3 Market Restraints
- 4.3.1 Scarcity of Suitable Reservoir Sites Limiting New Pumped Hydro (EU, JP)
- 4.3.2 Vanadium/Zinc Electrolyte Supply Volatility Hindering Flow-Battery Scale-up
- 4.3.3 Stringent Fire Codes (NFPA 855, IEC 62933) Raising Urban BESS CAPEX
- 4.3.4 Revenue-Stacking Uncertainty in Emerging Markets
- 4.4 Supply-Chain Analysis
- 4.5 Government Policies & Regulations
- 4.6 Technological Outlook
- 4.7 Energy Storage Price Trends & Forecast
- 4.8 Installed Capacity & Deployment Analysis
- 4.9 Porter's Five Forces
- 4.9.1 Bargaining Power of Suppliers
- 4.9.2 Bargaining Power of Buyers
- 4.9.3 Threat of New Entrants
- 4.9.4 Threat of Substitutes
- 4.9.5 Intensity of Competitive Rivalry
5 Market Size & Growth Forecasts
- 5.1 By Technology
- 5.1.1 Batteries (Lithium-ion, Solid-State Li, Sodium-ion, Lead-acid, Sodium-Sulfur, and Flow Batteries (Vanadium, Zinc-Bromine))
- 5.1.2 Pumped-Storage Hydroelectricity
- 5.1.3 Thermal Energy Storage (Sensible Heat (Molten Salt, Water), Latent Heat (Phase-Change Materials), Thermochemical)
- 5.1.4 Compressed Air Energy Storage
- 5.1.5 Liquid Air/Cryogenic Storage
- 5.1.6 Flywheel Energy Storage
- 5.1.7 Gravity-Based Storage
- 5.1.8 Hydrogen-Based Storage (Power-to-H2-to-Power)
- 5.1.9 Other Emerging Technologies (Iron-Air, Zinc-Air)
- 5.2 By Connectivity
- 5.2.1 On-Grid
- 5.2.2 Off-Grid
- 5.3 By Application
- 5.3.1 Grid-Scale Utility (Front-of-Meter)
- 5.3.2 Residential Behind-the-Meter
- 5.3.3 Commercial and Industrial Behind-the-Meter
- 5.3.4 Data Centers and Critical Facilities
- 5.3.5 Remote and Off-Grid/Microgrids
- 5.3.6 Others (Transportation and Rail Electrification, EV-Charging Infrastructure, Transmission and Distribution Deferral)
- 5.4 By Geography
- 5.4.1 North America
- 5.4.1.1 United States
- 5.4.1.2 Canada
- 5.4.1.3 Mexico
- 5.4.2 Europe
- 5.4.2.1 United Kingdom
- 5.4.2.2 Germany
- 5.4.2.3 France
- 5.4.2.4 Spain
- 5.4.2.5 Nordic Countries
- 5.4.2.6 Russia
- 5.4.2.7 Rest of Europe
- 5.4.3 Asia-Pacific
- 5.4.3.1 China
- 5.4.3.2 India
- 5.4.3.3 Japan
- 5.4.3.4 South Korea
- 5.4.3.5 ASEAN Countries
- 5.4.3.6 Rest of Asia-Pacific
- 5.4.4 South America
- 5.4.4.1 Brazil
- 5.4.4.2 Argentina
- 5.4.4.3 Colombia
- 5.4.4.4 Rest of South America
- 5.4.5 Middle East and Africa
- 5.4.5.1 United Arab Emirates
- 5.4.5.2 Saudi Arabia
- 5.4.5.3 South Africa
- 5.4.5.4 Egypt
- 5.4.5.5 Rest of Middle East and Africa
- 5.4.1 North America
6 Competitive Landscape
- 6.1 Market Concentration
- 6.2 Strategic Moves (M&A, Partnerships, PPAs)
- 6.3 Market Share Analysis (Market Rank/Share for key companies)
- 6.4 Company Profiles (includes Global level Overview, Market level overview, Core Segments, Financials as available, Strategic Information, Products & Services, and Recent Developments)
- 6.4.1 Contemporary Amperex Technology Co. Ltd. (CATL)
- 6.4.2 LG Energy Solution Ltd.
- 6.4.3 Tesla Inc.
- 6.4.4 BYD Co. Ltd.
- 6.4.5 Fluence Energy Inc.
- 6.4.6 Wartsila Energy
- 6.4.7 Siemens Gamesa Renewable Energy
- 6.4.8 GS Yuasa Corporation
- 6.4.9 NGK Insulators Ltd.
- 6.4.10 Samsung SDI Co. Ltd.
- 6.4.11 General Electric (Vernova)
- 6.4.12 ABB Ltd.
- 6.4.13 Hitachi Energy Ltd.
- 6.4.14 Eaton Corporation
- 6.4.15 Mitsubishi Power Americas
- 6.4.16 AES Corporation
- 6.4.17 Voith Hydro GmbH
- 6.4.18 ANDRITZ AG
- 6.4.19 Hydrostor Inc.
- 6.4.20 Highview Powe
- 6.4.21 Amber Kinetics Inc
7 Market Opportunities & Future Outlook
- 7.1 White-space & Unmet-Need Assessment

 儲能市場:2026-2032年全球市場預測(按技術、持續時間、額定功率、併網方式、冷卻方式、應用和最終用戶分類)
 2026年全球儲能市場報告
 冰儲能市場預測—全球儲能容量、技術、應用、最終用戶與區域分析—2034年熱量儲能市場預測—按儲能容量、技術、應用、最終用戶和地區分類的全球分析—2034年電錶後端儲能系統市場預測——按所有權/營運模式、發電容量範圍、技術、應用、最終用戶和地區分類的全球分析——2034年
 商業和工業儲能:市場佔有率分析、行業趨勢和統計數據以及成長預測(2026-2031 年)東協儲能市場:市場佔有率分析、產業趨勢與統計及成長預測(2026-2031年)美國儲能:市場佔有率分析、產業趨勢與統計及成長預測(2026-2031 年)
 儲能轉捩點(2026年):AIDC透過「雙引擎」方式推動需求擴張
 高容量電池市場-全球產業規模、佔有率、趨勢、機會、預測:按類型、應用、最終用戶、地區和競爭格局分類,2021-2031年