


 |
市場調查報告書
商品編碼
2121877
矽酸鈉:市場佔有率分析、產業趨勢與統計、成長預測(2026-2031)Sodium Silicate - Market Share Analysis, Industry Trends & Statistics, Growth Forecasts (2026 - 2031) |
||||||

※ 本網頁內容可能與最新版本有所差異。詳細情況請與我們聯繫。
根據 Mordor Intelligence 預測,矽酸鈉市場規模將從 2025 年的 839 萬噸成長到 2026 年的 879 萬噸,然後在 2031 年達到 1,112 萬噸,2026 年至 2031 年的複合年成長率為 4.8%。
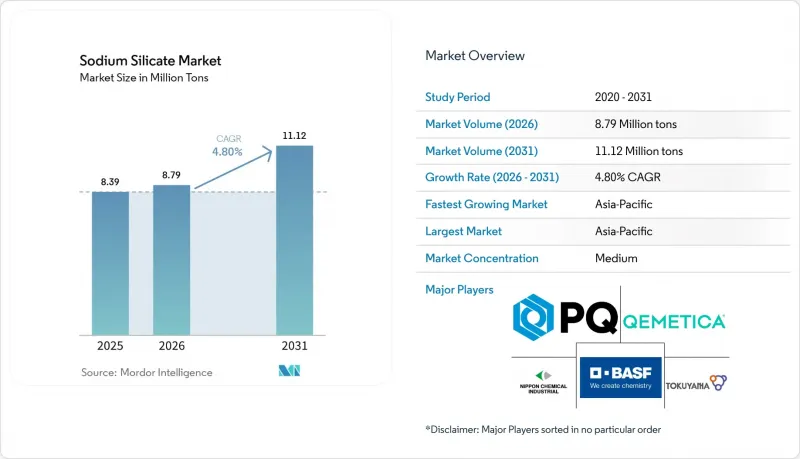
本報告按類型(固體和液體)、應用(黏合劑和塗料、清潔劑、食品保鮮、沉澱二氧化矽、造紙和紙漿、水處理及其他應用)和地區(亞太地區、北美地區、歐洲地區、南美地區以及中東和非洲地區)進行細分。市場預測以噸為單位。
全球矽酸鈉市場趨勢及洞察
再生紙的需求不斷成長
政府法規強制要求提高包裝材料中的再生材料含量,加速了矽酸鈉在浮選和脫墨製程的應用。現代造紙廠每生產一噸再生紙,需要消耗8-12公斤矽酸鈉。這種化學物質可以控制鹼度,防止油墨顆粒重新聚集,使印刷商能夠滿足嚴格的白度和潔淨度標準。減少塑膠的使用增加了對纖維的需求,尤其是在歐洲,那裡的「一次性塑膠指令」迫使加工商轉向紙基產品,進一步推高了纖維的需求。能夠提供具有穩定pH緩衝性能的纖維等級的供應商已與Integrated Paper Group簽訂了長期合約。
「綠色」輪胎中沉澱二氧化矽的使用量增加
每生產一噸沉澱二氧化矽大約需要1.3噸矽酸鈉原料。由於輪胎製造商需要降低滾動阻力以滿足不斷變化的燃油標籤規例,這直接刺激了市場需求。高純度、矽鈉比窄的矽酸鈉價格高昂,因為它們能夠生產比表面積和孔隙率可控的二氧化矽,而這些參數對於下一代電動車輪胎至關重要。東南亞地區產能的提升進一步推高了該地區的需求。
高鹼性矽酸鹽的健康和安全風險
監管機構已將高濃度矽酸鈉列為腐蝕性物質,導致職場接觸限值更加嚴格,個人防護設備的要求也更高。中小用戶面臨更高的合規成本,這可能會減緩價格敏感型產業(例如製程鑄造廠和小規模清潔劑製造商)的採用速度。同時,已實施先進封閉回路型加工系統和遠端監控的大型製造商在確保營運安全的同時,也維護了下游客戶的信任。
細分市場分析
預計到2025年,液態矽酸鈉產品將佔矽酸鈉市場68.39%的佔有率,並將以5.05%的複合年成長率持續成長至2031年。水處理廠的自動化供水系統傾向於使用液態產品,因為液態產品可以消除溶解延遲,並實現更精確的劑量控制。 50°波美度濃縮產品的技術創新在保持反應活性的同時,降低了25%的運輸成本,這一優勢深受出口型清潔劑生產商的青睞。在保存期限、遠端儲存或超高鹼度至關重要的場合,固態珠粒和粉狀產品仍然十分重要,但隨著液態產品憑藉其卓越的物流效率逐步擴大市場佔有率,二者之間的價值差距正在縮小。
製造商正利用薄膜過濾技術來微調液態二氧化矽中的二氧化矽與鈉的比例,從而獲得性能最佳化的中間體,用於高純度沉澱二氧化矽和特種黏合劑的應用。這種機械密集型生產方式構成了技術進入門檻,尤其是在公共產業和技術純熟勞工匱乏的地區。豐富的液態產品組合解釋了為什麼一體化供應商能夠保持更高的EBITDA獲利率,並與跨國快速消費品 (FMCG) 公司簽訂長期供應合約。
區域分析
到2025年,亞太地區將佔全球消費量的42.12%,佔最大佔有率。中國國內生產商,包括位於太倉新諾的年產30萬噸工廠等,正在整合從堿灰到固體和液態矽酸鹽的後向整合,以支持對東南亞的出口。在印度清潔劑產業,採用液態矽酸鹽計量控制的噴霧乾燥塔正在加速應用;而在澳大利亞,政府資助的交通基礎設施計畫正在推廣早期採用無機聚合物水泥。
北美地區的需求受益於聯邦政府對水利基礎設施維修的支出,其中強制使用矽酸鹽腐蝕抑制劑。頁岩盆地作業者使用矽酸鈉作為鑽井液添加劑來穩定黏土層,儘管鑽機總數有所波動,但該地區的需求仍穩定。對高品質電子級矽酸鈉的需求集中在西海岸半導體產業集群,該地區高純度矽酸鈉用於生產耐刮擦玻璃。
在歐洲,品質重於數量的理念依然盛行。儘管《水框架指令》下更嚴格的廢水法規增加了合規成本,但對於擁有封閉回路型水循環系統的生產商而言,這些法規卻帶來了優勢。產業重組趨勢,例如Qemetica於2024年11月收購PPG的二氧化矽資產,正在收緊沉澱二氧化矽價值鏈的供應,而沉澱二氧化矽主要供應給區域輪胎產業。此外,對用於封閉回路型玻璃回收再生用的化學品的需求也進一步支撐了供應的穩定性。
其他好處:
- Excel格式的市場預測(ME)表
- 3個月的分析師支持
目錄
第1章:引言
- 研究假設和市場定義
- 調查範圍
第2章:調查方法
第3章執行摘要
第4章 市場狀況
- 市場概覽
- 市場促進因素
- 再生紙的需求不斷成長
- 「綠色」輪胎中沉澱二氧化矽的使用量增加
- 低收入國家粉狀清潔劑的成長
- 無機聚合物水泥的快速工業化應用
- 促進循環經濟,實現玻璃回收閉合迴路
- 市場限制因素
- 高鹼矽酸鹽的健康和安全風險
- 堿灰價格波動
- 歐盟對矽酸鹽溶液的廢水排放標準日益嚴格。
- 生物基黏合劑在鑄造芯材領域的競爭
- 價值鏈分析
- 波特五力分析
第5章 市場規模與成長預測
- 按類型
- 固體的
- 液體
- 透過使用
- 黏合劑和油漆
- 清潔劑
- 食品保藏
- 沉澱的二氧化矽
- 紙漿和紙漿
- 水處理
- 其他用途
- 按地區
- 亞太地區
- 中國
- 印度
- 日本
- 韓國
- 其他亞太國家
- 北美洲
- 美國
- 加拿大
- 墨西哥
- 歐洲
- 德國
- 英國
- 義大利
- 法國
- 其他歐洲國家
- 南美洲
- 巴西
- 阿根廷
- 其他南美國家
- 中東和非洲
- 沙烏地阿拉伯
- 南非
- 其他中東和非洲國家
- 亞太地區
第6章 競爭情勢
- 市場集中度
- 策略趨勢
- 市佔率和排名分析
- 公司簡介
- Alumina doo Zvornik
- BASF
- C Thai Group
- QEMETICA
- Evonik Industries
- Gujarat Multi Gas Base Chemicals Pvt Ltd
- Hindcon Chemicals Ltd.
- Kiran Global Chem Ltd.
- Nippon Chemical Industrial Co. Ltd.
- Nouryon
- Occidental Petroleum Corporation
- PQ Corporation
- Silmaco
- Tokuyama Corporation
- WR Grace & Co.-Conn.
第7章 市場機會與未來展望
According to Mordor Intelligence, the sodium silicate market size is expected to grow from 8.39 million tons in 2025 to 8.79 million tons in 2026 and is forecast to reach 11.12 million tons by 2031 at 4.8% CAGR over 2026-2031.
This report is Segmented by Type (Solid and Liquid), Application (Adhesives and Paints, Detergents, Food Preservation, Precipitated Silica, Paper and Pulp, Water Treatment, and Other Applications), and Geography (Asia-Pacific, North America, Europe, South America, and Middle East and Africa). The Market Forecasts are Provided in Terms of Volume (Tons).
Global Sodium Silicate Market Trends and Insights
Mounting Demand for Waste-Paper Recycling
Government mandates for higher recycled-content packaging accelerate the use of sodium silicate in flotation deinking processes. Modern mills consume 8-12 kg of sodium silicate per ton of recovered paper, and the chemical's alkalinity control prevents ink particle re-agglomeration, allowing printers to meet exacting brightness and cleanliness standards. Demand intensifies as plastic substitution drives an additional fiber requirement, especially in Europe, where the Single-Use Plastics Directive prompts converters to shift toward paper-based formats. Suppliers able to deliver consistent pH buffering grades secure long-term contracts with integrated paper groups.
Rising Usage of Precipitated Silica in "Green" Tires
Each ton of precipitated silica requires roughly 1.3 tons of sodium silicate feedstock, creating a direct pull-through effect as tire makers lower rolling resistance to meet evolving fuel-economy labeling rules. High-purity sodium silicate grades with narrow silica-to-soda ratios command premium prices because they yield silica with controlled surface area and porosity-critical parameters for next-generation electric vehicle tires. Capacity additions in Southeast Asia reinforce regional demand momentum.
Health and Safety Hazards of High-Alkali Silicates
Regulators classify concentrated sodium silicate as corrosive, prompting stricter workplace exposure limits and tighter personal protective equipment mandates. Small and mid-size users face higher compliance costs, which can delay adoption in price-sensitive industries such as craft foundries and micro-scale detergent blenders. Large producers that embed advanced closed-loop handling systems and remote monitoring safeguard operations and credibility with downstream customers.
Other drivers and restraints analyzed in the detailed report include:
- Growth of Powder Detergents in Low-Income Economies
- Rapid Industrial-Scale Uptake of Geopolymer Cement
- Volatility in Soda-Ash Prices
For complete list of drivers and restraints, kindly check the Table Of Contents.
Segment Analysis
Liquid products controlled 68.39% of the sodium silicate market in 2025 and are projected to expand at a 5.05% CAGR through 2031. Automated feed systems in water-treatment plants favor liquid chemistry because they eliminate dissolution lag and enable tighter dosage control. Concentrated 50° Baume innovations deliver 25% freight savings while preserving reactivity, a benefit that resonates with export-oriented detergent makers. Solid beads and powder forms retain relevance where shelf life, remote storage, or ultrahigh alkalinity are paramount, yet the value gap narrows as logistics-optimized liquids capture incremental territory.
Manufacturers utilize membrane filtration to fine-tune silica-to-soda ratios in liquid grades, resulting in performance-tailored intermediates for high-purity precipitated silica and specialty adhesive applications. This machinery-intensive capability creates technological barriers to entry, particularly in regions where utilities and skilled labor are scarce. Portfolio breadth in liquids explains why integrated suppliers sustain higher EBITDA margins and secure long-term supply agreements with multinational fast-moving consumer goods companies.
Complete Report Scope:
- By Type
- Solid
- Liquid
- By Application
- Adhesives and Paints
- Detergents
- Food Preservation
- Precipitated Silica
- Paper and Pulp
- Water Treatment
- Other Applications
- By Geography
- Asia-Pacific
- China
- India
- Japan
- South Korea
- Rest of Asia-Pacific
- North America
- United States
- Canada
- Mexico
- Europe
- Germany
- United Kingdom
- Italy
- France
- Rest of Europe
- South America
- Brazil
- Argentina
- Rest of South America
- Middle East and Africa
- Saudi Arabia
- South Africa
- Rest of Middle East and Africa
- Asia-Pacific
Geography Analysis
The Asia-Pacific region accounts for the largest share of global consumption at 42.12% in 2025. Domestic producers in China, including facilities such as Taicang Sinoch's 300,000-ton plant, back-integrate from soda ash to solid and liquid silicates, supporting exports across Southeast Asia. India's detergent industry accelerates the installation of spray-drying towers that rely on liquid silicate dosing control, while Australia fosters the early adoption of geopolymer cement in government-funded transport projects.
North American demand benefits from federal spending on water infrastructure upgrades that specify silicate-based corrosion inhibitors. Shale-basin operators use sodium silicate as a drilling fluid additive that stabilizes clay formations, keeping regional offtake stable even when overall rig counts fluctuate. Premium electronics-grade volumes cluster along the West Coast semiconductor corridor, where high-purity grades support the fabrication of scratch-free glass.
Europe maintains a quality-over-quantity orientation. Stricter effluent discharge rules under the Water Framework Directive increase compliance costs but also favor producers equipped with closed-loop water recycling systems. Consolidation trends, such as Qemetica's November 2024 acquisition of PPG's silica assets, tighten supply in precipitated-silica value chains that primarily feed the regional tire industry. Demand for closed-loop glass recycling chemicals further anchors volume stability.
- Alumina doo Zvornik
- BASF
- C Thai Group
- QEMETICA
- Evonik Industries
- Gujarat Multi Gas Base Chemicals Pvt Ltd
- Hindcon Chemicals Ltd.
- Kiran Global Chem Ltd.
- Nippon Chemical Industrial Co. Ltd.
- Nouryon
- Occidental Petroleum Corporation
- PQ Corporation
- Silmaco
- Tokuyama Corporation
- W. R. Grace & Co.-Conn.
Additional Benefits:
- The market estimate (ME) sheet in Excel format
- 3 months of analyst support
TABLE OF CONTENTS
1 Introduction
- 1.1 Study Assumptions and Market Definition
- 1.2 Scope of the Study
2 Research Methodology
3 Executive Summary
4 Market Landscape
- 4.1 Market Overview
- 4.2 Market Drivers
- 4.2.1 Mounting demand for waste-paper recycling
- 4.2.2 Rising usage of precipitated silica in "green" tyres
- 4.2.3 Growth of powder detergents in low-income economies
- 4.2.4 Rapid industrial-scale uptake of geopolymer cement
- 4.2.5 Circular-economy push for closed-loop glass recycling
- 4.3 Market Restraints
- 4.3.1 Health and safety hazards of high-alkali silicates
- 4.3.2 Volatility in soda-ash prices
- 4.3.3 Tightening EU effluent-discharge limits on silicate liquor
- 4.3.4 Competitive threat from bio-based binders in foundry cores
- 4.4 Value Chain Analysis
- 4.5 Porter's Five Forces Analysis
- 4.5.1 Bargaining Power of Suppliers
- 4.5.2 Bargaining Power of Buyers
- 4.5.3 Threat of New Entrants
- 4.5.4 Threat of Substitutes
- 4.5.5 Degree of Competition
5 Market Size and Growth Forecasts (Volume)
- 5.1 By Type
- 5.1.1 Solid
- 5.1.2 Liquid
- 5.2 By Application
- 5.2.1 Adhesives and Paints
- 5.2.2 Detergents
- 5.2.3 Food Preservation
- 5.2.4 Precipitated Silica
- 5.2.5 Paper and Pulp
- 5.2.6 Water Treatment
- 5.2.7 Other Applications
- 5.3 By Geography
- 5.3.1 Asia-Pacific
- 5.3.1.1 China
- 5.3.1.2 India
- 5.3.1.3 Japan
- 5.3.1.4 South Korea
- 5.3.1.5 Rest of Asia-Pacific
- 5.3.2 North America
- 5.3.2.1 United States
- 5.3.2.2 Canada
- 5.3.2.3 Mexico
- 5.3.3 Europe
- 5.3.3.1 Germany
- 5.3.3.2 United Kingdom
- 5.3.3.3 Italy
- 5.3.3.4 France
- 5.3.3.5 Rest of Europe
- 5.3.4 South America
- 5.3.4.1 Brazil
- 5.3.4.2 Argentina
- 5.3.4.3 Rest of South America
- 5.3.5 Middle East and Africa
- 5.3.5.1 Saudi Arabia
- 5.3.5.2 South Africa
- 5.3.5.3 Rest of Middle East and Africa
- 5.3.1 Asia-Pacific
6 Competitive Landscape
- 6.1 Market Concentration
- 6.2 Strategic Moves
- 6.3 Market Share (%)/Ranking Analysis
- 6.4 Company Profiles (includes Global Level Overview, Market Level Overview, Core Segments, Financials as available, Strategic Information, Market Rank/Share for key companies, Products and Services, and Recent Developments)
- 6.4.1 Alumina doo Zvornik
- 6.4.2 BASF
- 6.4.3 C Thai Group
- 6.4.4 QEMETICA
- 6.4.5 Evonik Industries
- 6.4.6 Gujarat Multi Gas Base Chemicals Pvt Ltd
- 6.4.7 Hindcon Chemicals Ltd.
- 6.4.8 Kiran Global Chem Ltd.
- 6.4.9 Nippon Chemical Industrial Co. Ltd.
- 6.4.10 Nouryon
- 6.4.11 Occidental Petroleum Corporation
- 6.4.12 PQ Corporation
- 6.4.13 Silmaco
- 6.4.14 Tokuyama Corporation
- 6.4.15 W. R. Grace & Co.-Conn.
7 Market Opportunities and Future Outlook
- 7.1 White-Space and Unmet-Need Assessment

 矽酸鈉市場:2026-2032年全球市場預測(依實體形態、矽酸鹽種類、製造方法、功能、包裝、通路和應用分類)
 2026-2034年全球矽酸鈉市場規模、佔有率、趨勢和成長分析報告
 五水偏矽酸鈉:市場佔有率分析、產業趨勢與統計、成長預測(2026-2031)
 矽酸鈉市場報告:按類型、等級、形態、應用、最終用戶和地區分類(2026-2034 年)矽酸鈉市場規模、佔有率、成長及全球產業分析:按類型和應用分類,區域洞察及2026-2034年預測
 全球矽酸鈉市場:市場規模、佔有率和趨勢分析(按應用和地區分類),細分市場預測(2026-2033 年)
 矽酸鈉市場-全球產業規模、佔有率、趨勢、機會及按州、應用、地區和競爭格局分類的預測(2021-2031年)按形態、應用和最終用途產業結晶質層狀矽酸鈉市場-全球預測,2026-2032年
 矽酸鈉市場規模、佔有率及成長分析(依形態、類型、等級、應用、最終用途及地區分類)-2026-2033年產業預測
 矽酸鈉:全球市佔率及排名、總收入及需求預測(2025-2031年)