


 |
市場調查報告書
商品編碼
2121820
玻璃纖維:市場佔有率分析、行業趨勢和統計數據、成長預測(2026-2031)Glass Fiber - Market Share Analysis, Industry Trends & Statistics, Growth Forecasts (2026 - 2031) |
||||||

※ 本網頁內容可能與最新版本有所差異。詳細情況請與我們聯繫。
根據 Mordor Intelligence 預測,玻璃纖維市場將從 2025 年的 844 萬噸成長到 2026 年的 879 萬噸,然後從 2026 年到 2031 年以 4.12% 的複合年成長率成長,到 2031 年達到 1075 萬噸。
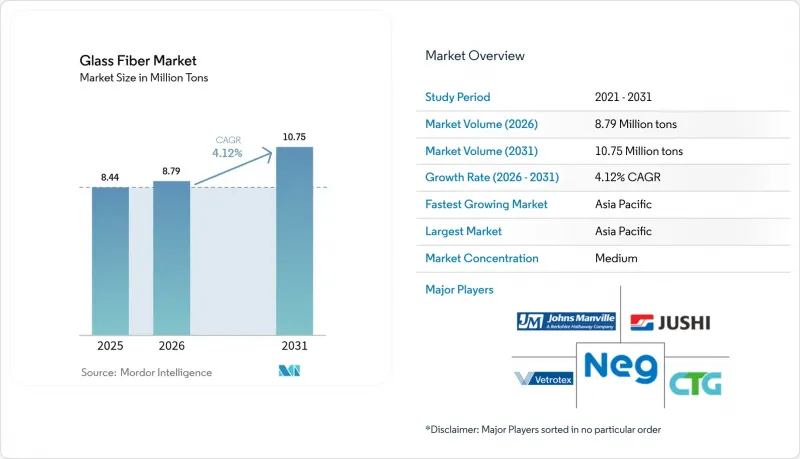
本報告按產品形態(粗紗、氈片、纖維束、紗線及其他)、纖維類型(E玻璃、S玻璃、E-CR玻璃、C玻璃及其他)、終端用戶產業(建築、汽車、風力發電、航太與國防、船舶及其他)以及地區(亞太、北美、歐洲、南美、中東和非洲)進行細分。市場預測以噸為單位。
全球玻璃纖維市場趨勢與洞察
疫情後亞洲建築業蓬勃發展,對玻璃絨隔熱材料的需求增加。
印度已在2025會計年度撥款1,200億美元用於基礎建設,其中近一半將用於住宅工程。根據2024年節能建築標準,房屋工程必須使用玻璃絨隔熱材料。越南建築業預計在2025年將成長9.1%,外資工廠已指定在無塵室中使用低密度玻璃絨隔熱材料。印尼已在2025會計年度累計410兆印尼幣(約270億美元)用於基礎建設,並採用玻璃絨產品,以降低熱帶地區住宅的製冷負荷高達35%。馬來西亞和泰國也出現了類似的趨勢,資料中心和冷鏈投資者正在採用R值較高的隔熱材料,以滿足ASHRAE 90.1標準。這些努力共同確保了亞洲在玻璃纖維市場成長中繼續保持核心地位。
電動車的輕量化正在加速短切纖維複合材料的應用。
預計到2025年,全球電池式電動車(BEV)產量將達到1,420萬輛,較2024年成長19%,這將推動對複合材料的需求。特斯拉Model Y採用切股氈結構,讓車身本體重量減輕23%,單次充電續航里程增加18公里。比亞迪、大眾和通用汽車都已檢驗了使用玻璃纖維增強熱塑性塑膠製造電池托盤的可行性,與鋁製托盤相比,總合的總成本可節省300多美元。隨著汽車製造商努力實現電動車的成本與燃油車持平,短切氈的大宗訂單正支撐著玻璃纖維市場保持穩定的中等個位數成長。
碳纖維價格的下降正在削弱玻璃纖維的成本優勢。
到2025年,東麗、三菱化學和SGL Carbon將新增9,500噸碳纖維的總合產能,將平均價格降至每公斤16.30美元。汽車複合材料的成本差距已從2023年的2.4倍縮小至如今僅為玻璃纖維聚丙烯的兩倍。體育用品OEM廠商正擴大採用低成本的軸桿測試方法,這可能會導致市場需求從E玻璃纖維轉向中端材料。如果不採取因應措施,這一趨勢可能會減緩玻璃纖維市場的成長速度。
細分市場分析
預計到2025年,粗紗將佔總銷量的33.45%,到2031年將以4.41%的複合年成長率成長。這一成長速度超過了整體玻璃纖維市場,因為每台15兆瓦的離岸風力發電機需要消耗35噸單向纖維。氈片緊隨其後,其需求主要來自中國和土耳其低成本造船廠生產的汽車底盤面板和船舶層壓板。歐洲和北美強制維修玻璃絨也推動了其成長。纖維絲、紗線和其他產品則供應給印刷電路基板、過濾纖維和特殊黏合劑產業,但直接粗紗正在蠶食中間產品的市場佔有率。
粗紗的現有設備受益於製程改進,汽車壓縮成型週期縮短至4分鐘(切股氈的一半)。玻璃絨生產商已將黏合劑含量降低至3%,在滿足加州VOC監管標準的同時,提高了R值。研磨纖維繼續用作密封劑中的流變改性劑,而紡織品則滿足航太領域對模具的需求。總體而言,應用領域的多元化使玻璃纖維產業免受單一領域波動的影響。
區域分析
亞太地區是玻璃纖維市場的主要驅動力,2025年產量佔全球的49.81%,預計到2031年將以4.57%的複合年成長率成長。光是印度一國就將消耗180萬噸,年增19%,這主要得益於開發商對日益嚴格的絕緣標準的反應。中國產量為520萬噸,其中38%用於出口,反映持續的產能過剩和積極的出口物流策略。越南預計到2025年將需要9,600噸粗紗用於建造1.2吉瓦的風力發電設施,而印尼由於電動車和摩托車的蓬勃發展,對摩托車電池外殼複合材料的需求也不斷成長。
到了2025年,北美佔據大部分市場佔有率。在美國,根據《通膨抑制法案》,新增風力發電裝置容量12吉瓦,產生了9.6萬噸粗紗的需求。在加拿大,「綠色家園補助金」計畫安裝了18萬套維修套件,這些套件主要由玻璃絨製成。在墨西哥,生產了380萬輛汽車,其中28%使用了複合材料。
2025年,歐洲佔了玻璃纖維消費的大部分佔有率,其中德國、法國和英國佔總量的58%。德國在42萬戶住宅維修中大量使用了玻璃棉,而法國正在建造2.1吉瓦的新風力發電設施,需要1.68萬噸粗紗。在英國,汽車產業表現疲軟,但航太領域表現良好,空中巴士增加了A320neo機翼組件的產量。在南美洲、中東和非洲,由於巴西擁有230萬輛汽車以及沙烏地阿拉伯的氫氣管道計畫將消耗1.2萬噸E-CR玻璃,需求正在成長。
其他好處
- Excel格式的市場預測(ME)表
- 3個月的分析師支持
目錄
第1章:引言
- 研究假設和市場定義
- 調查範圍
第2章:調查方法
第3章執行摘要
第4章 市場狀況
- 市場概覽
- 市場促進因素
- 疫情後亞洲建築業蓬勃發展,對玻璃絨隔熱材料的需求增加。
- 電動車的輕量化正在加速短切纖維複合材料的應用。
- 超大型風力發電機葉片導致粗紗消耗量增加
- 歐盟和北美能源標準要求在維修中增加隔熱材料。
- 在氫氣管道專案中採用E-CR玻璃以提高其耐化學腐蝕性能
- 市場限制因素
- 碳纖維價格的下降正在削弱玻璃纖維的成本優勢。
- 岩絨製造商的策略是搶佔密度低於100 kg/m³的暖通空調細分市場
- 堿灰和能源成本的波動給中國熔爐的利潤率帶來了壓力。
- 價值鏈分析
- 波特五力模型
第5章 市場規模與成長預測
- 按產品形式
- 粗紗
- 墊
- 斯特蘭德
- 紗
- 玻璃絨
- 其他(碎纖維、紡織品)
- 依纖維類型
- E玻璃
- S玻璃
- E-CR玻璃
- C 玻璃
- 其他
- 按最終用戶行業分類
- 建築/施工
- 車
- 風力
- 航太/國防
- 船
- 運動休閒
- 其他終端用戶產業(電子產品)
- 按地區
- 亞太地區
- 中國
- 印度
- 日本
- 韓國
- 印尼
- 越南
- 馬來西亞
- 泰國
- 其他亞太國家
- 北美洲
- 美國
- 加拿大
- 墨西哥
- 歐洲
- 德國
- 法國
- 英國
- 義大利
- 西班牙
- 俄羅斯
- 土耳其
- 北歐的
- 其他歐洲國家
- 南美洲
- 巴西
- 阿根廷
- 哥倫比亞
- 其他南美國家
- 中東和非洲
- 沙烏地阿拉伯
- 阿拉伯聯合大公國
- 卡達
- 埃及
- 南非
- 奈及利亞
- 其他中東和非洲國家
- 亞太地區
第6章 競爭情勢
- 市場集中度
- 策略趨勢
- 市佔率和排名分析
- 公司簡介
- 3B-the fibreglass company
- AGY
- ASAHI FIBER GLASS Co., Ltd
- China Jushi Co., Ltd.
- Chongqing International Composite Materials Co., Ltd.
- Envalior
- Gurit Services AG
- Heraeus Holding
- Johns Manville
- Nippon Electric Glass Co., Ltd.
- PFG FIBER GLASS CORPORATION
- Praana Group
- Saint-Gobain
- Taishan Fiberglass Inc.(CTG)
- Taiwan Glass Ind. Corp.
第7章 市場機會與未來展望
According to Mordor Intelligence, the glass fiber market size is expected to grow from 8.44 million tons in 2025 to 8.79 million tons in 2026 and is forecast to reach 10.75 million tons by 2031 at a 4.12% CAGR over 2026-2031.
This report is Segmented by Product Form (Roving, Mats, Strands, Yarn, and More), Fiber Type (E-Glass, S-Glass, E-CR Glass, C-Glass, and Others), End-User Industry (Building and Construction, Automotive, Wind Energy, Aerospace and Defense, Marine, and More), and Geography (Asia-Pacific, North America, Europe, South America, Middle East and Africa). The Market Forecasts are Provided in Terms of Volume (Tons).
Global Glass Fiber Market Trends and Insights
Post-Pandemic Construction Boom in Asia Bolsters Demand for Glass-Wool Insulation
India allocated USD 120 billion to infrastructure in fiscal 2025, and nearly half of that spending went into residential projects where glass-wool batts are now required by the 2024 Energy Conservation Building Code. Vietnam's construction sector advanced 9.1% in 2025, with foreign-invested factories specifying clean-room insulation that relies on low-density glass wool. Indonesia earmarked IDR 410 trillion (USD 27 billion) for 2025 infrastructure, using glass-wool products that cut cooling loads by up to 35% in tropical housing. Malaysia and Thailand show parallel trends as data-center and cold-chain investors adopt higher R-value batts to meet ASHRAE 90.1 targets. Collectively, these programs keep Asia the anchor of glass fiber market growth.
EV Lightweighting Accelerates Adoption of Chopped-Strand Composites
Global battery-electric vehicle production hit 14.2 million units in 2025, a 19% jump over 2024 that propelled composite demand. Tesla's Model Y uses chopped-strand mat structures to trim body-in-white mass by 23%, translating into an 18 km range extension per charge. BYD, Volkswagen, and General Motors each validated glass-fiber-reinforced thermoplastics for battery trays, together saving more than USD 300 per vehicle against aluminum alternatives. As automakers push toward cost-parity EVs, volume contracts for chopped strands underpin a steady mid-single-digit rise in the glass fiber market.
Carbon-Fiber Price Erosion Narrows Glass-Fiber's Cost Advantage
Toray, Mitsubishi Chemical, and SGL Carbon added a combined 9,500 tons of carbon-fiber nameplate capacity during 2025, pushing average prices down to USD 16.30 per kilogram. Automotive compounds now see a cost gap of only 2X versus glass-fiber polypropylene, compared with 2.4X in 2023. Sporting goods OEMs are piloting lower-cost shafts that could siphon mid-tier volumes away from E-Glass. Absent countermeasures, this trend trims the glass fiber market growth trajectory.
Other drivers and restraints analyzed in the detailed report include:
- Mega-Scale Wind-Turbine Blades Expand Roving Consumption
- EU and North-American Retrofit Energy Codes Mandate Additional Insulation
- Rock-Wool Producers Target Less Than 100 kg/m3 HVAC Niche
For complete list of drivers and restraints, kindly check the Table Of Contents.
Segment Analysis
Roving contributed 33.45% to 2025 volume and is on track for 4.41% CAGR through 2031, outpacing the broader glass fiber market because each 15 MW offshore turbine consumes 35 tons of unidirectional material. Mats follow, anchored in automotive underbody panels and marine laminates produced in low-cost Chinese and Turkish yards. Glass wool receives a tailwind from retrofit mandates across Europe and North America. Strands, yarns, and the "others" cluster supply printed-circuit boards, filtration textiles, and specialty adhesives, but direct-roving pultrusion is cannibalizing intermediate formats.
Roving's installed base benefits from process improvements that cut cycle time in automotive compression molding to four minutes, half that of chopped-strand mats. Glass-wool producers are lowering binder content to 3%, improving R-value, and meeting VOC limits in California. Milled fiber remains a rheology modifier in sealants, whereas woven fabrics secure aerospace tooling demand. All told, diversified applications shield the glass fiber industry against single-segment swings.
Complete Report Scope:
- By Product Form
- Roving
- Mats
- Strands
- Yarn
- Glass Wool
- Others (Milled Fiber and Fabrics)
- By Fiber Type
- E-Glass
- S-Glass
- E-CR Glass
- C-Glass
- Others
- By End-user Industry
- Building and Construction
- Automotive
- Wind Energy
- Aerospace and Defense
- Marine
- Sports and Leisure
- Other End-user Industries (Electronics)
- By Geography
- Asia-Pacific
- China
- India
- Japan
- South Korea
- Indonesia
- Vietnam
- Malaysia
- Thailand
- Rest of Asia-Pacific
- North America
- United States
- Canada
- Mexico
- Europe
- Germany
- France
- United Kingdom
- Italy
- Spain
- Russia
- Turkey
- Nordics
- Rest of Europe
- South America
- Brazil
- Argentina
- Colombia
- Rest of South America
- Middle-East and Africa
- Saudi Arabia
- United Arab Emirates
- Qatar
- Egypt
- South Africa
- Nigeria
- Rest of Middle-East and Africa
- Asia-Pacific
Geography Analysis
Asia-Pacific dominated the glass fiber market with 49.81% of 2025 volume and is slated for a 4.57% CAGR to 2031. India alone absorbed 1.8 million tons, up 19% year-on-year, as developers met strengthened thermal codes. China produced 5.2 million tons but exported 38%, reflecting persistent overcapacity and aggressive outbound logistics. Vietnam's 1.2 GW of 2025 wind builds needed 9,600 tons of roving, while Indonesia's EV-motorcycle boom raised composite consumption in two-wheel battery enclosures.
North America accounted for a significant market share in 2025. The U.S. installed 12 GW of wind capacity under Inflation Reduction Act incentives, translating into 96,000 tons of roving demand. Canada's Greener Homes Grant installed 180,000 retrofit kits dominated by glass wool, and Mexico produced 3.8 million vehicles using composites in 28% of units.
Europe accounted for significant glass fiber consumption in 2025, with Germany, France, and the U.K. making up 58%. Germany's 420,000 home retrofits drew heavily on glass-wool batts, whereas France added 2.1 GW of wind that required 16,800 tons of roving. The U.K. saw automotive softness but aerospace upside as Airbus raised A320neo wing set output. South America and the Middle East-Africa together are witnessing the rising demand driven by Brazil's 2.3 million-unit auto fleet and Saudi Arabia's hydrogen pipelines that consume 12,000 tons of E-CR glass.
- 3B - the fibreglass company
- AGY
- ASAHI FIBER GLASS Co., Ltd
- China Jushi Co., Ltd.
- Chongqing International Composite Materials Co., Ltd.
- Envalior
- Gurit Services AG
- Heraeus Holding
- Johns Manville
- Nippon Electric Glass Co., Ltd.
- PFG FIBER GLASS CORPORATION
- Praana Group
- Saint-Gobain
- Taishan Fiberglass Inc.(CTG)
- Taiwan Glass Ind. Corp.
Additional Benefits:
- The market estimate (ME) sheet in Excel format
- 3 months of analyst support
TABLE OF CONTENTS
1 Introduction
- 1.1 Study Assumptions and Market Definition
- 1.2 Scope of the Study
2 Research Methodology
3 Executive Summary
4 Market Landscape
- 4.1 Market Overview
- 4.2 Market Drivers
- 4.2.1 Post-pandemic construction boom in Asia bolsters demand for glass-wool insulation
- 4.2.2 EV lightweighting accelerates adoption of chopped-strand composites
- 4.2.3 Mega-scale wind-turbine blades expand roving consumption
- 4.2.4 EU and North-American retrofit energy codes mandate additional insulation
- 4.2.5 Hydrogen pipeline projects specify E-CR glass for chemical resistance
- 4.3 Market Restraints
- 4.3.1 Carbon-fiber price erosion narrows glass-fiber's cost advantage
- 4.3.2 Rock-wool producers target Less Than 100 kg m-3 HVAC niche
- 4.3.3 Volatile soda-ash and energy costs crimp Chinese furnace margins
- 4.4 Value Chain Analysis
- 4.5 Porter's Five Forces
- 4.5.1 Bargaining Power of Suppliers
- 4.5.2 Bargaining Power of Consumers
- 4.5.3 Threat of New Entrants
- 4.5.4 Threat of Substitute Products
- 4.5.5 Degree of Competition
5 Market Size and Growth Forecasts (Volume)
- 5.1 By Product Form
- 5.1.1 Roving
- 5.1.2 Mats
- 5.1.3 Strands
- 5.1.4 Yarn
- 5.1.5 Glass Wool
- 5.1.6 Others (Milled Fiber and Fabrics)
- 5.2 By Fiber Type
- 5.2.1 E-Glass
- 5.2.2 S-Glass
- 5.2.3 E-CR Glass
- 5.2.4 C-Glass
- 5.2.5 Others
- 5.3 By End-user Industry
- 5.3.1 Building and Construction
- 5.3.2 Automotive
- 5.3.3 Wind Energy
- 5.3.4 Aerospace and Defense
- 5.3.5 Marine
- 5.3.6 Sports and Leisure
- 5.3.7 Other End-user Industries (Electronics)
- 5.4 By Geography
- 5.4.1 Asia-Pacific
- 5.4.1.1 China
- 5.4.1.2 India
- 5.4.1.3 Japan
- 5.4.1.4 South Korea
- 5.4.1.5 Indonesia
- 5.4.1.6 Vietnam
- 5.4.1.7 Malaysia
- 5.4.1.8 Thailand
- 5.4.1.9 Rest of Asia-Pacific
- 5.4.2 North America
- 5.4.2.1 United States
- 5.4.2.2 Canada
- 5.4.2.3 Mexico
- 5.4.3 Europe
- 5.4.3.1 Germany
- 5.4.3.2 France
- 5.4.3.3 United Kingdom
- 5.4.3.4 Italy
- 5.4.3.5 Spain
- 5.4.3.6 Russia
- 5.4.3.7 Turkey
- 5.4.3.8 Nordics
- 5.4.3.9 Rest of Europe
- 5.4.4 South America
- 5.4.4.1 Brazil
- 5.4.4.2 Argentina
- 5.4.4.3 Colombia
- 5.4.4.4 Rest of South America
- 5.4.5 Middle-East and Africa
- 5.4.5.1 Saudi Arabia
- 5.4.5.2 United Arab Emirates
- 5.4.5.3 Qatar
- 5.4.5.4 Egypt
- 5.4.5.5 South Africa
- 5.4.5.6 Nigeria
- 5.4.5.7 Rest of Middle-East and Africa
- 5.4.1 Asia-Pacific
6 Competitive Landscape
- 6.1 Market Concentration
- 6.2 Strategic Moves
- 6.3 Market Share(%)/Ranking Analysis
- 6.4 Company Profiles (includes Global Overview, Market Overview, Core Segments, Financials, Strategic Information, Products and Services, Recent Developments)
- 6.4.1 3B - the fibreglass company
- 6.4.2 AGY
- 6.4.3 ASAHI FIBER GLASS Co., Ltd
- 6.4.4 China Jushi Co., Ltd.
- 6.4.5 Chongqing International Composite Materials Co., Ltd.
- 6.4.6 Envalior
- 6.4.7 Gurit Services AG
- 6.4.8 Heraeus Holding
- 6.4.9 Johns Manville
- 6.4.10 Nippon Electric Glass Co., Ltd.
- 6.4.11 PFG FIBER GLASS CORPORATION
- 6.4.12 Praana Group
- 6.4.13 Saint-Gobain
- 6.4.14 Taishan Fiberglass Inc.(CTG)
- 6.4.15 Taiwan Glass Ind. Corp.
7 Market Opportunities and Future Outlook
- 7.1 White-space and Unmet-need Assessment

 玻璃纖維織物:市場佔有率分析、產業趨勢與統計、成長預測(2026-2031)玻璃纖維增強混凝土(GFRC)市場佔有率分析、產業趨勢與統計及成長預測(2026-2031)
 玻璃纖維紗線市場-2026-2032年全球市場預測
 玻璃纖維:全球市場
 玻璃纖維市場-全球產業規模、佔有率、趨勢、機會和預測:按玻璃類型、產品類型、應用、地區和競爭格局分類,2021-2031年
 低介電常數玻璃纖維-全球市佔率與排名,2026年至2032年總銷售額及需求預測玻璃纖維市場:2026-2032年全球市場預測(按產品形式、纖維類型、製造方法、應用和最終用途產業分類)玻璃纖維織物市場:2026-2032年全球市場預測(按產品、纖維類型、最終用戶和分銷管道分類)E-玻璃纖維市場:依產品類型、樹脂類型、纖維形態、製造流程、應用和最終用途產業分類-2026-2032年全球預測E玻璃纖維編織繩市場:依產品類型、直徑範圍、終端用戶產業和銷售管道-2026-2032年全球預測