


 |
市場調查報告書
商品編碼
2121784
體育分析:市場佔有率分析、產業趨勢與統計、成長預測(2026-2031)Sports Analytics - Market Share Analysis, Industry Trends & Statistics, Growth Forecasts (2026 - 2031) |
||||||

※ 本網頁內容可能與最新版本有所差異。詳細情況請與我們聯繫。
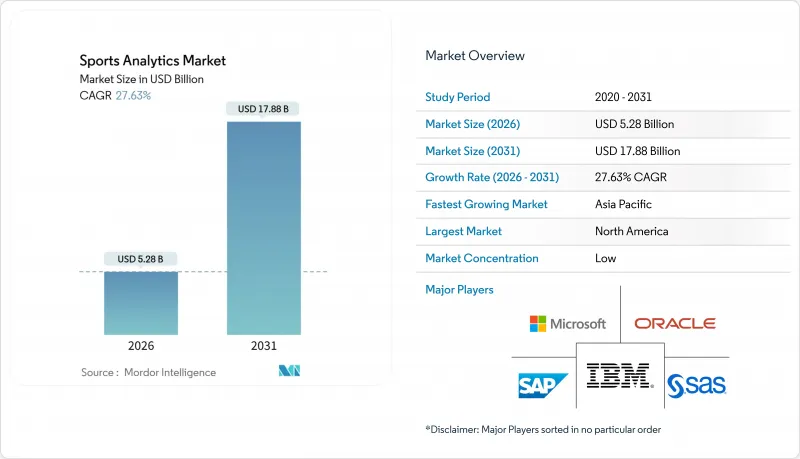
根據 Mordor Intelligence 預測,體育分析市場規模預計將在 2026 年達到 52.8 億美元,到 2031 年達到 178.8 億美元,在此期間的複合年成長率為 27.63%。
本報告按運動項目(足球、板球、籃球、曲棍球、美式橄欖球、棒球、橄欖球及其他運動)、組件(軟體和服務)、部署模式(本地部署和雲端部署)、最終用戶(運動隊/俱樂部、聯賽和聯合會、運動員、體育博彩運營商及其他最終用戶)以及地區進行細分。市場預測以美元計價。
全球運動分析市場趨勢與洞察
北美職業聯賽中利用物聯網感測器進行即時追蹤
嵌入NFL肩墊的Zebra RFID晶片和安裝在NBA球館的光學鏡頭,每場比賽都能產生數百萬個坐標數據點,將分析週期從數小時縮短到數秒。由微軟Copilot支援的場邊應用程式,於2025年8月在全聯盟範圍內推廣,它將這些數據流轉化為第四檔進攻成功機率和疲勞警報,使教練能夠立即做出反應。由於各隊無法容忍5-10秒的往返延遲,邊緣閘道器和低延遲雲端區域正在取代固定資料中心。這種模式已推廣到英超聯賽,該聯賽於2025年7月與微軟簽署了一項為期五年的AI夥伴關係。
歐洲足球俱樂部必須建立集中式資料倉儲,用於轉會評估
英超和歐洲俱樂部越來越重視球員多賽季的表現檔案,將其視為重要的資產,以證明支付數千萬美元轉會費的合理性。 Oracle的Match Insights 平台於 2021 年首次發布,整合了影像、位置和生物識別記錄,使球探團隊能夠將潛力新星與過去的類似案例進行對比評估。青訓體係也紛紛效仿,Kitman Labs 目前支持所有英超青年俱樂部的長期追蹤和分析,使賣家在談判中擁有數據驅動的優勢。因此,買家必須提供同樣全面的資料集,否則就有可能支付過高的價格。
南美洲和非洲二級聯賽俱樂部的技術預算有限
許多乙級足球俱樂部的年度預算不足1000萬美元,迫使他們優先考慮球員薪資而非數據管道建設。此外,不穩定的光纖連接進一步阻礙了即時上傳,迫使教練依賴人工標記而非自動感測器數據。這種差距有可能加劇全球人才市場的兩極分化,數據雄厚的俱樂部能夠從被低估的潛力球員中獲益,而資金不足的俱樂部則被遠遠甩在後面。
細分市場分析
預計到2025年,足球將佔總收入的39.78%,而橄欖球則是成長最快的運動,到2031年年複合成長率(CAGR)將達到29.23%。這主要歸功於Sportable公司研發的內建感測器的“吉爾伯特球”,該球每秒可提供20個位置數據點,用於裁判判罰和廣播公司畫面疊加。這款數據豐富的球能夠即時檢驗邊線球和前傳球,滿足了裁判和轉播方的需求。板球仍然佔據第二大市場佔有率,這得益於鷹眼系統在印度和澳大利亞的廣泛應用。同時,在籃球領域,空間追蹤技術的夥伴關係正在加強分析基礎設施的建設。
橄欖球運動的這一發展勢頭表明,那些面臨判罰模糊不清的運動項目,往往比那些已經擁有成熟回放系統的運動項目更早地採用嵌入式感測器。在2023年U-20世界盃成功試運行後,六國賽組委會已決定在2029年前全面啟用智慧球系統,預計硬體和軟體的需求將穩定成長。因此,隨著技術解決裁判難題並豐富球迷的觀賽體驗,體育分析市場也將從中受益。
即使到了2025年,軟體授權仍佔市場價值的64.89%,而整合、資料品質和模型訓練服務則以28.11%的複合年成長率快速成長。德勤的「運動融合」(Converge for Sports)將球迷數據湖、會員忠誠度功能和即時儀錶板整合到一個統一的託管服務中,凸顯了俱樂部為何更傾向於基於績效的合約而非工具包。諮詢部門負責協調客製化開發的穿戴式裝置和公共雲端API,確保整個技術堆疊的隱私管理和單一登入功能。
服務溢價反映了架構日益複雜的現狀。在現代部署中,光學攝影機、RFID晶片、票務銷售記錄和投注資料都被整合到雲端資料倉儲中。如果沒有整合合作夥伴,俱樂部將難以實現模式對齊,也難以安全部署機器學習模型。將產品授權與諮詢服務結合的供應商具有交叉銷售優勢,而私募股權投資者高度重視那些能夠持續產生業務收益的公司。
區域分析
到2025年,北美地區的收入佔比將達到42.76%,這得益於NFL全聯盟的物聯網系統以及合法博彩業的蓬勃發展,後者強調亞秒級資料饋送。美國職棒大聯盟(MLB)與Sportradar續約的協議有效期至2032年,該協議還包含股權條款,這表明長期數據合約如何為版權所有擁有者和供應商雙方帶來現金流。成熟的寬頻基礎設施、大規模的媒體版權以及量化決策文化正在維持支出成長的勢頭。
歐洲則位居第二,這主要得益於統一的足球數據策略以及Oracle提供的轉播技術。儘管成長穩健,但由於GDPR下取得生物識別數據需要獲得用戶同意,其成長速度仍落後於全球平均值。不過,英超聯賽與微軟在2025年7月達成的合作表明,一旦合規流程標準化,各俱樂部將加強投資。中東地區正扮演擴張市場的角色。沙烏地阿拉伯正利用「2030願景」基金投資板球和足球分析試點項目,而阿拉伯聯合大公國則在其自由區吸引新創企業進駐。
亞太地區預計將成為成長最快的地區,到2031年複合年成長率將達到28.69%,這主要得益於板球特許經營經濟和快速發展的電子競技行業共用的數據基礎設施。印度超級聯賽(IPL)強制所有俱樂部部署鷹眼(Hawk-Eye)和彈射系統(Catapult),確保每個賽季都能進行持續的軟體升級。中國、韓國和日本正在將傳統運動數據與電競遙測數據結合,建構教練和說明共同依賴的混合數據看板。預計到2030年代初,累積支出將與北美持平,甚至超過北美。
儘管南美洲和非洲的足球基數較小,但仍保持著兩位數的成長率。雖然預算限制減緩了二線俱樂部採用穿戴式裝置和雲端分析技術的速度,但聖保羅、布宜諾斯艾利斯和約翰尼斯堡的精英球隊已經部署了與歐洲同行相當的穿戴式裝置和雲端分析技術。與申辦2030年世界盃和爭取區域轉播合約相關的基礎設施投資預計將逐步縮小這一差距。
其他好處:
- Excel格式的市場預測(ME)表
- 3個月的分析師支持
目錄
第1章:引言
- 研究假設和市場定義
- 調查範圍
第2章:調查方法
第3章執行摘要
第4章 市場狀況
- 市場概覽
- 市場促進因素
- 北美職業運動聯盟利用物聯網感測器進行即時追蹤
- 歐洲足球俱樂部現在被要求建立集中式資料倉儲,用於轉會評估。
- 美國體育博彩合法化後的數據合作
- 在印度和澳大利亞板球聯賽中引入特許經營主導的分析技術。
- 人工智慧輔助的傷病預測模型可以縮短球員的恢復時間。
- 整合電競表現數據和傳統運動分析
- 市場限制因素
- 南美洲和非洲二級聯賽俱樂部的技術預算有限
- GDPR 和 CCPA 對生物識別資料收集的限制
- 聯賽和博彩運營商之間就數據所有權問題產生爭議
- 女子體育運動整體缺乏標準化的績效衡量標準。
- 產業價值鏈分析
- 宏觀經濟因素對市場的影響
- 監理展望
- 科技趨勢
- 波特五力分析
第5章 市場規模與成長預測
- 體育運動
- 足球
- 蟋蟀
- 籃球
- 曲棍球
- 美國美式足球
- 棒球
- 橄欖球
- 其他運動
- 按組件
- 軟體
- 服務
- 不同的發展
- 現場
- 雲
- 最終用戶
- 運動隊伍/俱樂部
- 聯賽和聯合會
- 個人運動員
- 體育博彩營運商
- 其他最終用戶
- 按地區
- 北美洲
- 美國
- 加拿大
- 墨西哥
- 歐洲
- 德國
- 英國
- 法國
- 俄羅斯
- 其他歐洲國家
- 亞太地區
- 中國
- 日本
- 印度
- 韓國
- 澳洲
- 其他亞太國家
- 中東和非洲
- 中東
- 沙烏地阿拉伯
- 阿拉伯聯合大公國
- 其他中東國家
- 非洲
- 南非
- 埃及
- 其他非洲國家
- 中東
- 南美洲
- 巴西
- 阿根廷
- 其他南美國家
- 北美洲
第6章 競爭情勢
- 市場集中度
- 策略趨勢
- 市佔率分析
- 公司簡介
- IBM Corporation
- SAP SE
- SAS Institute Inc.
- Oracle Corporation
- Microsoft Corporation
- Stats Perform(Opta)
- Catapult Group International Ltd
- Sportradar AG
- Genius Sports Group
- Zebra Technologies Corp.
- Kinexon GmbH
- Second Spectrum Inc.
- Hudl(Agile Sports)
- Wyscout Srl
- Zelus Analytics
- ChyronHego Corp.
- Hawk-Eye Innovations Ltd
- Tableau Software LLC
- Sportlogiq
- Strivr Labs Inc.
- Zone7 AI Ltd
- Synergy Sports Technology
- Kitman Labs
- Orreco Ltd
第7章 市場機會與未來展望
According to Mordor Intelligence, the sports analytics market size stood at USD 5.28 billion in 2026 and is forecast to reach USD 17.88 billion by 2031, corresponding to a 27.63% CAGR over the period.
This report is Segmented by Sport (Football, Cricket, Basketball, Hockey, American Football, Baseball, Rugby, Other Sports), Component (Software, and Services), Deployment (On-Premise, and Cloud), End User (Sports Teams/Clubs, Leagues and Federations, Individual Athletes, Sports Betting Operators, Other End User), and Geography. The Market Forecasts are Provided in Terms of Value (USD).
Global Sports Analytics Market Trends and Insights
Real-Time Tracking Enabled by IoT Sensors in North American Professional Leagues
Zebra RFID chips in NFL shoulder pads and optical cameras in NBA arenas generate millions of coordinates each game, compressing the analysis loop from hours to seconds. Microsoft's Copilot-enabled sideline application, rolled out league-wide in August 2025, converts those streams into fourth-down probabilities and fatigue alerts that coaches can act on instantly. Edge gateways and low-latency cloud zones are therefore replacing fixed data centers because teams cannot tolerate 5-10 second round-trip delays. The model is already diffusing to the English Premier League, which signed its own five-year AI partnership with Microsoft in July 2025.
Centralised Data-Warehousing Mandates from European Football Clubs for Transfer Valuation
Premier League and continental clubs increasingly treat multi-season performance archives as capital assets that justify eight-figure transfer fees. Oracle's Match Insights platform, first launched in 2021, collates video, positional, and biometric records so recruitment teams can benchmark prospects against historical comparables. Academy programs follow suit: Kitman Labs now underpins longitudinal tracking across every Premier League youth setup, giving sellers data-backed leverage in negotiations. As a result, buyers must counter with equally rich datasets or risk overpaying.
Limited Technology Budgets of Tier-2 Clubs in South America and Africa
Many second-division football organizations operate on annual budgets under USD 10 million and must choose salaries over data pipelines. Patchy fiber backhaul further hampers live uploads, forcing coaches to rely on manual tagging rather than automated sensor feeds. The gap risks locking in a two-tier global talent market where data-rich clubs monetize undervalued prospects, while cash-strapped peers fall behind.
Other drivers and restraints analyzed in the detailed report include:
- Sports Betting Data Partnerships Post-Legalization in the United States
- Franchise-Driven Analytics Adoption in Indian and Australian Cricket Leagues
- GDPR and CCPA Constraints on Biometric Data Collection
For complete list of drivers and restraints, kindly check the Table Of Contents.
Segment Analysis
Football generated 39.78% revenue in 2025, yet rugby is expanding fastest at a 29.23% CAGR through 2031 as Sportable's sensor-embedded Gilbert ball delivers 20 positional updates per second for officiating and broadcast overlays. This data-rich object verifies lineouts and forward passes in real time, satisfying both referees and broadcasters. Cricket retains the second-largest slice, propelled by Hawk-Eye dominance in India and Australia, while basketball's spatial-tracking partnerships fortify its analytics baseline.
Rugby's momentum demonstrates that sports confronting officiating ambiguity adopt embedded sensors sooner than those with established replay systems. Successful trials at the 2023 Under-20 World Championship convinced Six Nations organizers to roll out smart balls through 2029, guaranteeing a steady uptick in hardware and software demand. The sports analytics market, therefore, benefits when technology solves officiating pain points and enriches fan storytelling.
Software licenses still accounted for 64.89% of value in 2025, but integration, data quality, and model-training services are expanding at a 28.11% CAGR. Deloitte's Converge for Sports bundles a fan data lake, loyalty functions, and real-time dashboards into a single managed service, underscoring why clubs prefer outcome-based contracts over toolkits. Consulting arms also mediate between proprietary wearables and public-cloud APIs, ensuring privacy controls and single-sign-on function across the stack.
The premium on services reflects rising architectural complexity. Modern deployments connect optical cameras, RFID chips, ticketing logs, and betting feeds inside a cloud warehouse. Without integration partners, clubs struggle to harmonize schemas or deploy machine-learning models safely. Vendors that pair product licenses with advisory programs have a cross-sell edge, and private equity investors reward those with steady services annuities.
Complete Report Scope:
- By Sport
- Football
- Cricket
- Basketball
- Hockey
- American Football
- Baseball
- Rugby
- Other Sports
- By Component
- Software
- Services
- By Deployment
- On-Premise
- Cloud
- By End User
- Sports Teams/Clubs
- Leagues and Federations
- Individual Athletes
- Sports Betting Operators
- Other End Users
- By Geography
- North America
- United States
- Canada
- Mexico
- Europe
- Germany
- United Kingdom
- France
- Russia
- Rest of Europe
- Asia-Pacific
- China
- Japan
- India
- South Korea
- Australia
- Rest of Asia-Pacific
- Middle East and Africa
- Middle East
- Saudi Arabia
- United Arab Emirates
- Rest of Middle East
- Africa
- South Africa
- Egypt
- Rest of Africa
- Middle East
- South America
- Brazil
- Argentina
- Rest of South America
- North America
Geography Analysis
North America controlled 42.76% of revenue in 2025, aided by the NFL's league-wide IoT stack and widespread legal wagering that values sub-second data feeds. Major League Baseball's 2032 renewal with Sportradar, including an equity component, illustrates how long-term data contracts anchor cash flows for both rights holders and vendors. Mature broadband infrastructure, large media rights, and a culture of quantitative decision-making sustain spending momentum.
Europe ranked second, propelled by unified football data strategies and Oracle-powered broadcast overlays. Growth remains healthy but sits beneath global averages because GDPR introduces consent hurdles for biometric capture. Nevertheless, the July 2025 Premier League-Microsoft pact shows clubs will invest heavily once compliance workflows are standardized. The Middle East acts as an extension market: Saudi Arabia channels Vision 2030 capital into analytics pilots across cricket and football, while the United Arab Emirates recruits startups to its free zones.
Asia Pacific is advancing fastest at a 28.69% CAGR through 2031, led by cricket's franchise economics and a booming esports sector that shares data infrastructure. The Indian Premier League forces every club to maintain Hawk-Eye and Catapult systems, locking in recurrent software upgrades each season. China, South Korea, and Japan fuse traditional sports data with esports telemetry to build hybrid dashboards that coaches and shout-casters both rely on. By the early 2030s, cumulative spend is on track to match, then surpass, North America.
South America and Africa remain double-digit growth regions despite smaller bases. Budget limitations among tier-2 clubs slow adoption, but elite sides in Sao Paulo, Buenos Aires, and Johannesburg are already deploying wearables and cloud analytics on par with European counterparts. Infrastructure investments tied to 2030 World Cup bids and regional broadcasting deals are expected to gradually narrow the gap.
- IBM Corporation
- SAP SE
- SAS Institute Inc.
- Oracle Corporation
- Microsoft Corporation
- Stats Perform (Opta)
- Catapult Group International Ltd
- Sportradar AG
- Genius Sports Group
- Zebra Technologies Corp.
- Kinexon GmbH
- Second Spectrum Inc.
- Hudl (Agile Sports)
- Wyscout Srl
- Zelus Analytics
- ChyronHego Corp.
- Hawk-Eye Innovations Ltd
- Tableau Software LLC
- Sportlogiq
- Strivr Labs Inc.
- Zone7 AI Ltd
- Synergy Sports Technology
- Kitman Labs
- Orreco Ltd
Additional Benefits:
- The market estimate (ME) sheet in Excel format
- 3 months of analyst support
TABLE OF CONTENTS
1 INTRODUCTION
- 1.1 Study Assumptions and Market Definition
- 1.2 Scope of the Study
2 RESEARCH METHODOLOGY
3 EXECUTIVE SUMMARY
4 MARKET LANDSCAPE
- 4.1 Market Overview
- 4.2 Market Drivers
- 4.2.1 Real-Time Tracking Enabled by IoT Sensors in North-American Professional Leagues
- 4.2.2 Centralised Data Warehousing Mandates from European Football Clubs for Transfer Valuation
- 4.2.3 Sports-Betting Data Partnerships Post-Legalisation in the United States
- 4.2.4 Franchise-Driven Analytics Adoption in Indian and Australian Cricket Leagues
- 4.2.5 AI-Powered Injury Prediction Models Reducing Player Downtime
- 4.2.6 Integration of Esports Performance Data with Traditional Sports Analytics
- 4.3 Market Restraints
- 4.3.1 Limited Technology Budgets of Tier-2 Clubs in South America and Africa
- 4.3.2 GDPR and CCPA Constraints on Biometric Data Collection
- 4.3.3 Data-Ownership Disputes Between Leagues and Betting Operators
- 4.3.4 Lack of Standardised Performance Metrics Across Women's Sports
- 4.4 Industry Value Chain Analysis
- 4.5 Impact of Macroeconomic Factors on the Market
- 4.6 Regulatory Outlook
- 4.7 Technology Outlook
- 4.8 Porter's Five Forces Analysis
- 4.8.1 Bargaining Power of Suppliers
- 4.8.2 Bargaining Power of Consumers
- 4.8.3 Threat of New Entrants
- 4.8.4 Intensity of Competitive Rivalry
- 4.8.5 Threat of Substitutes
5 MARKET SIZE AND GROWTH FORECASTS (VALUE)
- 5.1 By Sport
- 5.1.1 Football
- 5.1.2 Cricket
- 5.1.3 Basketball
- 5.1.4 Hockey
- 5.1.5 American Football
- 5.1.6 Baseball
- 5.1.7 Rugby
- 5.1.8 Other Sports
- 5.2 By Component
- 5.2.1 Software
- 5.2.2 Services
- 5.3 By Deployment
- 5.3.1 On-Premise
- 5.3.2 Cloud
- 5.4 By End User
- 5.4.1 Sports Teams/Clubs
- 5.4.2 Leagues and Federations
- 5.4.3 Individual Athletes
- 5.4.4 Sports Betting Operators
- 5.4.5 Other End Users
- 5.5 By Geography
- 5.5.1 North America
- 5.5.1.1 United States
- 5.5.1.2 Canada
- 5.5.1.3 Mexico
- 5.5.2 Europe
- 5.5.2.1 Germany
- 5.5.2.2 United Kingdom
- 5.5.2.3 France
- 5.5.2.4 Russia
- 5.5.2.5 Rest of Europe
- 5.5.3 Asia-Pacific
- 5.5.3.1 China
- 5.5.3.2 Japan
- 5.5.3.3 India
- 5.5.3.4 South Korea
- 5.5.3.5 Australia
- 5.5.3.6 Rest of Asia-Pacific
- 5.5.4 Middle East and Africa
- 5.5.4.1 Middle East
- 5.5.4.1.1 Saudi Arabia
- 5.5.4.1.2 United Arab Emirates
- 5.5.4.1.3 Rest of Middle East
- 5.5.4.2 Africa
- 5.5.4.2.1 South Africa
- 5.5.4.2.2 Egypt
- 5.5.4.2.3 Rest of Africa
- 5.5.4.1 Middle East
- 5.5.5 South America
- 5.5.5.1 Brazil
- 5.5.5.2 Argentina
- 5.5.5.3 Rest of South America
- 5.5.1 North America
6 COMPETITIVE LANDSCAPE
- 6.1 Market Concentration
- 6.2 Strategic Moves
- 6.3 Market Share Analysis
- 6.4 Company Profiles (includes Global Level Overview, Market Level Overview, Core Segments, Financials as Available, Strategic Information, Market Rank/Share for Key Companies, Products and Services, and Recent Developments)
- 6.4.1 IBM Corporation
- 6.4.2 SAP SE
- 6.4.3 SAS Institute Inc.
- 6.4.4 Oracle Corporation
- 6.4.5 Microsoft Corporation
- 6.4.6 Stats Perform (Opta)
- 6.4.7 Catapult Group International Ltd
- 6.4.8 Sportradar AG
- 6.4.9 Genius Sports Group
- 6.4.10 Zebra Technologies Corp.
- 6.4.11 Kinexon GmbH
- 6.4.12 Second Spectrum Inc.
- 6.4.13 Hudl (Agile Sports)
- 6.4.14 Wyscout Srl
- 6.4.15 Zelus Analytics
- 6.4.16 ChyronHego Corp.
- 6.4.17 Hawk-Eye Innovations Ltd
- 6.4.18 Tableau Software LLC
- 6.4.19 Sportlogiq
- 6.4.20 Strivr Labs Inc.
- 6.4.21 Zone7 AI Ltd
- 6.4.22 Synergy Sports Technology
- 6.4.23 Kitman Labs
- 6.4.24 Orreco Ltd
7 MARKET OPPORTUNITIES AND FUTURE OUTLOOK
- 7.1 White-Space and Unmet-Need Assessment

 運動分析市場 - 全球市場預測(2026-2032年)
 2026年全球體育分析市場報告
 2026-2030年全球運動分析市場
 體育分析市場規模、佔有率和趨勢分析報告:按組件、分析方法、運動項目、最終用途、地區和細分市場預測(2026-2033 年)
 體育分析市場分析及預測(至2035年):按類型、產品、技術、組件、應用、設備、流程、最終用戶、解決方案和部署類型分類
 全球體育分析市場規模、佔有率、趨勢和成長分析報告(2026-2034)
 體育分析市場報告:按組件、分析類型、運動項目和地區分類(2026-2034 年)體育分析工具市場:按交付方式、運動項目、應用和最終用戶分類,全球預測(2026-2032)運動分析市場規模、佔有率、成長及全球產業分析:依類型、應用和地區劃分的洞察與預測(2026-2034)
 體育分析市場-全球產業規模、佔有率、趨勢、機會和預測(按類型、解決方案、解決方案類型、最終用戶、地區和競爭格局分類,2021-2031年預測)