


 |
市場調查報告書
商品編碼
2121710
玻璃包裝:市場佔有率分析、產業趨勢與統計、成長預測(2026-2031)Glass Packaging - Market Share Analysis, Industry Trends & Statistics, Growth Forecasts (2026 - 2031) |
||||||

※ 本網頁內容可能與最新版本有所差異。詳細情況請與我們聯繫。
據 Mordor Intelligence 稱,2025 年玻璃包裝市場價值為 1.2792 億噸,預計到 2031 年將達到 1.5486 億噸,而 2026 年為 1.3206 億噸,預測期(2026-2031 年)的複合年成長率為 3.24%。
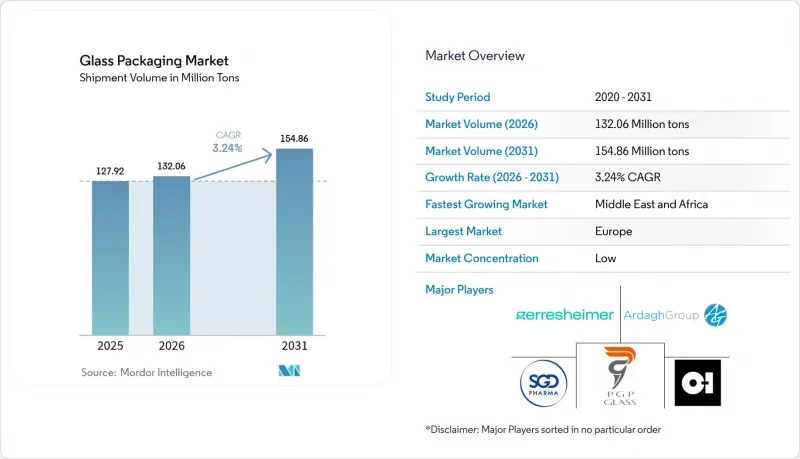
本報告依產品類型(瓶/罐、其他)、終端用途產業(食品、飲料、藥品、其他)、顏色(燧石色、琥珀色、其他)、容量(200毫升以下、200-500毫升、500-1000毫升、1000毫升以上)和地區(北美、歐洲、亞太地區、中東和非洲、毫升以上)和地區(北美、歐洲、亞太地區、中東和非洲、毫升以上)和地區(北美、歐洲、亞太地區)進行南美。市場預測以噸為單位。
全球玻璃包裝市場趨勢及洞察
精釀啤酒和頂級烈酒的激增帶動了對玻璃瓶的需求。
精釀啤酒廠和新酒廠的增加推動了玻璃瓶訂單的成長。為了滿足這項需求,Ardaag集團於2024年擴大了其頂級烈酒產品線。預計到2024年,英國烈酒市場規模將達到168億英鎊,屆時將有超過50家新酒廠開業,這表明高階定位正在推動玻璃瓶的普及。即飲雞尾酒市場預計到2030年將以每年16.2%的速度成長,玻璃瓶因其能夠更好地保持風味並展現酒品的真實品質而備受青睞。烈酒生產中「超本地化」的趨勢也促進了小批量玻璃瓶的生產,凸顯了精釀傳統。品牌擁有者在展示超高階飲品時,非常重視玻璃瓶的透明度、堅固性和惰性。
mRNA疫苗和載體疫苗的引入,提高了對醫用管瓶的需求。
新型生物製藥產量的不斷成長推動了對I型管瓶的持續需求。肖特製藥公司(SCHOTT Pharma)已投資3.71億美元擴建其位於北卡羅來納州的工廠,該工廠為GLP-1類藥物生產玻璃注射器,並為mRNA藥物生產可重複填充的聚合物系統。美國食品藥物管理局(FDA)於2024年發布了關於容器和密封系統變更的最新指南,強調了監管機構對管瓶品質的重視。康寧公司的Valor配方可透過去除硼來防止分層,從而確保藥物安全,並支援自動化填充生產線。這些進展凸顯了醫藥玻璃包裝市場解決方案的長期成長潛力。
替代解決方案的出現
輕質鋁材和新興的生物基塑膠正在蠶食玻璃包裝的潛在市場規模,尤其是在對成本高度敏感的飲料領域。 Cop Water強調了鋁材優異的剩餘價值,這支撐了其在閉合迴路管道中近100%的回收率。 Blue Triton已在其Polish Spring產品系列中採用鋁瓶,以提高回收的經濟效益。旨在減少石化產品使用的歐洲措施正在加速PLA和PEF的創新,加劇了與玻璃的競爭。
細分市場分析
2025年,瓶罐包裝佔總出貨量的64.55%,涵蓋食品、飲料及美容業。管瓶和西林瓶的成長速度最快,複合年成長率達6.28%,主要得益於新型細胞和基因療法對惰性包裝的需求。肖特製藥公司(SCHOTT Pharma)2024年注射器和管瓶解決方案的銷售額累計10.34億美元。康寧公司的「Valor」玻璃可消除分層現象,並提高自動化填充生產線的耐用性。隨著生物製藥產品線的成熟,管瓶玻璃包裝的市場規模預計將穩定成長。
更廣泛的專業產品,例如實驗室容器,雖然仍處於細分市場,但需求穩定。自動化生產取代了人工生產,確保了壁厚均勻和尺寸精度。 Geresheimer 收購 Bormioli Pharma 後,新增了「EZ-fill Smart」平台,進一步簡化了填充流程。目前,與競爭對手的差異化優勢主要體現在表面塗層和用於監測藥物依從性的智慧瓶蓋上。
預計到2025年,飲料類別將佔據54.10%的市場佔有率,這主要得益於啤酒、葡萄酒和烈酒對玻璃包裝的強勁偏好。精釀品牌則選擇玻璃瓶來增強產品色澤和氣泡感,以提升吸引力。高階果汁和乳製品等非酒精飲料也開始採用玻璃包裝以保持其風味。隨著高階產品銷售持續超越大眾市場品牌,飲料品類在玻璃包裝市場的佔有率預計將保持強勁。
醫藥領域是成長最快的細分市場,複合年成長率達7.11%。預計到2031年,mRNA疫苗和GLP-1注射的生產將推動醫藥玻璃包裝市場達到歷史新高。化妝品、香水和個人保健產品也紛紛採用玻璃包裝,以吸引消費者並滿足可回收目標。在食品應用領域,市場需求保持穩定,尤其是在醬料和高級調味品領域,產品的可視性是關鍵優勢。
區域分析
歐洲擁有成熟的製造業基礎、嚴格的回收目標以及深厚的葡萄酒和烈酒文化,預計到2025年將佔據全球市場37.75%的佔有率。 Veralia在干邑白蘭地運作了首個全電熔爐,減少了60%的二氧化碳排放,展現了其在脫碳領域的領先地位。 AGC Glass Europe在2023年回收了70萬噸玻璃廢料,進一步鞏固了循環經濟的發展動能。由於嚴格的生產者責任指令,玻璃在監管方面往往比某些塑膠享有優先待遇。儘管受啤酒銷售成長乏力的影響,2024年玻璃需求略有下降,但由於創新和優質化,附加價值保持穩定。
北美仍然是至關重要的市場,這要歸功於其在精釀飲料和生物技術領域的中心地位。作為該地區最大的生產商,OI Glass 正在考慮到 2025 年年中將產能削減 7%,以調整供應以適應不斷變化的需求。其在 Vausch 和 Alois 工廠的電氣化投資凸顯了該集團致力於減少排放的決心。鼓勵使用回收材料和提供先進製造稅額扣抵的監管激勵措施有望加速現代化進程。
儘管中國暫時出現庫存過剩,亞太地區仍呈現強勁成長動能。 BG Container Glass累計2023 年銷售額將達到 4.32 億美元,並預計在 2030 年前以 4.7% 的複合年成長率成長。中國平板玻璃製造商正將業務重心轉向太陽能和汽車市場,這將釋放出容器玻璃的產能,以便在需求復甦時投入使用。快速的都市化、新興中產階級消費群體的崛起以及即飲飲料市場的快速成長,都為玻璃包裝市場的長期擴張提供了支撐。
預計到2031年,中東和非洲將以7.67%的複合年成長率實現最高成長速度,主要得益於基礎建設和包裝產品需求的成長。為滿足該地區的成長需求,Vitro計劃在埃及投資4億美元用於玻璃相關產品。 HORN已透過在奈及利亞為Frigoglass公司運作一座新熔爐,展現了其本地產能的提升。政府鼓勵國內製造業發展的政策正在減少對進口的依賴,並增強供應鏈的韌性。
在南美洲,由於對主要飲料的強勁需求和回收系統的發展,預計將保持穩定成長。生產商正在考慮引入輕質瓶,以降低整個廣袤地區的物流成本。整體而言,這些區域趨勢凸顯了永續發展框架、能源價格和消費者偏好如何導致各地區發展軌跡的差異。
其他好處
- Excel格式的市場預測(ME)表
- 3個月的分析師支持
目錄
第1章:引言
- 研究假設和市場定義
- 調查範圍
第2章:調查方法
第3章執行摘要
第4章 市場狀況
- 市場概覽
- 市場促進因素
- 精釀啤酒和頂級烈酒的激增帶動了對玻璃瓶的需求。
- mRNA疫苗和載體疫苗的廣泛應用,推動了全球對藥用管瓶的需求。
- 化妝品產業對高檔包裝的需求日益成長
- 亞洲地區即飲咖啡和功能性飲料的日益普及,帶動了對輕質玻璃瓶的需求。
- 容器玻璃的多方面優勢使其越來越受歡迎。
- 市場限制因素
- 替代方案的可用性
- 由於藥用級硼矽酸管供不應求,管瓶供應有限。
- 高碳排放的玻璃製造流程正在阻礙市場成長。
- 供應鏈分析
- 玻璃包裝行業標準和法規
- 進出口資料(依相關HS編碼)
- 玻璃包裝回收趨勢
- 原料分析
- 玻璃包裝供需分析
- 波特五力分析
第5章 市場規模與成長預測
- 依產品類型
- 瓶子罐
- 管瓶安瓿
- 其他
- 按顏色
- 燧石
- 琥珀色
- 綠色的
- 其他顏色
- 按產能
- 200毫升或以下
- 200~500mL
- 500~1,000mL
- 超過1000毫升
- 按最終用途行業分類
- 食物
- 飲料
- 酒精飲料
- 啤酒
- 葡萄酒
- 烈酒
- 其他酒精飲料(蘋果酒和其他發酵飲料)
- 不含酒精的飲料
- 碳酸軟性飲料
- 果汁
- 乳製品飲料
- 其他非酒精飲料
- 酒精飲料
- 製藥
- 化妝品和個人護理
- 其他
- 按地區
- 北美洲
- 美國
- 加拿大
- 墨西哥
- 歐洲
- 德國
- 英國
- 法國
- 義大利
- 西班牙
- 俄羅斯
- 其他歐洲國家
- 亞太地區
- 中國
- 印度
- 日本
- 韓國
- 澳洲和紐西蘭
- 其他亞太國家
- 中東和非洲
- 中東
- 阿拉伯聯合大公國
- 沙烏地阿拉伯
- 土耳其
- 其他中東國家
- 非洲
- 南非
- 奈及利亞
- 埃及
- 其他非洲地區
- 中東
- 南美洲
- 巴西
- 阿根廷
- 南美洲其他地區
- 北美洲
第6章 競爭情勢
- 市場集中度
- 策略舉措和趨勢
- 市佔率分析
- 公司簡介
- OI Glass Inc.(Owens-Illinois)
- Ardagh Group
- Gerresheimer AG
- Wiegand-Glas GmbH
- Piramal Glass Pvt. Ltd.
- Hindustan National Glass & Industries Ltd.
- Verallia Deutschland AG
- SGD Pharma
- WestPack LLC
- Berlin Packaging LLC
- SGD Kipfenberg GmbH
- HEINZ-GLAS GmbH & Co. KGaA
- BA Glass Germany GmbH
- AGI glaspac
- Glashutte Freital GmbH
- KP Glas GmbH & Co. KG
- San Miguel Yamamura Packaging Corporation
- Hung Phu Glass Joint Stock Company(HuphuMeglass)
- Vietnam Nashley Technology Joint Stock Company
- Feemio Group Co., Ltd.
- Pavico Packaging Company Limited
- SCHOTT Pharma(SCHOTT Group)
- Pharma-Q Holdings(Pty)Ltd.
- Nurrin Pharmalab
- Stevanato Group Spa
- Corning Incorporated
- Kapoor Glass India Pvt. Ltd.
- Neelam Global Pvt. Ltd
- Khemka Glass
- Amputech Industry
- Stevanato Group
- Hindustan Glass Works
第7章 市場機會與未來展望
According to Mordor Intelligence, the glass packaging market size was valued at 127.92 million tons in 2025 and estimated to grow from 132.06 million tons in 2026 to reach 154.86 million tons by 2031, at a CAGR of 3.24% during the forecast period (2026-2031).
This report is Segmented by Product Type (Bottles and Jars, and More), End-Use Industry (Food, Beverage, Pharmaceuticals, and More), Color (Flint, Amber, and More), Capacity (Less Than 200ml, 200-500ml, 500-1000ml, More Than 1000ml), and Geography (North America, Europe, Asia-Pacific, Middle East and Africa, South America). The Market Forecasts are Provided in Terms of Volume (Tons).
Global Glass Packaging Market Trends and Insights
Craft Beer and Premium Spirits Surge Fueling Glass Bottle Demand
Rising craft breweries and new distilleries are fueling incremental glass bottle orders. Ardagh Group broadened its premium spirits portfolio in 2024 to meet this appetite. The UK spirits market reached GBP 16.8 billion in 2024 with more than 50 additional distilleries, demonstrating how premium positioning drives glass uptake. Ready-to-drink cocktails are projected to grow 16.2% per year to 2030, favouring glass because it safeguards flavour and signals authenticity. The hyperlocal trend in spirits production also benefits small-batch glass bottle runs that showcase craft heritage. Brand owners value the material's clarity, rigidity, and inertness when presenting super-premium liquids.
mRNA and Vector-Vaccine Rollout Boosting Pharmaceutical Glass Vials
Scaling production of new biologics drives sustained demand for Type I vials. SCHOTT Pharma committed USD 371 million to a North Carolina plant that will supply glass syringes for GLP-1 drugs and refillable polymer systems for mRNA medicines. The FDA issued updated guidance on container-closure changes in 2024, underscoring regulatory focus on vial quality. Corning's Valor formulation removes boron to prevent delamination, addressing drug safety while enabling automated filling lines. These moves confirm the long-term growth runway for pharma glass packaging market solutions.
Availability of Alternative Solutions
Lightweight aluminum and emerging bio-based plastics are eating into the addressable volume of the glass packaging market, particularly in cost-sensitive beverage segments. Kopu Water highlights the superior residual value of aluminum, which supports near-100% capture rates in closed-loop channels. BlueTriton adopted aluminum bottles for Poland Spring to improve recycling economics. European policy that targets petrochemical reduction accelerates innovation in PLA and PEF, raising competitive intensity for glass.
Other drivers and restraints analyzed in the detailed report include:
- Increasing Demand from Cosmetics Industry for Premium Packaging
- RTD Coffee and Functional Drinks Uptake in Asia Spurring Lightweight Glass Bottles
- Shortage of Pharma-Grade Borosilicate Tubing Limits Vial Supply
For complete list of drivers and restraints, kindly check the Table Of Contents.
Segment Analysis
Bottles and jars held 64.55% of 2025 volumes as they span food, beverage, and beauty sectors. Vials and ampoules posted the fastest trajectory, growing at 6.28% CAGR on the back of new cell-and-gene therapies that require inert packaging. SCHOTT Pharma generated USD 1.034 billion revenue in 2024 from syringe and vial solutions. Corning's Valor glass eliminates delamination, improving durability in automated fill lines. The glass packaging market size for vials is projected to climb steadily as biologic pipelines mature.
Broader specialty items such as laboratory containers remain niche but stable. Automation has replaced hand-blown production, ensuring uniform wall thickness and dimensional accuracy. Gerresheimer's acquisition of Bormioli Pharma adds the EZ-fill Smart platform to streamline ready-to-fill processing. Competitive differentiation now centres on surface coatings and smart caps that monitor adherence.
Beverages commanded 54.10% share in 2025 thanks to entrenched glass preferences in beer, wine, and spirits. Craft labels choose flint bottles to showcase colour and carbonation. Non-alcoholic drinks such as premium juices and dairy blends also lean on glass for flavour integrity. The glass packaging market share held by beverages is expected to persist as premium SKUs outgrow mass brands.
Pharmaceuticals represent the fastest-growing vertical at 7.11% CAGR. Production of mRNA vaccines and GLP-1 injectables will push the glass packaging market size for pharma to new highs by 2031. Cosmetics, fragrances, and personal care lines turn to glass to communicate luxury while meeting recyclability goals. Food applications maintain baseline demand, particularly for sauces and gourmet condiments that benefit from product visibility.
Complete Report Scope:
- By Product Type
- Bottles and Jars
- Vials and Ampoules
- Others Product Types
- By Color
- Flint
- Amber
- Green
- Other Colors
- By Capacity
- Less than 200 ml
- 200-500 ml
- 500-1000 ml
- More than 1000 ml
- By End-Use Industry
- Food
- Beverage
- Alcoholic Beverage
- Beer
- Wine
- Spirits
- Other Alcoholic Beverages (Cider and Other Fermented Drinks)
- Non-Alcoholic Beverage
- Carbonated Soft Drinks
- Juices
- Dairy Product Based Drinks
- Other Non-Alcoholic Beverages
- Alcoholic Beverage
- Pharmaceuticals
- Cosmetics and Personal Care
- Other End-Use Indusry
- By Geography
- North America
- United States
- Canada
- Mexico
- Europe
- Germany
- United Kingdom
- France
- Italy
- Spain
- Russia
- Rest of Europe
- Asia-Pacific
- China
- India
- Japan
- South Korea
- Australia and New Zealand
- Rest of Asia-Pacific
- Middle East and Africa
- Middle East
- United Arab Emirates
- Saudi Arabia
- Turkey
- Rest of Middle East
- Africa
- South Africa
- Nigeria
- Egypt
- Rest of Africa
- Middle East
- South America
- Brazil
- Argentina
- Rest of South America
- North America
Geography Analysis
Europe controlled 37.75% of 2025 volume owing to a mature manufacturing base, stringent recycling targets, and entrenched wine and spirits culture. Verallia switched on the first fully electric furnace in Cognac, trimming CO2 by 60% and demonstrating the region's decarbonization leadership AGC Glass Europe recycled 700,000 tons of cullet during 2023, reinforcing circular-economy momentum. Stringent producer-responsibility directives tilt the regulatory field toward glass over certain plastics. Demand pulled back slightly in 2024 on softer beer volumes, yet innovation and premiumization keep value stable.
North America remains a pivotal market supported by craft beverages and biotech hubs. O-I Glass, the region's largest producer, is reviewing a 7% capacity cut by mid-2025 to align supply with demand shifts. Investments in electrification at Veauche and Alloa plants highlight the group's commitment to emission reductions. Regulatory incentives for recycled content and advanced manufacturing tax credits could accelerate modernization.
Asia-Pacific shows resilient growth despite temporary inventory overhangs in China. BG Container Glass posted USD 432 million revenue in 2023 and expects 4.7% CAGR through 2030. China's flat glass makers are pivoting toward photovoltaic and automotive markets, freeing capacity for container glass once demand rebounds. Rapid urbanization, new middle-class consumers, and the RTD boom all support long-term expansion of the glass packaging market.
The Middle East and Africa is set to record the strongest 7.67% CAGR through 2031, driven by infrastructure build-out and rising packaged-goods demand. Vitro plans USD 400 million of glass investments in Egypt to meet regional growth. HORN fired up a new furnace for Frigoglass in Nigeria, proving local capability gains. Government policies encouraging domestic manufacturing reduce import reliance and build supply-chain resilience.
South America delivers steady gains from beverage staples and improving recycling systems. Producers are exploring lightweight bottles to cut logistics costs across vast geographies. Altogether, geographic dynamics highlight how sustainability frameworks, energy prices, and consumer preferences create diverse regional trajectories.
- O-I Glass Inc. (Owens-Illinois)
- Ardagh Group
- Gerresheimer AG
- Wiegand-Glas GmbH
- Piramal Glass Pvt. Ltd.
- Hindustan National Glass & Industries Ltd.
- Verallia Deutschland AG
- SGD Pharma
- WestPack LLC
- Berlin Packaging LLC
- SGD Kipfenberg GmbH
- HEINZ-GLAS GmbH & Co. KGaA
- BA Glass Germany GmbH
- AGI glaspac
- Glashutte Freital GmbH
- KP Glas GmbH & Co. KG
- San Miguel Yamamura Packaging Corporation
- Hung Phu Glass Joint Stock Company (HuphuMeglass)
- Vietnam Nashley Technology Joint Stock Company
- Feemio Group Co., Ltd.
- Pavico Packaging Company Limited
- SCHOTT Pharma (SCHOTT Group)
- Pharma-Q Holdings (Pty) Ltd.
- Nurrin Pharmalab
- Stevanato Group Spa
- Corning Incorporated
- Kapoor Glass India Pvt. Ltd.
- Neelam Global Pvt. Ltd
- Khemka Glass
- Amputech Industry
- Stevanato Group
- Hindustan Glass Works
Additional Benefits:
- The market estimate (ME) sheet in Excel format
- 3 months of analyst support
TABLE OF CONTENTS
1 INTRODUCTION
- 1.1 Study Assumptions and Market Definition
- 1.2 Scope of the Study
2 RESEARCH METHODOLOGY
3 EXECUTIVE SUMMARY
4 MARKET LANDSCAPE
- 4.1 Market Overview
- 4.2 Market Drivers
- 4.2.1 Craft beer and premium spirits surge, fueling the demand for glass bottles
- 4.2.2 mRNA and vector-vaccine rollout boosting pharma glass vials globally
- 4.2.3 Increasing Demand from the Cosmetics Industry for Premium Packaging
- 4.2.4 RTD coffee and functional drinks uptake in Asia spurring lightweight glass bottles
- 4.2.5 Multifaceted Advantages of Container Glass Increasing Its Popularity
- 4.3 Market Restraints
- 4.3.1 Availability of Alternative Solutions
- 4.3.2 Shortage of pharma-grade borosilicate tubing limits vial supply
- 4.3.3 Higher Carbon Footprint Glass Manufacturing Hampers Market Growth
- 4.4 Supply-Chain Analysis
- 4.5 Industry Standards and Regulations for Glass Packaging
- 4.6 Export - Import Data (Under Relevant Hs Code)
- 4.7 Recycling Trends for Glass Packaging
- 4.8 Raw Material Analysis
- 4.9 Demand vs. Supply Analysis for Glass Packaging
- 4.10 Porter's Five Forces Analysis
- 4.10.1 Bargaining Power of Suppliers
- 4.10.2 Bargaining Power of Buyers
- 4.10.3 Threat of New Entrants
- 4.10.4 Threat of Substitute Products
- 4.10.5 Intensity of Competitive Rivalry
5 MARKET SIZE AND GROWTH FORECASTS (VOLUME)
- 5.1 By Product Type
- 5.1.1 Bottles and Jars
- 5.1.2 Vials and Ampoules
- 5.1.3 Others Product Types
- 5.2 By Color
- 5.2.1 Flint
- 5.2.2 Amber
- 5.2.3 Green
- 5.2.4 Other Colors
- 5.3 By Capacity
- 5.3.1 Less than 200 ml
- 5.3.2 200-500 ml
- 5.3.3 500-1000 ml
- 5.3.4 More than 1000 ml
- 5.4 By End-Use Industry
- 5.4.1 Food
- 5.4.2 Beverage
- 5.4.2.1 Alcoholic Beverage
- 5.4.2.1.1 Beer
- 5.4.2.1.2 Wine
- 5.4.2.1.3 Spirits
- 5.4.2.1.4 Other Alcoholic Beverages (Cider and Other Fermented Drinks)
- 5.4.2.2 Non-Alcoholic Beverage
- 5.4.2.2.1 Carbonated Soft Drinks
- 5.4.2.2.2 Juices
- 5.4.2.2.3 Dairy Product Based Drinks
- 5.4.2.2.4 Other Non-Alcoholic Beverages
- 5.4.2.1 Alcoholic Beverage
- 5.4.3 Pharmaceuticals
- 5.4.4 Cosmetics and Personal Care
- 5.4.5 Other End-Use Indusry
- 5.5 By Geography
- 5.5.1 North America
- 5.5.1.1 United States
- 5.5.1.2 Canada
- 5.5.1.3 Mexico
- 5.5.2 Europe
- 5.5.2.1 Germany
- 5.5.2.2 United Kingdom
- 5.5.2.3 France
- 5.5.2.4 Italy
- 5.5.2.5 Spain
- 5.5.2.6 Russia
- 5.5.2.7 Rest of Europe
- 5.5.3 Asia-Pacific
- 5.5.3.1 China
- 5.5.3.2 India
- 5.5.3.3 Japan
- 5.5.3.4 South Korea
- 5.5.3.5 Australia and New Zealand
- 5.5.3.6 Rest of Asia-Pacific
- 5.5.4 Middle East and Africa
- 5.5.4.1 Middle East
- 5.5.4.1.1 United Arab Emirates
- 5.5.4.1.2 Saudi Arabia
- 5.5.4.1.3 Turkey
- 5.5.4.1.4 Rest of Middle East
- 5.5.4.2 Africa
- 5.5.4.2.1 South Africa
- 5.5.4.2.2 Nigeria
- 5.5.4.2.3 Egypt
- 5.5.4.2.4 Rest of Africa
- 5.5.4.1 Middle East
- 5.5.5 South America
- 5.5.5.1 Brazil
- 5.5.5.2 Argentina
- 5.5.5.3 Rest of South America
- 5.5.1 North America
6 COMPETITIVE LANDSCAPE
- 6.1 Market Concentration
- 6.2 Strategic Moves and Developments
- 6.3 Market Share Analysis
- 6.4 Company Profiles (includes Global level Overview, Market level overview, Core Segments, Financials as available, Strategic Information, Market Rank/Share for key companies, Products and Services, and Recent Developments)
- 6.4.1 O-I Glass Inc. (Owens-Illinois)
- 6.4.2 Ardagh Group
- 6.4.3 Gerresheimer AG
- 6.4.4 Wiegand-Glas GmbH
- 6.4.5 Piramal Glass Pvt. Ltd.
- 6.4.6 Hindustan National Glass & Industries Ltd.
- 6.4.7 Verallia Deutschland AG
- 6.4.8 SGD Pharma
- 6.4.9 WestPack LLC
- 6.4.10 Berlin Packaging LLC
- 6.4.11 SGD Kipfenberg GmbH
- 6.4.12 HEINZ-GLAS GmbH & Co. KGaA
- 6.4.13 BA Glass Germany GmbH
- 6.4.14 AGI glaspac
- 6.4.15 Glashutte Freital GmbH
- 6.4.16 KP Glas GmbH & Co. KG
- 6.4.17 San Miguel Yamamura Packaging Corporation
- 6.4.18 Hung Phu Glass Joint Stock Company (HuphuMeglass)
- 6.4.19 Vietnam Nashley Technology Joint Stock Company
- 6.4.20 Feemio Group Co., Ltd.
- 6.4.21 Pavico Packaging Company Limited
- 6.4.22 SCHOTT Pharma (SCHOTT Group)
- 6.4.23 Pharma-Q Holdings (Pty) Ltd.
- 6.4.24 Nurrin Pharmalab
- 6.4.25 Stevanato Group Spa
- 6.4.26 Corning Incorporated
- 6.4.27 Kapoor Glass India Pvt. Ltd.
- 6.4.28 Neelam Global Pvt. Ltd
- 6.4.29 Khemka Glass
- 6.4.30 Amputech Industry
- 6.4.31 Stevanato Group
- 6.4.32 Hindustan Glass Works
7 MARKET OPPORTUNITIES AND FUTURE OUTLOOK
- 7.1 White-space and Unmet-need Assessment

 佛羅倫薩方形罐市場規模、佔有率和成長分析:按材質、容量、蓋子類型、應用、最終用戶和地區分類——2026-2033年行業預測
 玻璃包裝市場分析及預測(至2035年):依類型、產品、技術、組件、應用、材料類型、製程、最終用戶、功能及解決方案分類
 印度玻璃包裝市場:市場佔有率分析、產業趨勢與統計及成長預測(2026-2031)
 棕色玻璃包裝市場:全球市場預測(2026-2032 年)玻璃包裝市場:按包裝類型、玻璃類型、製造流程、產能、應用和分銷管道分類-全球市場預測(2026-2032 年)
 2026-2034年全球食品飲料玻璃包裝市場規模、佔有率、趨勢和成長分析報告
 復古相機市場:全球產業規模、市場佔有率、趨勢、機會和預測(按類型、狀況、分銷管道和地區分類)、競爭格局(2021-2031 年)
 食品飲料玻璃包裝市場規模、佔有率和趨勢分析報告:按產品類型、產能、最終用途、地區和細分市場預測(2026-2033 年)
 玻璃包裝市場報告:按產品、最終用戶和地區分類(2026-2034 年)
 玻璃包裝市場:按類型、終端用戶行業和地區分類