


 |
市場調查報告書
商品編碼
2121694
光纖壓力感測器:市場佔有率分析、產業趨勢與統計、成長預測(2026-2031)Fiber Optic Pressure Sensors - Market Share Analysis, Industry Trends & Statistics, Growth Forecasts (2026 - 2031) |
||||||

※ 本網頁內容可能與最新版本有所差異。詳細情況請與我們聯繫。
據 Mordor Intelligence 稱,2025 年光纖壓力感測器市值為 38 億美元,預計到 2031 年將達到 64.8 億美元,而 2026 年為 41.5 億美元,預測期(2026-2031 年)的複合年成長率為 9.29%。
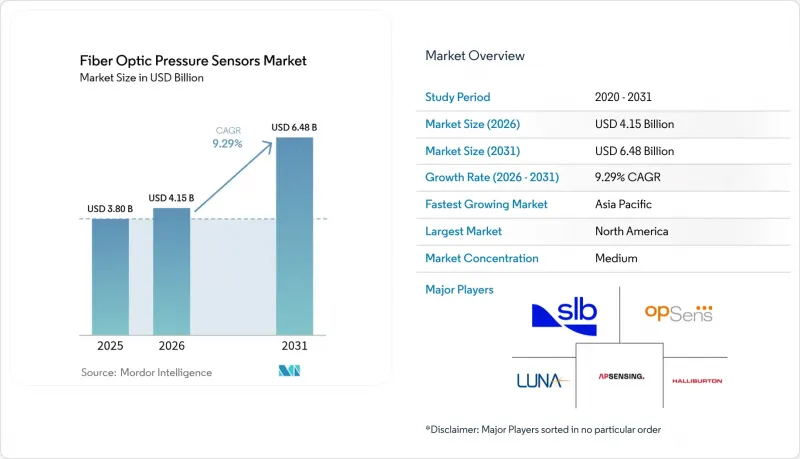
本報告按類型(有線、無線)、技術(法布里-珀羅干涉儀、光纖布拉格光柵、其他)、應用(石油天然氣、工業自動化、醫療保健及醫療設備、其他)、部署環境(地下、工業地面設施、體內及生物醫學、其他)及地區進行細分。市場預測以美元計價。
全球光纖壓力感測器市場趨勢及洞察
法布里-珀羅型MEMS共振器的快速小型化
大規模微影術技術能夠實現小於10微米的腔體尺寸,同時保持±0.01%的滿量程精度。這項突破使得在空間受限的醫療設備中檢測低至2 kPa的低壓成為可能,其靈敏度比傳統聚合物感測器高出80%。透過採用矽光電製程進行晶圓級整合,腔體小型化縮短了響應時間並降低了單位成本。目前,這些小型化感測器已被應用於心血管導管監測、航太領域高速執行器的回饋以及嵌入式電池單元的診斷,且不會影響結構完整性。隨著產量的增加,光纖壓力感測器市場的有線和無線部分都將受益於更低的單通道價格和更高的性能。
降低分散式光纖檢測設備的成本
自2020年以來,矽光電的整合已使檢測設備的成本降低了約60%,使得亞奈米波長解析度在典型的工業預算範圍內成為可能。目前,即使是低成本的設備也能達到2.5µε的精度和小於1秒的反應時間,加速了結構完整性監測在橋樑、隧道和管道等領域的應用。中國以11.3%的市佔率引領全球應用,展現了其在大規模智慧工廠部署的成本競爭力。邊緣分析韌體進一步降低了數據回程傳輸的需求,提升了遠端資產的提案,並加速了光纖壓力感測器市場的整體普及。
與壓阻式感測器相比,平均售價更高。
尤其是在預算仍然緊張的多感測器工業自動化專案中,單位成本仍然高出兩到三倍。與簡單的應變計式壓力感測器相比,專用感測硬體會推高資本成本。然而,隨著初始成本在整個資產生命週期內因腐蝕性和高溫環境下維護成本的降低而得到抵消,分階段更換正在逐步推進。隨著矽光電的規模化應用,預計到2028年,大規模生產線上的價格差異將縮小到幾乎相同的水平,從而緩解光纖壓力感測器市場面臨的這一限制。
細分市場分析
到2025年,有線設備將佔銷售額的72.20%,鞏固其在地下竣工設備、管道走廊和工業爐等高可靠性資產中的地位。隨著煉油廠維修和LNG接收站的擴建,有線光纖壓力感測器的市場規模預計將穩定成長。即使在無線傳輸不穩定的環境中,實體連接也能確保訊號在長達數公里的光纖電纜全程範圍內保持完整性。
無線節點以11.6%的複合年成長率成長,解決了佈線會帶來重量、複雜性或安全隱患的安裝難題。無電池的非同步讀取被動標籤正被應用於植入式醫療設備、電池組和旋轉機械。超低功耗光學感測設備成本的持續下降,使得目標客戶群不再局限於早期用戶,從而推動了整個光纖壓力感測器市場的需求成長。
由於其亞毫巴級解析度和在200 度C下的穩定性,法布里-珀羅感測器佔據了46.40%的銷售佔有率。其目前尺寸小於10微米的微腔設計,使其能夠整合到皮下注射針和狹窄的地質鑽孔中,進一步鞏固了主導地位。
同時,光纖布拉格光柵(FBG)陣列預計將以12.9%的複合年成長率(CAGR)實現最快成長。透過在單一光纖上復用數百個光柵,FBG陣列降低了結構完整性監測和長距離管道工程中每個點的成本。高速解調器可實現±1pm的穩定性,進而改善抗震建築的監測和高層建築的風荷載分析。隨著檢測成本的降低和FBG應用的增加,法布里-珀羅干涉儀的主導地位將減弱,而光纖壓力感測器市場的潛在總收入預計將會成長。
區域分析
預計到2025年,北美將成為領先地區,佔全球銷售額的37.50%。頁岩天然氣田嚴格的安全標準和電動車電池工廠的擴張是推動這一趨勢的重要因素。聯邦政府對先進製造業的激勵措施以及大型油田服務公司的存在,促進了原型產品的快速開發和早期商業化。此外,航太計畫中用於飛行關鍵系統的光學壓力計的應用,進一步鞏固了該地區在光纖壓力感測器市場的創新優勢。
預計到2031年,亞太地區將以11.7%的複合年成長率實現最高成長。中國在全球分散式感測部署中佔11.3%的佔有率,凸顯了政府主導的智慧工廠發展策略。日本主要精密汽車製造商正在將光學感測器整合到電池冷卻迴路中,而在印度,煉油廠的擴張推動了對高溫測量設備需求的成長。矽光電的區域成本優勢正在加速感測設備的生產,擴大國內供應,並促進光纖壓力感測器市場的整體成長。
在歐洲,基於汽車製造、石油化工加工和離岸風力發電的應用,光纖感測器正穩步普及。德國在全球光纖感測器部署中佔據9.4%的佔有率,體現了其在工業自動化領域的長期領先地位。英國海底業者正在採用濕式光纖連接器,以滿足北海地區大量新增設備延壽計畫的需求。在法國航太領域,用於即時結構診斷的光學陣列的日益普及,正推動著整個光纖壓力感測器市場的穩定成長。
其他好處
- Excel格式的市場預測(ME)表
- 3個月的分析師支持
目錄
第1章:引言
- 調查假設和市場定義
- 調查範圍
第2章:調查方法
第3章執行摘要
第4章 市場狀況
- 市場概覽
- 市場促進因素
- 法布里-珀羅型MEMS共振器的快速小型化
- 降低分散式光纖檢測設備的成本
- 與原始設備製造商合作,制定電動車電池組的熱失控安全措施
- 地下礦場(石油和天然氣產業)的強制性數位化目標
- 智慧工廠中的邊緣分析(媒體報告不足)
- 植入式智慧導管的研發經費激增(未充分通報)。
- 市場限制因素
- 與壓阻式感測器相比,平均售價更高。
- 潛水艇系統連接器標準化滯後
- 光纖通訊領域合格技術人員短缺(媒體通報不足)
- 微腔設計相關的智慧財產權分散問題(媒體通報不足)
- 價值供應鏈分析
- 監理情勢
- 技術展望
- 波特五力分析
第5章 市場規模與成長預測
- 按類型
- 有線
- 無線的
- 透過技術
- 法布里·佩羅
- 光纖布拉格光柵
- 實力基礎
- 其他
- 透過使用
- 石油和天然氣
- 工業自動化
- 醫療保健和醫療設備
- 汽車與出行
- 家用電子產品
- 石油化工
- 其他
- 按部署環境
- 地下/礦井內部
- 工業地面設施
- 體內/生物醫學
- 航太/無人機
- 海洋/海底結構
- 按地區
- 北美洲
- 美國
- 加拿大
- 歐洲
- 英國
- 德國
- 法國
- 俄羅斯
- 其他歐洲國家
- 亞太地區
- 中國
- 印度
- 日本
- 其他亞太國家
- 南美洲
- 巴西
- 阿根廷
- 其他南美國家
- 中東和非洲
- 海灣合作理事會國家
- 土耳其
- 南非
- 其他中東和非洲國家
- 北美洲
第6章 競爭情勢
- 市場集中度
- 策略趨勢
- 市佔率分析
- 公司簡介
- AP Sensing GmbH
- Baker Hughes Company
- Halliburton Company
- Honeywell International Inc.
- Infineon Technologies AG
- Luna Innovations Incorporated(含 FISO Technologies)
- NXP Semiconductors NV
- Omron Corporation
- Opsens Inc.
- Panasonic Holdings Corporation
- Pressure Profile Systems Inc.
- Robert Bosch GmbH
- Schlumberger Limited(SLB)
- STMicroelectronics NV
- Texas Instruments Incorporated
- Yokogawa Electric Corporation
- ABB Ltd.
- Broadcom Inc.
- Rockwell Automation Inc.
- Sumitomo Electric Industries Ltd.
第7章 市場機會與未來展望
According to Mordor Intelligence, the fiber optic pressure sensors market size was valued at USD 3.8 billion in 2025 and estimated to grow from USD 4.15 billion in 2026 to reach USD 6.48 billion by 2031, at a CAGR of 9.29% during the forecast period (2026-2031).
This report is Segmented by Type (Wired, Wireless), Technology (Fabry-Perot, Fiber Bragg Grating, and More), Application (Oil & Gas, Industrial Automation, Healthcare & Medical Devices, and More), Installation Environment (Down-hole/Sub-surface, Industrial Surface Plants, In-vivo/Biomedical, and More), and Geography. The Market Forecasts are Provided in Terms of Value (USD).
Global Fiber Optic Pressure Sensors Market Trends and Insights
Rapid Miniaturization of Fabry-Perot MEMS Cavities
Mass-production lithography now delivers cavity dimensions below 10 µm while preserving +-0.01% full-scale accuracy. This leap enables pressure detection as low as 2 kPa in space-constrained medical devices, outperforming conventional polymer sensors by 80% sensitivity. Smaller cavities shorten response times and lower unit cost through wafer-level integration that follows silicon-photonics process flows. Miniature sensors now support catheter-based cardiovascular monitoring, high-speed aerospace actuation feedback, and embedded battery-cell diagnostics without compromising structural integrity. As production volumes climb, the wired and wireless segments of the fiber optic pressure sensors market both benefit from higher performance at reduced price per channel.
Cost-Down of Distributed Fiber-Optic Interrogation Units
The integration of silicon photonics has trimmed interrogation-unit pricing by roughly 60% since 2020, placing sub-nanometer wavelength resolution within reach of routine industrial budgets. Low-cost units now achieve 2.5 µε accuracy and sub-1 s response time, accelerating structural-health-monitoring adoption in bridges, tunnels, and pipelines. China leads global deployments with 11.3% share, validating cost competitiveness in large-scale smart-factory rollouts. Edge-analytics firmware further reduces data-backhaul needs, strengthening the value proposition in remote assets and boosting overall uptake of the fiber optic pressure sensors market.
High ASP Versus Piezo-Resistive Sensors
A 2-3 X unit-price premium persists, particularly in multi-sensor industrial automation projects where budget ceilings remain strict. Specialized interrogation hardware inflates capital cost compared to simple strain-gauge conditioners. Yet maintenance savings in corrosive or high-temperature sites offset initial spend over asset life cycles, encouraging gradual substitution. Silicon-photonics scale-up is expected to shrink the gap to near parity in high-volume lines by 2028, easing this restraint on the fiber optic pressure sensors market.
Other drivers and restraints analyzed in the detailed report include:
- OEM Integration in EV Battery-Pack Thermal-Runaway Safety
- Mandatory Down-Hole Digitalization Targets in Oil & Gas
- Connector Standardization Lag in Subsea Systems
For complete list of drivers and restraints, kindly check the Table Of Contents.
Segment Analysis
Wired devices represented 72.20% of revenue in 2025, cementing their role in high-integrity assets such as downhole completions, pipeline corridors, and industrial furnaces. The fiber optic pressure sensors market size for wired units is projected to rise steadily alongside refinery upgrades and LNG terminal expansions. Physical connectivity guarantees signal integrity across kilometers of fiber in environments where wireless propagation is unreliable.
Wireless nodes, growing at a 11.6% CAGR, address installations where cabling adds weight, complexity, or safety risk. Implantable medical devices, battery cells, and rotating machinery capitalize on battery-free passive tags interrogated asynchronously. Continuous cost declines in ultra-low-power optical interrogators widen the addressable base beyond early adopters, lifting overall demand within the broader fiber optic pressure sensors market..
Fabry-Perot sensors held 46.40% revenue share thanks to sub-milli-bar resolution and robustness at 200 °C. Their micro-cavity designs, now below 10 µm, allow integration in hypodermic needles and narrow geological perforations, reinforcing leadership within the fiber optic pressure sensors market share.
FBG arrays, however, will expand the fastest at 12.9% CAGR. A single fiber multiplexes hundreds of gratings, trimming per-point cost for structural-health-monitoring and long-haul pipeline projects. High-speed demodulators achieve +-1 pm stability, enhancing earthquake-resilient building surveillance and high-rise wind-load analysis. As interrogation costs fall, FBG uptake moderates Fabry-Perot dominance while enlarging total addressable revenue for the fiber optic pressure sensors market.
Complete Report Scope:
- By Type
- Wired
- Wireless
- By Technology
- Fabry-Perot
- Fiber Bragg Grating
- Intensity-Based
- Other Technologies
- By Application
- Oil and Gas
- Industrial Automation
- Healthcare and Medical Devices
- Automotive and Mobility
- Consumer Electronics
- Petrochemical
- Other Applications
- By Installation Environment
- Down-hole / Sub-surface
- Industrial Surface Plants
- In-vivo / Biomedical
- Aerospace and UAV
- Marine and Subsea Structures
- By Geography
- North America
- United States
- Canada
- Europe
- United Kingdom
- Germany
- France
- Russia
- Rest of Europe
- Asia-Pacific
- China
- India
- Japan
- Rest of Asia-Pacific
- South America
- Brazil
- Argentina
- Rest of South America
- Middle East and Africa
- GCC Countries
- Turkey
- South Africa
- Rest of Middle East and Africa
- North America
Geography Analysis
North America led with 37.50% revenue in 2025, supported by rigorous safety codes across shale plays and expanding EV battery plants. Federal incentives for advanced manufacturing and the presence of oilfield service majors foster rapid prototyping and early commercial launches. Aerospace programs also adopt optical gauges for flight-critical systems, reinforcing the region's innovation edge within the fiber optic pressure sensors market.
Asia-Pacific posts the strongest 11.7% CAGR to 2031. China's 11.3% share of global distributed sensing deployments evidences government-driven smart-factory rollouts. Japan's precision automotive giants integrate optical sensors in battery cooling loops, while India's refinery expansions demand high-temperature gauging. Regional cost advantages in silicon photonics accelerate interrogation-unit output, broadening domestic availability and stimulating overall growth in the fiber optic pressure sensors market.
Europe records stable uptake anchored in automotive manufacturing, petrochemical processing, and offshore wind. Germany's 9.4% share of global optical deployments reflects long-standing leadership in industrial automation. United Kingdom subsea operators embrace wet-mate optical connectors for a new wave of North Sea life-extension projects. France's aerospace sector increasingly favors optical arrays for real-time structural diagnostics, adding to steady momentum across the fiber optic pressure sensors market.
- AP Sensing GmbH
- Baker Hughes Company
- Halliburton Company
- Honeywell International Inc.
- Infineon Technologies AG
- Luna Innovations Incorporated (incl. FISO Technologies)
- NXP Semiconductors N.V.
- Omron Corporation
- Opsens Inc.
- Panasonic Holdings Corporation
- Pressure Profile Systems Inc.
- Robert Bosch GmbH
- Schlumberger Limited (SLB)
- STMicroelectronics N.V.
- Texas Instruments Incorporated
- Yokogawa Electric Corporation
- ABB Ltd.
- Broadcom Inc.
- Rockwell Automation Inc.
- Sumitomo Electric Industries Ltd.
Additional Benefits:
- The market estimate (ME) sheet in Excel format
- 3 months of analyst support
TABLE OF CONTENTS
1 INTRODUCTION
- 1.1 Study Assumptions and Market Definition
- 1.2 Scope of the Study
2 RESEARCH METHODOLOGY
3 EXECUTIVE SUMMARY
4 MARKET LANDSCAPE
- 4.1 Market Overview
- 4.2 Market Drivers
- 4.2.1 Rapid miniaturisation of Fabry-Perot MEMS cavities
- 4.2.2 Cost-down of distributed fiber-optic interrogation units
- 4.2.3 OEM integration in EV battery-pack thermal-runaway safety
- 4.2.4 Mandatory down-hole digitalisation targets (OandG)
- 4.2.5 Edge-analytics in smart factories (under-reported)
- 4.2.6 Implantable smart-catheter RandD funding spike (under-reported)
- 4.3 Market Restraints
- 4.3.1 High ASP vs piezo-resistive sensors
- 4.3.2 Connector standard-isation lag in subsea systems
- 4.3.3 Scarcity of opto-qualified technicians (under-reported)
- 4.3.4 IP fragmentation around micro-cavity designs (under-reported)
- 4.4 Value / Supply-Chain Analysis
- 4.5 Regulatory Landscape
- 4.6 Technological Outlook
- 4.7 Porter's Five Forces Analysis
- 4.7.1 Threat of New Entrants
- 4.7.2 Bargaining Power of Buyers
- 4.7.3 Bargaining Power of Suppliers
- 4.7.4 Threat of Substitutes
- 4.7.5 Intensity of Rivalry
5 MARKET SIZE and GROWTH FORECASTS (VALUE)
- 5.1 By Type
- 5.1.1 Wired
- 5.1.2 Wireless
- 5.2 By Technology
- 5.2.1 Fabry-Perot
- 5.2.2 Fiber Bragg Grating
- 5.2.3 Intensity-Based
- 5.2.4 Other Technologies
- 5.3 By Application
- 5.3.1 Oil and Gas
- 5.3.2 Industrial Automation
- 5.3.3 Healthcare and Medical Devices
- 5.3.4 Automotive and Mobility
- 5.3.5 Consumer Electronics
- 5.3.6 Petrochemical
- 5.3.7 Other Applications
- 5.4 By Installation Environment
- 5.4.1 Down-hole / Sub-surface
- 5.4.2 Industrial Surface Plants
- 5.4.3 In-vivo / Biomedical
- 5.4.4 Aerospace and UAV
- 5.4.5 Marine and Subsea Structures
- 5.5 By Geography
- 5.5.1 North America
- 5.5.1.1 United States
- 5.5.1.2 Canada
- 5.5.2 Europe
- 5.5.2.1 United Kingdom
- 5.5.2.2 Germany
- 5.5.2.3 France
- 5.5.2.4 Russia
- 5.5.2.5 Rest of Europe
- 5.5.3 Asia-Pacific
- 5.5.3.1 China
- 5.5.3.2 India
- 5.5.3.3 Japan
- 5.5.3.4 Rest of Asia-Pacific
- 5.5.4 South America
- 5.5.4.1 Brazil
- 5.5.4.2 Argentina
- 5.5.4.3 Rest of South America
- 5.5.5 Middle East and Africa
- 5.5.5.1 GCC Countries
- 5.5.5.2 Turkey
- 5.5.5.3 South Africa
- 5.5.5.4 Rest of Middle East and Africa
- 5.5.1 North America
6 COMPETITIVE LANDSCAPE
- 6.1 Market Concentration
- 6.2 Strategic Moves
- 6.3 Market Share Analysis
- 6.4 Company Profiles (includes Global level Overview, Market level overview, Core Segments, Financials as available, Strategic Information, Market Rank/Share for key companies, Products and Services, and Recent Developments)
- 6.4.1 AP Sensing GmbH
- 6.4.2 Baker Hughes Company
- 6.4.3 Halliburton Company
- 6.4.4 Honeywell International Inc.
- 6.4.5 Infineon Technologies AG
- 6.4.6 Luna Innovations Incorporated (incl. FISO Technologies)
- 6.4.7 NXP Semiconductors N.V.
- 6.4.8 Omron Corporation
- 6.4.9 Opsens Inc.
- 6.4.10 Panasonic Holdings Corporation
- 6.4.11 Pressure Profile Systems Inc.
- 6.4.12 Robert Bosch GmbH
- 6.4.13 Schlumberger Limited (SLB)
- 6.4.14 STMicroelectronics N.V.
- 6.4.15 Texas Instruments Incorporated
- 6.4.16 Yokogawa Electric Corporation
- 6.4.17 ABB Ltd.
- 6.4.18 Broadcom Inc.
- 6.4.19 Rockwell Automation Inc.
- 6.4.20 Sumitomo Electric Industries Ltd.
7 MARKET OPPORTUNITIES AND FUTURE OUTLOOK
- 7.1 White-space and Unmet-Need Assessment

 流體壓力感測器市場:按類型、最終用途、技術、應用、國家和地區分類-全球產業分析、市場規模、市場佔有率及2026年至2033年預測
 全球壓力感測器市場規模、佔有率、趨勢和成長分析報告(2026-2034年)
 2026年全球無塵室差壓表市場報告壓阻式壓力感測器市場報告:趨勢、預測及競爭分析(至2035年)
 中國壓力感測器:市場佔有率分析、產業趨勢與統計及成長預測(2026-2031)
 壓力感測器市場-2026-2032年全球市場預測
 壓力感測器市場規模、佔有率、趨勢和預測:按產品、類型、技術、應用和地區分類,2026-2034年2026年全球壓電壓力感測器市場報告差壓密度計市場:依產品類型、通訊協定、精確度等級及最終用途產業分類-全球預測,2026-2032年差壓式線上密度計市場:按安裝類型、精度等級、輸出類型、最終用戶產業和應用分類-全球預測,2026-2032年