


 |
市場調查報告書
商品編碼
2121686
生質乙醇:市場佔有率分析、產業趨勢與統計、成長預測(2026-2031)Bioethanol - Market Share Analysis, Industry Trends & Statistics, Growth Forecasts (2026 - 2031) |
||||||

※ 本網頁內容可能與最新版本有所差異。詳細情況請與我們聯繫。
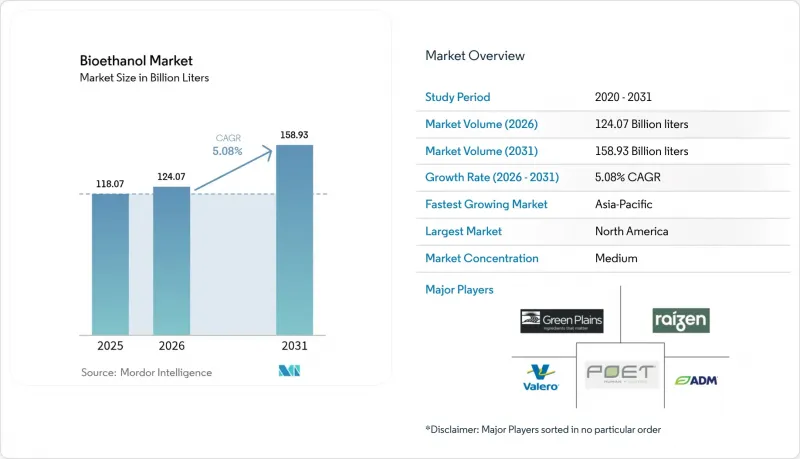
據 Mordor Intelligence 稱,2025 年生質乙醇市場價值為 1,180.7 億公升,預計到 2031 年將達到 1,589.3 億公升,而 2026 年為 1,240.7 億公升,預測期(2026-2031 年)的複合年成長率為 5.08%。
本報告按原料類型(甘蔗、玉米、小麥及其他原料)、應用領域(汽車及交通運輸、食品飲料、醫藥、化妝品及個人護理及其他應用領域)和地區(亞太地區、北美地區、歐洲地區、南美地區以及中東和非洲地區)進行細分。市場預測以公升為單位。
全球生質乙醇市場趨勢與洞察
強制摻混E10-E20燃料在全球的正面影響
強化摻混義務正在創造可預測的基本負載需求,使生質乙醇市場對原油價格波動的敏感度降低,同時鞏固產能擴張。日本全國推廣E10汽油並試行E20汽油,巴西27%的摻混比例上限柔軟性,以及印度加速推進30%的目標,都促進了年度摻混量的成長,並刺激了對新工廠的投資。監管機構透過燃料品質標準、國內產品使用規則和進口限制來提高合規性,確保摻混目標轉化為實際供應,而不僅僅是紙面上的積分。這些政策使生質乙醇市場成為國家能源安全戰略的重要組成部分,即便在電氣化進程不斷推進的情況下也是如此。
煉油廠面臨的碳減排和ESG壓力
面對投資者的密切關注和日益嚴格的碳排放標準,煉油商如今將低碳生質乙醇視為戰略差異化優勢,而不僅僅是合規要素。加州修訂後的2024年低碳燃料標準(LCFS)收緊了碳排放標準,並優先考慮通過ISCC等認證體系認證的供應。歐盟修訂後的可再生能源指令也同樣優先考慮來自可追溯和永續來源的乙醇。為此,像BP這樣的公司透過斥資14億美元收購邦吉生物能源公司,實現了上游業務的垂直整合,從而一步到位地完成了原料採購和全生命週期排放管理。在可再生燃料摻混比例超過強制性最低標準的市場,溢價需求正在湧現,為低碳生產商維持了有利的價格利潤空間。
小型汽車的快速電氣化
隨著電動車的快速普及,主要市場對汽油的需求上限正在縮小。在挪威,電動車在新車銷售的滲透率將在2024年達到94%,在中國也將超過35%。國際能源總署(IEA)預測,到2030年,電動車將佔全球輕型汽車市場的30%。因此,煉油商面臨混合燃料供應減少的困境,生質乙醇生產商被迫將重心轉向航空燃料、重型運輸車輛以及出口主導策略。新興經濟體汽車電氣化進程的緩慢意味著區域需求仍然分散,這為生質乙醇市場的地理多元化提供了機會。
細分市場分析
生質乙醇%。這得歸功於美國中西部和巴西馬托格羅索州不斷擴大的生產規模,以及完善的鐵路和駁船物流網路。生產商正利用酵素技術的進步和產品特定用途(特別是將蒸餾殘渣用作動物飼料,將捕獲的二氧化碳用於飲料)來降低單位成本並提高碳排放評分。美國中西部地區對碳捕獲和地下儲存叢集的持續投資,進一步提升了生物乙醇生命週期性能的可靠性。
預計到2031年,小麥乙醇的複合年成長率將達到5.45%,成為主要原料中成長最快的。歐洲企業正利用獎勵實現國內穀物來源多元化,而澳洲小麥的豐收也創造了出口機會。蛋白質溢價的上漲使得小麥衍生殘渣對牲畜飼料生產商更具吸引力,抵消了澱粉成本上漲的影響。高密度發酵和分餾等技術的突破提高了植物的運轉率,並增強了小麥在生質乙醇市場的競爭力。
其他原料,如甘蔗、木薯和新興的木質纖維素原料,雖然供應量不大,但卻具有戰略意義,能夠有效對沖天氣導致的作物產量波動。巴西甘蔗透過甘蔗渣燃燒進行汽電共生,維持著結構性的成本優勢;而印尼尼帕棕櫚和墨西哥龍舌蘭的試點計畫則旨在利用邊際土地進行生產。這種多元化有助於緩解價格波動,並符合政策制定者減少糧食作物替代方案的壓力。
區域分析
預計到2025年,北美將繼續佔全球玉米乙醇產量的55.10%,這得益於其完善的玉米基礎設施、穩定的可再生燃料標準(RFS)目標以及各州低碳燃料舉措的支持。生產商正在整合碳捕獲、直接大氣捕獲和管道網路,以降低玉米乙醇的碳排放強度,並獲得進入高價值信貸市場的資格。加拿大正在充分利用其小麥和玉米原料產業叢集,而墨西哥不斷成長的需求正在吸收美國的部分出口,從而加強洲際貿易流量,並穩定區域平衡。
預計到2031年,亞太地區將以5.74%的複合年成長率實現最高成長,這主要得益於印度30%的生物乙醇摻混目標以及中國積極的進口意願,這將擴大消費量。亞太地區各國政府都將生質乙醇的推廣視為提高農村收入和節約外匯的途徑,並鼓勵對多元化生物煉製廠進行本地投資。泰國、菲律賓和越南正積極推動強制性生物乙醇摻混,以配合現代化計畫;而印尼則正在試驗利用尼帕棕櫚生產乙醇,以規避糧食作物供應的限制。
在歐洲,永續性認證是重中之重,符合嚴格溫室氣體減排標準的殘渣衍生乙醇更受青睞。德國和法國的配額制度構成了需求的基礎,而英國的《可再生運輸燃料強制令》(RTO)則優先考慮永續航空燃料(SAF),間接推動了從乙醇向噴射機燃料的轉變。以巴西主導的南美洲正在吸引外資,尤其是來自阿拉伯聯合大公國135億美元的投資承諾,並正在擴大甘蔗、玉米和汽電共生相結合的綜合資產。中東和非洲仍然是小眾市場,但在聯合國糧農組織(FAO)清潔烹飪解決方案計畫的推動下,持續成長。該計劃將乙醇定位為家庭的替代能源。
其他好處:
- Excel格式的市場預測(ME)表
- 3個月的分析師支持
目錄
第1章:引言
- 研究假設和市場定義
- 調查範圍
第2章:調查方法
第3章執行摘要
第4章 市場狀況
- 市場概覽
- 市場促進因素
- 強制摻混E10-E20燃料在全球的正面影響
- 煉油廠面臨減少碳排放和解決環境、社會及公司治理(ESG)問題的壓力。
- 美國玉米相對於巴西甘蔗的成本優勢。
- 辛烷值的需求帶動了乙醇作為芳香族化合物替代品的需求。
- 航空公司對從乙醇到噴射機燃料轉換路線的需求
- 市場限制因素
- 小型汽車的快速電氣化
- 圍繞著「糧食與燃料」和土地利用的爭論。
- 基於間接土地利用變化的更嚴格的碳強度評估標準
- 價值鏈分析
- 波特五力模型
第5章 市場規模與成長預測
- 依原料類型
- 甘蔗
- 玉米
- 小麥
- 其他成分
- 透過使用
- 汽車和運輸業
- 食品/飲料
- 製藥
- 化妝品和個人護理
- 其他用途(燃料電池、發電)
- 按地區
- 亞太地區
- 中國
- 印度
- 日本
- 韓國
- 其他亞太國家
- 北美洲
- 美國
- 加拿大
- 墨西哥
- 歐洲
- 德國
- 英國
- 法國
- 義大利
- 其他歐洲國家
- 南美洲
- 巴西
- 阿根廷
- 其他南美國家
- 中東和非洲
- 沙烏地阿拉伯
- 南非
- 其他中東和非洲國家
- 亞太地區
第6章 競爭情勢
- 市場集中度
- 策略趨勢
- 市佔率和排名分析
- 公司簡介
- Abengoa
- ADM
- Alto Ingredients Inc.
- Blue Biofuels Inc.
- BP plc
- Cenovus Energy
- Cristalco
- CropEnergies AG
- Ethanol Technologies
- GranBio Investimentos SA
- Green Plains Inc.
- Henan Tianguan Group Co. Ltd
- Jilin Fuel Ethanol Co. Ltd
- KWST
- Lantmannen
- POET LLC
- Raizen
- SEKAB
- SUNCOR Energy Inc.
- Tereos
- Valero
- VERBIO Vereinigte Bioenergie AG
第7章 市場機會與未來展望
According to Mordor Intelligence, the bioethanol market size was valued at 118.07 billion litres in 2025 and estimated to grow from 124.07 billion litres in 2026 to reach 158.93 billion litres by 2031, at a CAGR of 5.08% during the forecast period (2026-2031).
This report is Segmented by Feedstock Type (Sugarcane, Corn, Wheat, and Other Feedstock), Application (Automotive and Transportation, Food and Beverages, Pharmaceutical, Cosmetics and Personal Care, and Other Applications), and Geography (Asia-Pacific, North America, Europe, South America, and Middle-East and Africa). The Market Forecasts are Provided in Terms of Volume (Liters).
Global Bioethanol Market Trends and Insights
Favourable Global E10-E20 Blending Mandates
Strengthened blending requirements are creating predictable baseload demand that insulates the bioethanol market from crude price swings while locking in capacity expansion. Japan's nationwide E10 roll-out and pilot E20 zones, Brazil's 27% ceiling flexibility, and India's accelerated 30% target together lift annual offtake volumes and encourage new plant investment. Regulatory agencies back compliance through fuel-quality standards, domestic content rules, and import controls, ensuring blend targets translate into physical deliveries rather than paper credits. These policies turn the bioethanol market into a structural element of national energy security strategies even as electrification gains momentum.
Carbon-Reduction and ESG Pressure on Refiners
Refiners facing investor scrutiny and stringent carbon standards now view low-intensity bioethanol as a strategic differentiator instead of a mere compliance component. California's 2024 Low Carbon Fuel Standard update tightened carbon benchmarks, rewarding supplies certified under schemes such as ISCC. The EU's revised Renewable Energy Directive likewise privileges traceable, sustainably sourced ethanol. In response, companies like BP vertically integrated upstream via the USD 1.4 billion acquisition of Bunge Bioenergia, securing feedstock and lifecycle emission control in one step. Premium demand emerges in markets where renewable-content uptake exceeds mandate floors, sustaining price spreads favorable to lower-carbon producers.
Rapid Electrification of Light-Duty Vehicles
Soaring EV adoption trims gasoline demand ceilings in core markets. Norway hit 94% EV penetration for 2024 new car sales, China surpassed 35%, and the IEA forecasts a 30% global light-vehicle share by 2030. As a result, refiners face shrinking blend pools, compelling bioethanol producers to pivot toward aviation, heavy-duty transport, and export-led strategies. Regional demand divergence persists because emerging economies lag in vehicle electrification, creating opportunities for geographic diversification within the bioethanol market.
Other drivers and restraints analyzed in the detailed report include:
- Feedstock Cost Advantage in U.S. Corn and Brazil Sugarcane
- Octane Demand Spurring Ethanol as Aromatic Substitute
- Food-vs-Fuel and Land-Use Controversy
For complete list of drivers and restraints, kindly check the Table Of Contents.
Segment Analysis
Corn-based output contributed 58.12% of the bioethanol market size in 2025, anchored by the U.S. Midwest, Brazil's Mato Grosso expansion, and well-established rail and barge logistics. Producers leverage enzyme advances and co-product valorization, notably distillers' grains for livestock feed and captured CO2 for beverages, to compress unit costs and improve carbon scores. Continuing investments in carbon capture and underground storage clusters across the Midcontinent further enhance lifecycle performance credentials.
Wheat ethanol is projected to record a 5.45% CAGR through 2031, the fastest growth among mainstream feedstocks. European players harness policy incentives for domestic grain diversification, while Australia's bumper wheat cycles offer export opportunities. Rising protein premiums make wheat distillers' grains attractive to livestock feeders, offsetting higher starch costs. Technology breakthroughs enabling high-gravity fermentation and fractional distillation improve plant utilization rates, strengthening wheat's competitiveness within the bioethanol market.
Other feedstocks, such as sugarcane, cassava, and emerging lignocellulosic sources, supply niche but strategic volumes that hedge against weather-induced crop swings. Brazilian sugarcane retains a structural cost edge via bagasse-fired cogeneration, while Indonesia's nipa palm and Mexico's agave pilots aim to unlock marginal-land production. Such diversification dampens price volatility and aligns with policymakers' pressure to minimize food-crop displacement.
Complete Report Scope:
- By Feedstock Type
- Sugarcane
- Corn
- Wheat
- Other Feedstock
- By Application
- Automotive and Transportation
- Food and Beverages
- Pharmaceutical
- Cosmetics and Personal Care
- Other Applications (Fuel Cells, Power Generation)
- By Geography
- Asia-Pacific
- China
- India
- Japan
- South Korea
- Rest of Asia-Pacific
- North America
- United States
- Canada
- Mexico
- Europe
- Germany
- United Kingdom
- France
- Italy
- Rest of Europe
- South America
- Brazil
- Argentina
- Rest of South America
- Middle-East and Africa
- Saudi Arabia
- South Africa
- Rest of Middle-East and Africa
- Asia-Pacific
Geography Analysis
North America maintained 55.10% of global volume in 2025 thanks to entrenched corn infrastructure, stable Renewable Fuel Standard targets, and supportive state-level Low Carbon Fuel initiatives. Producers integrate carbon capture, direct air capture, and pipeline networks that compress the carbon intensity of corn ethanol, qualifying it for high-value credit markets. Canada leverages wheat and corn feedstock clusters, whereas Mexico's demand uptick absorbs U.S. exports, reinforcing continental trade flows that stabilize regional balance.
Asia-Pacific records the highest forecast CAGR at 5.74% through 2031 as India's 30% blend target and China's import appetite amplify consumption. Regional governments frame bioethanol expansion as rural income support and foreign-exchange savings, encouraging local investment in multi-feedstock biorefineries. Thailand, the Philippines, and Vietnam advance blend mandates aligned with agricultural modernization plans, while Indonesia pilots nipa-to-ethanol routes to sidestep food-crop constraints.
Europe emphasizes sustainability certification and favors residue-based ethanol that fulfills stringent greenhouse-gas savings thresholds. Quota systems in Germany and France anchor demand, and the United Kingdom's Renewable Transport Fuel Obligation prioritizes SAF, indirectly boosting ethanol-to-jet pathways. South America, dominated by Brazil, attracts foreign capital, notably the UAE's USD 13.5 billion commitment, to expand integrated assets that marry sugarcane, corn, and cogeneration. Middle East and Africa remain niche but rising, catalyzed by FAO programs for clean cooking solutions that position ethanol as a household energy alternative.
- Abengoa
- ADM
- Alto Ingredients Inc.
- Blue Biofuels Inc.
- BP p.l.c.
- Cenovus Energy
- Cristalco
- CropEnergies AG
- Ethanol Technologies
- GranBio Investimentos SA
- Green Plains Inc.
- Henan Tianguan Group Co. Ltd
- Jilin Fuel Ethanol Co. Ltd
- KWST
- Lantmannen
- POET LLC
- Raizen
- SEKAB
- SUNCOR Energy Inc.
- Tereos
- Valero
- VERBIO Vereinigte Bioenergie AG
Additional Benefits:
- The market estimate (ME) sheet in Excel format
- 3 months of analyst support
TABLE OF CONTENTS
1 Introduction
- 1.1 Study Assumptions and Market Definition
- 1.2 Scope of the Study
2 Research Methodology
3 Executive Summary
4 Market Landscape
- 4.1 Market Overview
- 4.2 Market Drivers
- 4.2.1 Favourable global E10-E20 blending mandates
- 4.2.2 Carbon-reduction and ESG pressure on refiners
- 4.2.3 Feedstock cost advantage in U.S. corn and Brazil sugarcane
- 4.2.4 Octane demand spurring ethanol as aromatic substitute
- 4.2.5 Airline demand for ethanol-to-jet SAF pathways
- 4.3 Market Restraints
- 4.3.1 Rapid electrification of light-duty vehicles
- 4.3.2 Food-vs-fuel and land-use controversy
- 4.3.3 Stricter ILUC-based carbon-intensity scoring
- 4.4 Value Chain Analysis
- 4.5 Porter's Five Forces
- 4.5.1 Bargaining Power of Suppliers
- 4.5.2 Bargaining Power of Buyers
- 4.5.3 Threat of New Entrants
- 4.5.4 Threat of Substitutes
- 4.5.5 Degree of Competition
5 Market Size and Growth Forecasts (Volume)
- 5.1 By Feedstock Type
- 5.1.1 Sugarcane
- 5.1.2 Corn
- 5.1.3 Wheat
- 5.1.4 Other Feedstock
- 5.2 By Application
- 5.2.1 Automotive and Transportation
- 5.2.2 Food and Beverages
- 5.2.3 Pharmaceutical
- 5.2.4 Cosmetics and Personal Care
- 5.2.5 Other Applications (Fuel Cells, Power Generation)
- 5.3 By Geography
- 5.3.1 Asia-Pacific
- 5.3.1.1 China
- 5.3.1.2 India
- 5.3.1.3 Japan
- 5.3.1.4 South Korea
- 5.3.1.5 Rest of Asia-Pacific
- 5.3.2 North America
- 5.3.2.1 United States
- 5.3.2.2 Canada
- 5.3.2.3 Mexico
- 5.3.3 Europe
- 5.3.3.1 Germany
- 5.3.3.2 United Kingdom
- 5.3.3.3 France
- 5.3.3.4 Italy
- 5.3.3.5 Rest of Europe
- 5.3.4 South America
- 5.3.4.1 Brazil
- 5.3.4.2 Argentina
- 5.3.4.3 Rest of South America
- 5.3.5 Middle-East and Africa
- 5.3.5.1 Saudi Arabia
- 5.3.5.2 South Africa
- 5.3.5.3 Rest of Middle-East and Africa
- 5.3.1 Asia-Pacific
6 Competitive Landscape
- 6.1 Market Concentration
- 6.2 Strategic Moves
- 6.3 Market Share (%)/Ranking Analysis
- 6.4 Company Profiles {(includes Global level Overview, Market level overview, Core Segments, Financials as available, Strategic Information, Market Rank/Share for key companies, Products and Services, and Recent Developments)}
- 6.4.1 Abengoa
- 6.4.2 ADM
- 6.4.3 Alto Ingredients Inc.
- 6.4.4 Blue Biofuels Inc.
- 6.4.5 BP p.l.c.
- 6.4.6 Cenovus Energy
- 6.4.7 Cristalco
- 6.4.8 CropEnergies AG
- 6.4.9 Ethanol Technologies
- 6.4.10 GranBio Investimentos SA
- 6.4.11 Green Plains Inc.
- 6.4.12 Henan Tianguan Group Co. Ltd
- 6.4.13 Jilin Fuel Ethanol Co. Ltd
- 6.4.14 KWST
- 6.4.15 Lantmannen
- 6.4.16 POET LLC
- 6.4.17 Raizen
- 6.4.18 SEKAB
- 6.4.19 SUNCOR Energy Inc.
- 6.4.20 Tereos
- 6.4.21 Valero
- 6.4.22 VERBIO Vereinigte Bioenergie AG
7 Market Opportunities and Future Outlook
- 7.1 White-space and Unmet-Need Assessment

 生物丁醇市場:全球市場預測,2026-2032年生質乙醇酵母市場-全球市場預測(2026-2032年)用於熱電聯產的生物液體燃料市場:按燃料類型、轉化技術、原料來源、產能範圍和終端用戶產業分類-2026-2032年全球市場預測生質乙醇市場:依原料、生產技術、混合類型、等級、通路和最終用途分類-2026-2032年全球市場預測
 歐洲生質乙醇:市場佔有率分析、產業趨勢與統計及成長預測(2026-2031)
 生質乙醇酵母市場規模、佔有率和成長分析:按產品類型、原料類型、應用、終端用戶產業、形態、發酵製程和地區分類-2026-2033年產業預測
 生物丁醇市場:依原料、應用、終端使用者產業及地區分類
 生物丁醇市場報告:按原料、應用、終端用戶產業和地區分類(2026-2034 年)生質乙醇市場規模、佔有率、趨勢和預測:按類型、燃料混合物、生產方法、最終用途行業和地區分類,2026-2034年
 2026年全球生質乙醇酵母市場報告