


 |
市場調查報告書
商品編碼
2121537
指紋感應器:市場佔有率分析、產業趨勢與統計、成長預測(2026-2031)Fingerprint Sensors - Market Share Analysis, Industry Trends & Statistics, Growth Forecasts (2026 - 2031) |
||||||

※ 本網頁內容可能與最新版本有所差異。詳細情況請與我們聯繫。
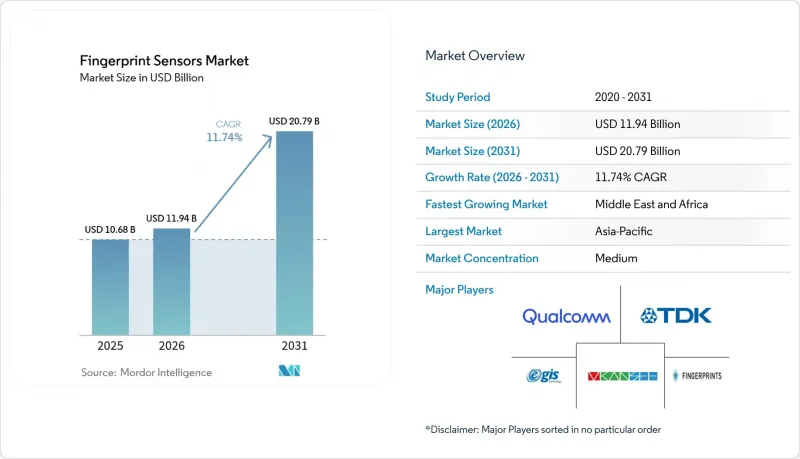
據 Mordor Intelligence 稱,2025 年指紋感測器市值為 106.8 億美元,預計到 2031 年將達到 207.9 億美元,而 2026 年為 119.4 億美元,預測期(2026-2031 年)的複合年成長率為 11.74%。
本報告按感測器類型(光學、電容式等)、外形尺寸(後置/前置、側置等)、應用領域(智慧型手機/平板電腦、筆記型電腦/桌上型電腦等)、終端用戶產業(家用電子電器/OEM廠商、銀行、金融服務/金融科技等)和地區進行細分。市場預測以美元計價。
全球指紋感應器市場趨勢及洞察
智慧型手機OEM廠商正在轉向屏下超音波感測器。
屏下嵌入式超音波感測器的設計使設備製造商能夠在實現全面屏OLED螢幕的同時,保持高度可靠的生物識別安全性。高通最新的感應器「3D Sonic Max」可在250毫秒內捕捉600平方毫米的影像,即使在潮濕或油膩的皮膚上也能解鎖,並且在欺騙測試中優於光學模組。三星、Google和小米已決定在其2025年的產品藍圖中,在其旗艦機型中採用超音波技術,以支援Android 16生物識別API,該API提高了FAR/FRR認證標準。由此產生的規模經濟正在降低二級OEM廠商的平均售價(ASP),加速各價位段的出貨量成長,並將指紋感測器市場推向下一個設備週期。
政府推行電子身分證和電子護照正在加速需求成長。
從阿拉伯聯合大公國到南非,各國的數位身分識別計畫現在都強制要求採用多因素生物識別,通常涉及儲存在安全元件中的指紋模板。毛里求斯於2024年2月發行了MNIC 3.0卡,該卡整合了「卡上匹配」指紋認證功能,可實現基於錢包的跨境驗證。巴布亞新幾內亞的SevisPass試點計畫表明,小規模的經濟體無需傳統基礎設施即可實現生物識別身分的飛躍。此類措施正在催生對可靠感測器模組的多年採購需求,並在公共部門預算週期內確立指紋感測器市場。
高階設備中人臉部認證的迅速普及。
蘋果的 iPhone 17 系列和三星的 Galaxy Z7 Fold Pro 都預設採用 3D臉部認證解鎖,這表明生物辨識技術正逐漸轉向基於相機的生物識別。然而,到 2025 年,93% 的智慧型手機仍將配備指紋辨識器,如果屏下指紋辨識技術能夠達到蘋果設定的 0.002% 的錯誤辨識率 (FAR) 目標,預計 iPhone 產品線將重新採用屏下指紋辨識。在潮濕環境、戴上手套以及需要將指紋辨識範本儲存在裝置上的銀行應用程式等對隱私要求較高的工作流程中,指紋辨識仍然是首選。因此,屏下指紋辨識技術可能只會對高階市場造成衝擊,而不會波及整個指紋辨識感測器市場。
細分市場分析
由於電容式感測器成本曲線成熟且應用範圍廣泛,預計到2025年,其在指紋感測器市場仍將佔據50.35%的佔有率。同時,超音波晶片預計將以15.02%的複合年成長率成長,隨著OEM廠商將高階智慧型手機和汽車主機轉向體成像技術,預計到2031年,兩者之間的收入差距將縮小。預計到2031年,採用超音波裝置的指紋感測器市場規模將超過43.7億美元,這反映了汽車產業較高的平均售價(ASP)和認證利潤率。根據柏克萊感測器與執行器中心的研究,基於KNN的PMUT陣列可產生105.5 dB/V的輸出,從而提高了透過厚蓋玻片和手套的偵測性能。
這些性能優勢促成了多項認證。高通的「3D Sonic Max」於2025年獲得FIDO Level 3和BSI CC EAL 6+認證,符合德國電子識別(eID)標準。光學感測器繼續面向注重性價比的市場和自助終端,而熱敏感測器則主要應用於嚴苛環境和屍檢等細分市場。總體而言,技術的多樣性支撐著整個指紋感測器市場,即使超音波技術在高階市場佔據主導地位。
預計到2025年,背插式/前置式指紋感應器將佔總銷售量的41.55%,這主要得益於傳統行動電話設計和堅固耐用型手持終端機的普及。然而,由於OLED基板的減薄以及局部聲音耦合層的應用,屏下超音波模組預計將以15.85%的複合年成長率成為成長最快的細分市場。隨著無邊框設計在400美元以下價位的設備中日益普及,屏下指紋感應器的市場佔有率預計到2031年將達到39.15%。蘋果、三星和OPPO已累積訂購超過2.5億顆屏下指紋感應器晶片,總合2024年下半年的生產,顯示螢幕下指紋感應器的大規模應用正在加速推進。
側邊電容式觸控螢幕條在折疊式裝置和遊戲智慧型手機中仍然很受歡迎,因為高速點擊偵測在這些裝置中至關重要。同時,在商務筆記型電腦中,鍵盤更換週期比智慧型手機慢兩到三年,因此傳統的按鍵/主頁鍵設計仍然佔據主導地位。京東方和維信諾正在測試的「OLED感測器」原型將指紋識別與用於心率監測的光學脈搏波描記法(光脈搏波測量)相結合,預示著一種多功能面板的出現,它有望開啟指紋感測器市場的新篇章。
區域分析
亞太地區45.60%的銷售佔有率反映了其供應鏈深度與終端市場需求的獨特整合。中國垂直整合的行動電話生態系統、韓國的AMOLED創新以及日本在壓電陶瓷領域的領先地位,共同支撐著該地區的富有韌性價值鏈。印度的「Aadhaar 2.0」藍圖和印尼的電子身分證升級計畫將在未來幾年進一步提振國內需求。此外,亞太地區各國政府都在推行扶持本地半導體製造業的措施,這將降低整體成本,並進一步鞏固亞太地區作為指紋感測器市場中心的地位。
中東和非洲地區預計將以14.95%的複合年成長率成長,成長率位居全球之首。阿拉伯聯合大公國的國家生物識別錢包和沙烏地阿拉伯的「Nafath」平台均要求使用經過認證的指紋模組進行公民註冊,這推動了對卡片和自助終端的大量訂單。南非斥資250萬美元舉辦的智慧ID卡競標旨在2029年大選前大規模發行,顯示非洲正迅速轉型為數位身分基礎設施。隨著「made」和「e-Fawateer」等本地支付網路向生物識別幣化轉型,感測器供應管道日益緊張,凸顯了新興經濟體指紋感測器市場的巨大成長潛力。
在北美和歐洲,市場保持著中等個位數的成長勢頭,這主要得益於汽車生物識別、企業安全措施的加強以及嚴格的資料隱私合規要求。歐洲數位身分框架要求到2026年普及數位錢包,屆時將有4.5億居民需要使用基於設備或卡片的指紋認證。台積電位於亞利桑那州、投資400億美元的工廠計劃於2026年投產二期生產線,屆時將實現超音波PMUT晶圓的在地化生產,為美國主要行動電話製造商供貨。這將增強國內供應的韌性,並有助於平衡全球指紋感測器市場的分佈。
其他好處:
- Excel格式的市場預測(ME)表
- 3個月的分析師支持
目錄
第1章:引言
- 市場分析與定義的前提條件
- 分析範圍
第2章 分析方法
第3章執行摘要
第4章 市場狀況
- 市場概覽
- 市場促進因素
- 智慧型手機廠商轉向屏下超音波感測器
- 政府推行電子身分證和電子護照正在加速需求成長。
- 具備支付功能的生物識別智慧卡的商業化部署。
- 在車輛中引入生物識別已成為無鑰匙進入系統的強制性要求。
- 人工智慧驅動的欺騙檢測技術正在提升安全認證等級。
- 薄膜壓電PMUT陣列的成本降低/面積
- 市場限制因素
- 臉部認證技術在高階設備中的迅速普及。
- 限制生物識別資料儲存的資料隱私法。
- 供應鏈對高階 8 吋 CIS 代工廠的依賴
- 在戶外環境下,手指潮濕可能導致誤檢,這令人擔憂。
- 價值鍊和供應鏈分析
- 監理情勢
- 技術展望
- 波特五力分析
第5章:預測市場規模與成長率
- 依感測器類型
- 光學的
- 電容式
- 熱的
- 超音波
- 按外形尺寸/佈局
- 後/前安裝
- 側裝
- 顯示器下方(光學)
- 顯示下方(超音波型)
- 向上按按鈕/主鍵
- 透過使用
- 智慧型手機和平板電腦
- 筆記型電腦和桌上型電腦
- 智慧卡和支付令牌
- 物聯網/智慧門鎖和穿戴式設備
- 按最終用戶行業分類
- 家用電子電器/OEM
- 銀行、金融服務與保險 (BFSI) / 金融科技
- 政府和執法機關
- 軍事/國防
- 汽車與出行
- 按地區
- 北美洲
- 美國
- 加拿大
- 墨西哥
- 歐洲
- 英國
- 德國
- 法國
- 義大利
- 其他歐洲國家
- 亞太地區
- 中國
- 日本
- 印度
- 韓國
- 其他亞太國家
- 中東
- 以色列
- 沙烏地阿拉伯
- 阿拉伯聯合大公國
- 土耳其
- 其他中東國家
- 非洲
- 南非
- 埃及
- 其他非洲國家
- 南美洲
- 巴西
- 阿根廷
- 其他南美國家
- 北美洲
第6章 競爭情勢
- 市場集中度
- 策略趨勢
- 市佔率分析
- 公司簡介
- Apple Inc.
- AU Optronics Corp.
- CrucialTec Co., Ltd.
- Egis Technology Inc.
- Fingerprint Cards AB
- Goodix Technology Co., Ltd.
- HID Global Corporation
- IDEX Biometrics ASA
- Infineon Technologies AG
- NEC Corporation
- Next Biometrics ASA
- Qualcomm Technologies Inc.
- Samsung System LSI Business
- Shenzhen Chipone/Novatek(Biometric BU)
- Sonavation Inc.
- STMicroelectronics NV
- Synaptics Incorporated
- TDK Corporation(InvenSense)
- Thales Group
- TKH Group(Nedap)
- VKANSEE Technology Inc.
第7章 市場機會與未來展望
According to Mordor Intelligence, the fingerprint sensors market size was valued at USD 10.68 billion in 2025 and estimated to grow from USD 11.94 billion in 2026 to reach USD 20.79 billion by 2031, at a CAGR of 11.74% during the forecast period (2026-2031).
This report is Segmented by Sensor Type (Optical, Capacitive, and More), Form Factor (Rear/Front Mount, Side-Mounted, and More), Application (Smartphones & Tablets, Laptops/PCs, and More), End-User Industry (Consumer Electronics OEM, BFSI & FinTech, and More), and Geography. The Market Forecasts are Provided in Terms of Value (USD).
Global Fingerprint Sensors Market Trends and Insights
Smartphone OEM Shift to Under-Display Ultrasonic Sensors
Ultrasonic under-display designs let handset makers preserve edge-to-edge OLED screens while retaining high-confidence biometric security. Qualcomm's latest 3D Sonic Max transducer captures a 600 mm2 image in 250 ms and sustains unlock even with damp or oily skin, outperforming optical modules in spoof testing. Samsung, Google and Xiaomi have committed flagship lines to ultrasonic implementations in 2025 product roadmaps, aligning with Android 16 biometric APIs that raise FAR/FRR certification thresholds. The resulting scale economies lower ASPs for tier-2 OEMs, accelerating volume growth across price bands and propelling the fingerprint sensors market into its next device cycle.
Government e-ID & e-Passport Rollouts Accelerating Demand
Digital identity programs from the UAE to South Africa now specify multi-factor biometrics, typically including fingerprint templates stored in secure elements. Mauritius issued its MNIC 3.0 card in February 2024, embedding match-on-card fingerprint authentication that enables wallet-based cross-border recognition. Papua New Guinea's SevisPass pilot underscores how small economies leapfrog to biometric IDs without legacy infrastructure. Such schemes create multi-year procurement waves for trusted sensor modules, anchoring the fingerprint sensors market in the public-sector budget cycle.
Rapid Adoption of Facial Recognition in Premium Devices
Apple's iPhone 17 range and Samsung's Galaxy Z7 Fold Pro both default to 3-D facial unlock, shifting biometric mindshare toward camera-based modalities. Yet 93% of handsets shipping in 2025 still carry a fingerprint reader, and under-display sensors are expected to return to the iPhone portfolio when technology meets Apple's 0.002 % FAR target. Fingerprint methods remain preferred for wet environments, gloved usage and privacy-sensitive workflows such as banking apps that require on-device template storage, so cannibalization largely affects the premium tail rather than the bulk of the fingerprint sensors market.
Other drivers and restraints analyzed in the detailed report include:
- Payment-Grade Biometric Smartcard Commercial Launches
- Automotive In-Cabin Biometrics Mandated for Keyless Access
- Data-Privacy Legislation Limiting Biometric Data Retention
For complete list of drivers and restraints, kindly check the Table Of Contents.
Segment Analysis
Capacitive units retained a 50.35% share of the fingerprint sensors market in 2025 owing to mature cost curves and broad application reach. Ultrasonic chips, however, are set to climb at 15.02% CAGR and are projected to narrow the revenue gap by 2031 as OEMs migrate high-tier phones and automotive consoles toward volumetric imaging. The fingerprint sensors market size for ultrasonic devices is on track to surpass USD 4.37 billion by 2031, reflecting premium ASPs and automotive qualification margins. Research from Berkeley's Sensor & Actuator Center shows KNN-based PMUT arrays generating 105.5 dB/V output, enhancing penetration through thick cover glass and gloves.
Performance advantages are translating into certification wins. Qualcomm's 3D Sonic Max achieved FIDO Level-3 and BSI CC EAL 6+ in 2025, enabling German eID compliance. Optical sensors continue servicing cost-sensitive tiers and kiosk terminals, while thermal variants remain niche for harsh-environment and postmortem forensics. Altogether, technology diversity sustains the broader fingerprint sensors market even as ultrasonic leadership cements in premium segments.
Rear/front mounts generated 41.55% of 2025 revenue, helped by legacy handset designs and rugged handhelds. Yet under-display ultrasonic modules will post the fastest 15.85% CAGR, taking advantage of OLED substrate thinning and localized acoustic coupling layers. The fingerprint sensors market share for under-display formats is expected to reach 39.15% by 2031 as bezel-less design becomes ubiquitous among sub-USD 400 devices. Apple, Samsung and Oppo collectively placed orders exceeding 250 million under-display sensors die in H2 2024 production slots, signalling scale adoption.
Side-mounted capacitive strips remain popular in foldables and gaming phones that prioritize rapid tap detection, while on-button/home-key designs linger in enterprise notebooks where keyboard replacement cycles lag smartphones by 2-3 years. Sensor-in-OLED prototypes under test at BOE and Visionox merge fingerprint capture with heart rate photoplethysmography, hinting at multifunctional panels that could redefine the next chapter of the fingerprint sensors market.
Complete Report Scope:
- By Sensor Type
- Optical
- Capacitive
- Thermal
- Ultrasonic
- By Form Factor / Placement
- Rear/Front Mount
- Side-mounted
- Under-display (Optical)
- Under-display (Ultrasonic)
- On-button / Home-key
- By Application
- Smartphones and Tablets
- Laptops / PCs
- Smart-Cards and Payment Tokens
- IoT / Smart Locks and Wearables
- By End-user Industry
- Consumer Electronics OEM
- BFSI and FinTech
- Government and Law-Enforcement
- Military and Defense
- Automotive and Mobility
- By Geography
- North America
- United States
- Canada
- Mexico
- Europe
- United Kingdom
- Germany
- France
- Italy
- Rest of Europe
- Asia-Pacific
- China
- Japan
- India
- South Korea
- Rest of Asia-Pacific
- Middle East
- Israel
- Saudi Arabia
- United Arab Emirates
- Turkey
- Rest of Middle East
- Africa
- South Africa
- Egypt
- Rest of Africa
- South America
- Brazil
- Argentina
- Rest of South America
- North America
Geography Analysis
Asia-Pacific's 45.60% revenue share reflects a unique integration of supply chain depth and end-market demand. China's vertically aligned handset ecosystem, Korea's AMOLED innovation and Japan's piezo ceramics leadership collectively anchor a resilient regional value chain. India's Aadhaar 2.0 roadmap and Indonesia's e-KTP upgrade pipeline further underwrite multi-year domestic demand. Regional governments also sponsor local silicon fabrication incentives, lowering landed costs and reinforcing Asia-Pacific as the gravitational center of the fingerprint sensors market.
Middle East & Africa is projected to expand at 14.95% CAGR, the fastest worldwide. The UAE's national biometric wallet and Saudi Arabia's Nafath platform both require certified fingerprint modules for citizen onboarding, catalysing bulk card and kiosk orders. South Africa's USD 2.5 million smart ID card tender aims for mass issuance before the 2029 elections, illustrating Africa's leapfrogging toward digital identity infrastructures. With regional payment networks such as made and e-Fawateer shifting to biometric tokenization, supplier pipelines for sensors are tightening, underscoring the growth potential of the fingerprint sensors market in emerging economies.
North America and Europe sustain mid-single-digit trajectories underpinned by automotive biometrics, enterprise security upgrades and stringent data-privacy compliance. The European Digital Identity Framework mandates wallet rollout by 2026, translating into 450 million residents requiring device or card-based fingerprint authentication. TSMC's USD 40 billion Arizona fabs, due to open Phase 2 lines in 2026, will localize ultrasonic PMUT wafer starts for key U.S. handset accounts, strengthening onshore supply resilience and balancing the global distribution of the fingerprint sensors market.
- Apple Inc.
- AU Optronics Corp.
- CrucialTec Co., Ltd.
- Egis Technology Inc.
- Fingerprint Cards AB
- Goodix Technology Co., Ltd.
- HID Global Corporation
- IDEX Biometrics ASA
- Infineon Technologies AG
- NEC Corporation
- Next Biometrics ASA
- Qualcomm Technologies Inc.
- Samsung System LSI Business
- Shenzhen Chipone / Novatek (Biometric BU)
- Sonavation Inc.
- STMicroelectronics N.V.
- Synaptics Incorporated
- TDK Corporation (InvenSense)
- Thales Group
- TKH Group (Nedap)
- VKANSEE Technology Inc.
Additional Benefits:
- The market estimate (ME) sheet in Excel format
- 3 months of analyst support
TABLE OF CONTENTS
1 INTRODUCTION
- 1.1 Study Assumptions and Market Definition
- 1.2 Scope of the Study
2 RESEARCH METHODOLOGY
3 EXECUTIVE SUMMARY
4 MARKET LANDSCAPE
- 4.1 Market Overview
- 4.2 Market Drivers
- 4.2.1 Smartphone OEM shift to under-display ultrasonic sensors
- 4.2.2 Government e-ID and e-Passport roll-outs accelerating demand
- 4.2.3 Payment-grade biometric smart-card commercial launches
- 4.2.4 Automotive in-cabin biometrics mandated for key-less access
- 4.2.5 AI-driven spoof-detection improving security certification
- 4.2.6 Falling cost/area of thin-film piezoelectric PMUT arrays
- 4.3 Market Restraints
- 4.3.1 Rapid adoption of facial recognition in premium devices
- 4.3.2 Data-privacy legislation limiting biometric data retention
- 4.3.3 Supply-chain reliance on high-end 8-inch CIS foundries
- 4.3.4 False-accept anxiety in wet-finger outdoor conditions
- 4.4 Value / Supply-Chain Analysis
- 4.5 Regulatory Landscape
- 4.6 Technological Outlook
- 4.7 Porter's Five Forces Analysis
- 4.7.1 Threat of New Entrants
- 4.7.2 Bargaining Power of Suppliers
- 4.7.3 Bargaining Power of Buyers
- 4.7.4 Threat of Substitutes
- 4.7.5 Intensity of Rivalry
5 MARKET SIZE AND GROWTH FORECASTS (VALUE)
- 5.1 By Sensor Type
- 5.1.1 Optical
- 5.1.2 Capacitive
- 5.1.3 Thermal
- 5.1.4 Ultrasonic
- 5.2 By Form Factor / Placement
- 5.2.1 Rear/Front Mount
- 5.2.2 Side-mounted
- 5.2.3 Under-display (Optical)
- 5.2.4 Under-display (Ultrasonic)
- 5.2.5 On-button / Home-key
- 5.3 By Application
- 5.3.1 Smartphones and Tablets
- 5.3.2 Laptops / PCs
- 5.3.3 Smart-Cards and Payment Tokens
- 5.3.4 IoT / Smart Locks and Wearables
- 5.4 By End-user Industry
- 5.4.1 Consumer Electronics OEM
- 5.4.2 BFSI and FinTech
- 5.4.3 Government and Law-Enforcement
- 5.4.4 Military and Defense
- 5.4.5 Automotive and Mobility
- 5.5 By Geography
- 5.5.1 North America
- 5.5.1.1 United States
- 5.5.1.2 Canada
- 5.5.1.3 Mexico
- 5.5.2 Europe
- 5.5.2.1 United Kingdom
- 5.5.2.2 Germany
- 5.5.2.3 France
- 5.5.2.4 Italy
- 5.5.2.5 Rest of Europe
- 5.5.3 Asia-Pacific
- 5.5.3.1 China
- 5.5.3.2 Japan
- 5.5.3.3 India
- 5.5.3.4 South Korea
- 5.5.3.5 Rest of Asia-Pacific
- 5.5.4 Middle East
- 5.5.4.1 Israel
- 5.5.4.2 Saudi Arabia
- 5.5.4.3 United Arab Emirates
- 5.5.4.4 Turkey
- 5.5.4.5 Rest of Middle East
- 5.5.5 Africa
- 5.5.5.1 South Africa
- 5.5.5.2 Egypt
- 5.5.5.3 Rest of Africa
- 5.5.6 South America
- 5.5.6.1 Brazil
- 5.5.6.2 Argentina
- 5.5.6.3 Rest of South America
- 5.5.1 North America
6 COMPETITIVE LANDSCAPE
- 6.1 Market Concentration
- 6.2 Strategic Moves
- 6.3 Market Share Analysis
- 6.4 Company Profiles (includes Global level Overview, Market level overview, Core Segments, Financials as available, Strategic Information, Market Rank/Share, Products and Services, Recent Developments)
- 6.4.1 Apple Inc.
- 6.4.2 AU Optronics Corp.
- 6.4.3 CrucialTec Co., Ltd.
- 6.4.4 Egis Technology Inc.
- 6.4.5 Fingerprint Cards AB
- 6.4.6 Goodix Technology Co., Ltd.
- 6.4.7 HID Global Corporation
- 6.4.8 IDEX Biometrics ASA
- 6.4.9 Infineon Technologies AG
- 6.4.10 NEC Corporation
- 6.4.11 Next Biometrics ASA
- 6.4.12 Qualcomm Technologies Inc.
- 6.4.13 Samsung System LSI Business
- 6.4.14 Shenzhen Chipone / Novatek (Biometric BU)
- 6.4.15 Sonavation Inc.
- 6.4.16 STMicroelectronics N.V.
- 6.4.17 Synaptics Incorporated
- 6.4.18 TDK Corporation (InvenSense)
- 6.4.19 Thales Group
- 6.4.20 TKH Group (Nedap)
- 6.4.21 VKANSEE Technology Inc.
7 MARKET OPPORTUNITIES AND FUTURE OUTLOOK
- 7.1 White-space and Unmet-need Assessment

 矽基指紋感應器市場:依產品類型、應用、最終用戶、國家及地區分類-全球產業分析、市場規模、市場佔有率及2026年至2033年預測。
 歐洲指紋感測器:市場佔有率分析、產業趨勢與統計及成長預測(2026-2031 年)
 指紋感應器市場:全球預測,2026-2032年
 全球指紋感應器市場:按感測器技術、類型、技術、最終用途和地區分類-預測至2032年
 指紋感應器市場規模、佔有率、趨勢和預測:按類型、技術、應用和地區分類,2026-2034年
 指紋感應器市場:按類型、技術、產業和地區分類矽基指紋感測器市場:按感測器類型、嵌入式類型、應用、最終用戶和銷售管道分類-2026-2032年全球市場預測
 指紋感應器市場分析及預測(至2035年):依類型、產品類型、技術、組件、應用、最終用戶、模組、功能及安裝類型分類
 2026年全球指紋感應器市場報告
 指紋感應器市場 - 全球產業規模、佔有率、趨勢、機會、預測:按類型、技術、應用、地區和競爭格局分類,2021-2031年