


 |
市場調查報告書
商品編碼
2121416
無線感測器:市場佔有率分析、產業趨勢與統計、成長預測(2026-2031)Wireless Sensors - Market Share Analysis, Industry Trends & Statistics, Growth Forecasts (2026 - 2031) |
||||||

※ 本網頁內容可能與最新版本有所差異。詳細情況請與我們聯繫。
根據 Mordor Intelligence 估計,無線感測器市場在 2026 年的價值將達到 186.8 億美元,高於 2025 年的 148.2 億美元,預計到 2031 年將達到 595.5 億美元。
預計 2026 年至 2031 年的複合年成長率為 26.06%。
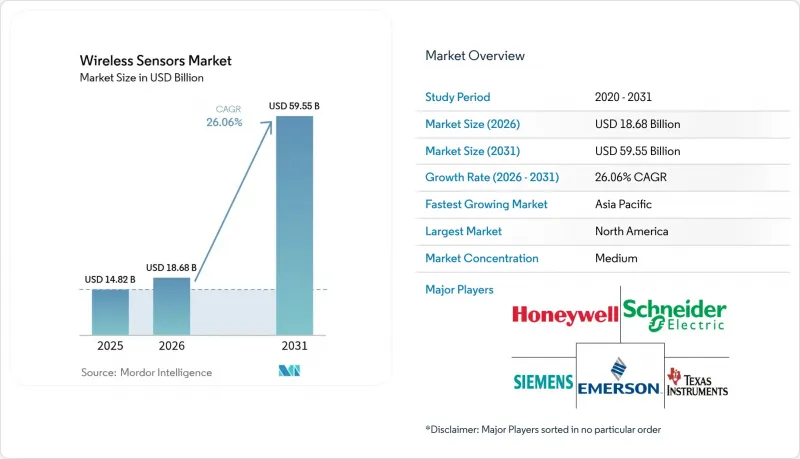
本報告按感測器類型(壓力、溫度等)、終端用戶產業(汽車、醫療保健、航太與國防等)、連接協議(藍牙/BLE、Wi-Fi、Zigbee等)、部署環境(室內工業環境、惡劣戶外環境、偏遠/危險區域等)和地區進行細分。市場預測以美元計價。
全球無線感測器市場趨勢與洞察
快速採用工業4.0和工業物聯網架構
數位化進程的加速要求工廠在其現有生產線中整合無線感測器,從而產生可用於分析和機器學習工作流程的即時資料流。一家德國工廠在2024年實現了23%的生產力提升,充分展現了即時遙測技術的經濟效益。與5G小型基地台共址的邊緣運算節點縮短了決策週期,並實現了有線系統難以企及的亞秒級控制調整。符合ISO 50001標準有助於持續的資源監控,使感測器從輔助設備躍升為策略資產。隨著競爭對手紛紛效仿,同業其他公司的工廠也開始採用這項技術。隨著部署規模的擴大,供應商生態系統正圍繞開放API進行整合,從而確保投資的未來可行性並加速解決方案的部署。
低功耗廣域網路(LPWAN)的普及
到2024年,隨著覆蓋45個國家的全國性NB-IoT網路和歐洲工業區95%的LoRaWAN覆蓋率的實現,連接盲區將被徹底消除。電信業者正透過向大流量用戶提供每年不到2美元的連接服務,將未使用的頻段貨幣化,從而在短短幾個月內將土壤濕度監測和遙測等應用場景轉化為盈利項目。服務等級協定(SLA)的保障使得免許可網路能夠用於關鍵任務型工作負載,而符合ETSI標準的認證則簡化了跨國部署流程。隨著接入範圍的不斷擴大,無線感測器市場正在開發工廠以外的新應用,例如橋樑和大壩的結構完整性評估。
專有無線協定棧之間互通性的局限性
在多廠商部署中,廠商特定的協議會使整合成本增加 40%,使買家陷入「圍牆花園」式的困境,並阻礙創新。儘管行業聯盟正在努力開發通用數據模式,但進展遠落後於市場需求。企業越來越傾向於使用能夠在不同協定之間進行轉換的閘道器和中間件層,但這會增加延遲和成本。面對客戶的抵制,主要供應商正在謹慎權衡廠商鎖定帶來的好處與其目標市場成長之間的利弊。這種僵局導致一些大型專案停滯不前,直到出現可靠的互通性藍圖。
細分市場分析
受石油、天然氣和化學工業嚴格安全規程的推動,壓力測量儀器預計將以26.97%的複合年成長率成長,超越所有競爭產品。同時,溫度測量儀器預計將在2025年保持其銷售領先地位,市佔率達到27.10%。這一轉變表明,預測性維護預算正轉向壓力數據以進行故障預防,而這在過去曾被視為一種可選項。將絕緣體上矽(SOI)膜片與藍牙低功耗(BLE)無線功能結合的創新壓力感測器,即使在腐蝕性流體中也能實現無漂移性能,並減輕了校準負擔。振動和位置感測器在倉庫機器人和旋轉機械的診斷領域正蓬勃發展,進一步推動了需求多元化。整合式多參數節點進一步降低了安裝成本,並簡化了資產標籤。預計到2031年,壓力設備在無線感測器市場中的佔有率將達到29.05%,進一步支撐了這一成長趨勢。目前,零件供應商正在其工廠對感測器進行預校準,從而縮短了系統整合商實現盈利所需的時間。
第二代化學和氣體感測器符合嚴格的室內空氣品質標準,加速了醫療機構和半導體製造工廠的暖通空調(HVAC)維修。結合影像感測器和毫米波雷達的視覺偵測模組適用於危險環境,無需人工干預即可進行遠端安全審核。流量感測器和濕度感測器分別滿足製藥業節水和合規性方面的需求。隨著多感測器配置的日趨成熟,買家越來越傾向於選擇支援無線韌體升級並確保長期收益的面向未來的節點。因此,無線感測器市場正在推動安全更新服務售後市場的成長,這些服務融合了網路安全管理和功能增強。
預計到2025年,汽車產業將佔總銷售額的22.05%,並透過輪胎壓力、引擎管理和車輛穩定性等成熟應用場景,為原始設備製造商(OEM)的需求和換代週期提供支援。同時,隨著拖車、貨櫃和堆高機等設備的數位化程度不斷提高,以加強冷鏈合規性並減少燃料浪費,物流和運輸業預計將以26.75%的最高複合年成長率成長。即時地理圍欄和貨物狀況分析正在推動保險費的降低,並促進感測器的大規模部署。預計到2031年,物流業無線感測器的市佔率將超過18.60%,縮小與汽車業老牌廠商之間的差距。
在醫療領域,無線感測器的應用正透過穿戴式裝置加速普及,用於遠端患者監護以減少再次入院;能源電力公司則在渦輪機和變壓器上安裝振動和溫度感測器節點,以避免代價高昂的停電事故。在航太和國防領域,企業正在採購功能強大的無線節點,用於監測飛機結構的完整性,並利用輕型網狀無線網路避免額外的佈線。在消費級智慧家庭設備中,用於安全和能源管理的Wi-Fi和Thread感測器正變得越來越普及,使得感測器的使用在技術水平較低的消費者中也變得司空見慣,並推動了其在輕工業領域的應用。這些融合的趨勢正在將無線感測器產業的基本客群從重工業擴展到更廣泛的領域。
區域分析
北美作為工業4.0的先驅者,擁有成熟的系統整合商生態系統,以及鼓勵免許可Sub-GHz頻段運營的透明的FCC法規,預計到2025年將佔全球銷售額的38.10%。企業稅收優惠政策進一步加速了資本設備的更新換代。無線感測技術正被納入公共部門津貼中,用於公路、橋樑和水利基礎設施的維修,從而穩定了多年的市場需求。諸如NIST 800-82之類的網路安全框架為營運技術(OT)防禦提供了指南,增強了規避風險的買家的信心,並提高了供應商安全開發生命週期的標準。
亞太地區預計將以27.22%的複合年成長率實現最高成長。中國的「雙循環」政策和「中國製造2025」計畫正在推動數位化和設備現代化,從而帶動國內晶圓廠生產的MEMS感測器訂單量激增。印度的「智慧城市計畫」強制要求建設物聯網賦能的公共基礎設施,並正在加速地方政府的採購步伐。日本的「社會5.0」正在推動跨領域的先導計畫,整合人工智慧、機器人和感測器平台。具有成本競爭力的元件供應,加上本地需求的激增,正在鞏固該地區作為生產中心和主要買家的地位,並增強無線感測器市場的規模經濟效益。
在歐洲,強勁的成長與嚴格的法律規範之間正尋求平衡。 《一般資料保護規則》(GDPR)加重了資料保護的負擔,而提案的《網路韌性法案》則提倡「安全設計」。然而,「歐洲綠色交易」正在資助大規模的排放監測項目,加速化工走廊和鋼鐵中心地帶的部署。儘管各國分散的無線法規正逐步協調統一,但整合合作夥伴仍需遵守各種認證流程。儘管存在這些複雜性,德國、義大利和北歐國家成熟的製程工業叢集為無線維修提供了穩定的部署基礎。中東和非洲地區雖然處於發展階段,但前景光明:在石油資源豐富的海灣國家,遠端管道上的能源採集感測器正在試點運作;非洲的公共產業公司也在測試基於窄帶物聯網(NB-IoT)的智慧電錶部署。
其他好處:
- Excel格式的市場預測(ME)表
- 3個月的分析師支持
目錄
第1章:引言
- 研究假設和市場定義
- 調查範圍
第2章:調查方法
第3章執行摘要
第4章 市場狀況
- 市場概覽
- 市場促進因素
- 快速採用工業4.0和工業物聯網架構
- 低功耗廣域網路(LPWA)的普及
- MEMS感測器的平均售價(ASP)下降,使得大規模部署成為可能。
- 整個流程工業的預測性維護成本正在飆升。
- 無電池能源採集感測器(例如壓電式、射頻式)的突破性進展
- 政府激勵措施促進智慧基礎設施維修
- 市場限制因素
- 專有無線協定棧之間互通性的局限性
- Sub-GHz頻段頻寬的壅塞和共存問題日益嚴重。
- 主要半導體元件供應鏈的波動
- 擴大OT環境中的網路實體攻擊面
- 產業價值鏈分析
- 監理情勢
- 技術展望
- 波特五力分析
- 投資分析
- 宏觀經濟因素的影響
第5章 市場規模與成長預測
- 依感測器類型
- 壓力感測器
- 溫度感測器
- 化學和氣體感測器
- 位置和接近感測器
- 振動感測器
- 流量感測器
- 濕度感測器
- 影像感測器
- 其他
- 按最終用戶行業分類
- 車
- 衛生保健
- 航太/國防
- 能源與電力
- 食品/飲料
- 農業
- 建築自動化與智慧家居
- 消費性電子產品
- 物流/運輸
- 其他
- 連線協定
- 藍牙/BLE
- Wi-Fi
- Zigbee
- 蜂窩網路(4G/5G/NB-IoT)
- LoRaWAN
- Sigfox
- WirelessHART
- Thread
- Z-Wave
- 其他
- 按部署環境
- 室內工業用途
- 惡劣的戶外環境
- 偏遠地區/危險地區
- 水下/海洋
- 建築基礎設施/住宅
- 按地區
- 北美洲
- 美國
- 加拿大
- 墨西哥
- 南美洲
- 巴西
- 阿根廷
- 其他南美國家
- 歐洲
- 德國
- 英國
- 法國
- 義大利
- 西班牙
- 其他歐洲國家
- 亞太地區
- 中國
- 日本
- 韓國
- 印度
- ASEAN
- 其他亞太國家
- 中東和非洲
- 中東
- 沙烏地阿拉伯
- 阿拉伯聯合大公國
- 卡達
- 土耳其
- 其他中東國家
- 非洲
- 南非
- 埃及
- 奈及利亞
- 其他非洲國家
- 中東
- 北美洲
第6章 競爭情勢
- 市場集中度
- 策略趨勢
- 市佔率分析
- 公司簡介
- ABB Ltd.
- Advantech Co., Ltd.
- Analog Devices, Inc.
- Banner Engineering Corp.
- Bosch Sensortec GmbH
- Digi International Inc.
- Emerson Electric Co.
- Honeywell International Inc.
- Infineon Technologies AG
- Libelium Comunicaciones Distribuidas SL
- LORD Sensing Systems(MicroStrain)
- Monnit Corporation
- NXP Semiconductors NV
- OMRON Corporation
- Pasco Scientific
- Phoenix Sensors LLC
- Qualcomm Incorporated
- Rockwell Automation, Inc.
- Schneider Electric SE
- Sensirion AG
- Siemens AG
- Silicon Laboratories Inc.
- STMicroelectronics NV
- TE Connectivity Ltd.
- Texas Instruments Incorporated
第7章 市場機會與未來展望
According to Mordor Intelligence, wireless sensors market size in 2026 is estimated at USD 18.68 billion, growing from 2025 value of USD 14.82 billion with 2031 projections showing USD 59.55 billion, growing at 26.06% CAGR over 2026-2031.
This report is Segmented by Sensor Type (Pressure, Temperature, and More), End-User Industry (Automotive, Healthcare, Aerospace and Defense, and More), Connectivity Protocol (Bluetooth and BLE, Wi-Fi, Zigbee, and More), Deployment Environment (Indoor Industrial, Outdoor Harsh, Remote/Hazardous Locations, and More), and Geography. The Market Forecasts are Provided in Terms of Value (USD).
Global Wireless Sensors Market Trends and Insights
Rapid Adoption of Industry 4.0 and IIoT Architectures
Digitization mandates push factories to embed wireless sensors across legacy lines, creating live data streams that feed analytics and machine-learning workflows. German plants posting 23% productivity gains in 2024 validate the financial upside of real-time telemetry. Edge compute nodes collocated with 5G small cells shorten decision loops, allowing sub-second control adjustments that wired systems struggle to match. ISO 50001 compliance drives continuous resource monitoring, elevating sensors from ancillary gadgets to strategic assets. Competitive imitation then multiplies deployments across peer facilities. As adoption scales, vendor ecosystems coalesce around open APIs that future-proof investment and speed solution roll-outs.
Proliferation of Low-Power Wide-Area Networks
Nationwide NB-IoT footprints across 45 countries and 95% LoRaWAN coverage of European industrial zones erased the connectivity gap in 2024. Operators monetize idle spectrum slices by offering sub-USD 2 annual connectivity rates at volume, turning use cases like soil-moisture monitoring and remote metering into cash-flow-positive projects within months. Guaranteed service-level agreements make unlicensed networks viable for mission-critical workloads, while ETSI-aligned certification streamlines multinational roll-outs. As access becomes ubiquitous, the wireless sensors market spawns fresh applications outside factory walls, including structural-health diagnostics for bridges and dams.
Limited Interoperability Among Proprietary Wireless Stacks
Vendor-specific protocols inflate integration spending by 40% in multi-supplier deployments, locking buyers into walled gardens that slow innovation. Industrial consortia work on common data schemas, yet progress trails market urgency. Enterprises increasingly favor gateway or middleware layers that translate disparate protocols, but these add latency and cost. Faced with customer pushback, large suppliers weigh the trade-off between lock-in profits and addressable-market growth. The stand-off holds back some broad-scale projects until credible interoperability roadmaps emerge.
Other drivers and restraints analyzed in the detailed report include:
- Falling MEMS Sensor ASPs Enabling Massive Deployment
- Surge in Predictive-Maintenance Programs Across Process Industries
- Escalating Spectrum Congestion and Coexistence Issues in Sub-GHz Bands
For complete list of drivers and restraints, kindly check the Table Of Contents.
Segment Analysis
Pressure devices are set to outpace all rivals with a 26.97% CAGR on the back of stringent safety programs in oil, gas, and chemical plants, even as temperature devices retained 27.10% revenue leadership in 2025. This shift evidences how predictive-maintenance budgets pivot to failure-preventive pressure data that was once considered optional. Pressure-sensor innovations such as silicon-on-insulator diaphragms coupled with BLE radios yield drift-free performance in corrosive fluids, shrinking calibration overheads. Meanwhile, vibration and position sensors gain momentum in warehouse robotics and rotating-machinery diagnostics, rounding out diversified demand. Integrated multi-parameter nodes further compress installation costs and simplify asset tagging. The wireless sensors market size attributed to pressure devices is forecast to capture a 29.05% slice by 2031, underscoring the momentum shift. Component vendors now pre-calibrate sensors at the factory, speeding time to revenue for system integrators.
Second-generation chemical and gas sensors meet stringent indoor-air-quality norms, prompting HVAC retrofits across healthcare and semiconductor fabs. Image sensors combined with mm-wave radar form visual-inspection modules for hazardous sites, allowing remote safety audits without human entry. Flow and humidity sensors ride water-conservation and pharmaceutical-manufacturing compliance trends, respectively. As multi-sensor configurations mature, buyers lean toward future-proof nodes that accept over-the-air firmware upgrades, securing long-term returns. Consequently, the wireless sensors market supports a growing aftermarket for secure update services that bundle cyber-hygiene with functional enhancements.
Automotive held 22.05% revenue in 2025 through established tire-pressure, engine-management, and vehicle-stability use cases, anchoring original-equipment demand and replacement cycles. Yet logistics and transportation is on course for the swiftest 26.75% CAGR as fleets digitize trailers, containers, and forklifts to tighten cold-chain compliance and slash fuel wastage. Real-time geofencing and cargo-condition analytics lower insurance premiums, encouraging mass sensor roll-outs. The wireless sensors market share captured by logistics is projected to top 18.60% by 2031, narrowing the gap with automotive incumbents.
Healthcare adoption accelerates through remote-patient monitoring wearables that minimize hospital readmissions, while energy and power utilities install vibration and temperature nodes on turbines and transformers to defer costly outages. Aerospace and defense procure ruggedized wireless nodes for airframe structural-health monitoring, leveraging lightweight mesh radios to avoid additional cabling. Consumer smart-home devices popularize Wi-Fi and Thread sensors for security and energy management, normalizing sensor use among non-technical buyers and inspiring cross-overs into light-industrial segments. These converging dynamics broaden the wireless sensors industry customer base beyond heavy manufacturing.
Complete Report Scope:
- By Sensor Type
- Pressure Sensors
- Temperature Sensors
- Chemical and Gas Sensors
- Position and Proximity Sensors
- Vibration Sensors
- Flow Sensors
- Humidity Sensors
- Image Sensors
- Other Sensor Types
- By End-user Industry
- Automotive
- Healthcare
- Aerospace and Defense
- Energy and Power
- Food and Beverage
- Agriculture
- Building Automation and Smart Homes
- Consumer Electronics
- Logistics and Transportation
- Other End-user Industries
- By Connectivity Protocol
- Bluetooth and BLE
- Wi-Fi
- Zigbee
- Cellular (4G/5G/NB-IoT)
- LoRaWAN
- Sigfox
- WirelessHART
- Thread
- Z-Wave
- Other Connectivity Protocols
- By Deployment Environment
- Indoor Industrial
- Outdoor Harsh
- Remote / Hazardous Locations
- Underwater / Subsea
- Building Infrastructure / Residential
- By Geography
- North America
- United States
- Canada
- Mexico
- South America
- Brazil
- Argentina
- Rest of South America
- Europe
- Germany
- United Kingdom
- France
- Italy
- Spain
- Rest of Europe
- Asia-Pacific
- China
- Japan
- South Korea
- India
- ASEAN
- Rest of Asia-Pacific
- Middle East and Africa
- Middle East
- Saudi Arabia
- United Arab Emirates
- Qatar
- Turkey
- Rest of Middle East
- Africa
- South Africa
- Egypt
- Nigeria
- Rest of Africa
- Middle East
- North America
Geography Analysis
North America controlled 38.10% of 2025 revenue, supported by early Industry 4.0 champions, mature system-integrator ecosystems, and transparent FCC rules that endorse unlicensed sub-GHz operation. Corporate tax incentives further accelerate capital-equipment refresh cycles. Public-sector grants for highway, bridge, and water-utility upgrades integrate wireless sensing as standard, stabilizing multi-year demand pipelines. Cybersecurity frameworks such as NIST 800-82 guide OT defenses, reassuring risk-averse buyers and raising the bar for vendors' secure-development lifecycles.
Asia-Pacific is on track to post the quickest 27.22% CAGR. China's dual-circulation policy and Made in China 2025 blueprint subsidize digital retrofits and lift bulk orders for MEMS sensors produced by domestic fabs. India's Smart Cities Mission mandates IoT-enabled utilities, propelling municipal procurements. Japan's Society 5.0 catalyzes cross-sector pilot projects blending AI, robotics, and sensor platforms. Cost-competitive component supply, combined with soaring regional demand, positions the region as both production hub and volume buyer, reinforcing economies of scale for the wireless sensors market.
Europe balances robust growth with strict regulatory oversight. GDPR adds data-protection overhead, while Cyber Resilience Act proposals push security-by-design. Yet the European Green Deal funds large-scale emissions-monitoring projects, spurring installations along chemical corridors and steel hubs. Fragmented national radio rules gradually harmonize, but integration partners still navigate varying certification paths. Despite complexity, established process-industry clusters in Germany, Italy, and the Nordics provide a stable installed base ripe for wireless retrofits. The Middle East and Africa are nascent but promising, with oil-rich Gulf states piloting energy-harvesting sensors on remote pipelines and African utilities trialing NB-IoT smart-meter roll-outs.
- ABB Ltd.
- Advantech Co., Ltd.
- Analog Devices, Inc.
- Banner Engineering Corp.
- Bosch Sensortec GmbH
- Digi International Inc.
- Emerson Electric Co.
- Honeywell International Inc.
- Infineon Technologies AG
- Libelium Comunicaciones Distribuidas S.L.
- LORD Sensing Systems (MicroStrain)
- Monnit Corporation
- NXP Semiconductors N.V.
- OMRON Corporation
- Pasco Scientific
- Phoenix Sensors LLC
- Qualcomm Incorporated
- Rockwell Automation, Inc.
- Schneider Electric SE
- Sensirion AG
- Siemens AG
- Silicon Laboratories Inc.
- STMicroelectronics N.V.
- TE Connectivity Ltd.
- Texas Instruments Incorporated
Additional Benefits:
- The market estimate (ME) sheet in Excel format
- 3 months of analyst support
TABLE OF CONTENTS
1 INTRODUCTION
- 1.1 Study Assumptions and Market Definition
- 1.2 Scope of the Study
2 RESEARCH METHODOLOGY
3 EXECUTIVE SUMMARY
4 MARKET LANDSCAPE
- 4.1 Market Overview
- 4.2 Market Drivers
- 4.2.1 Rapid adoption of Industry 4.0 and IIoT architectures
- 4.2.2 Proliferation of low-power wide-area (LPWA) networks
- 4.2.3 Falling MEMS sensor ASPs enabling massive deployment
- 4.2.4 Surge in predictive-maintenance programs across process industries
- 4.2.5 Battery-free energy-harvesting sensor breakthroughs (e.g., piezo, RF)
- 4.2.6 Government incentives for smart-infrastructure retrofits
- 4.3 Market Restraints
- 4.3.1 Limited interoperability among proprietary wireless stacks
- 4.3.2 Escalating spectrum-congestion and coexistence issues in sub-GHz bands
- 4.3.3 Supply-chain volatility for key semiconductor components
- 4.3.4 Rising cyber-physical attack surface in OT environments
- 4.4 Industry Value Chain Analysis
- 4.5 Regulatory Landscape
- 4.6 Technological Outlook
- 4.7 Porter's Five Forces Analysis
- 4.7.1 Bargaining Power of Suppliers
- 4.7.2 Bargaining Power of Consumers
- 4.7.3 Threat of New Entrants
- 4.7.4 Threat of Substitutes
- 4.7.5 Intensity of Competitive Rivalry
- 4.8 Investment Analysis
- 4.9 Impact of Macroeconomic Fcators
5 MARKET SIZE AND GROWTH FORECASTS (VALUE)
- 5.1 By Sensor Type
- 5.1.1 Pressure Sensors
- 5.1.2 Temperature Sensors
- 5.1.3 Chemical and Gas Sensors
- 5.1.4 Position and Proximity Sensors
- 5.1.5 Vibration Sensors
- 5.1.6 Flow Sensors
- 5.1.7 Humidity Sensors
- 5.1.8 Image Sensors
- 5.1.9 Other Sensor Types
- 5.2 By End-user Industry
- 5.2.1 Automotive
- 5.2.2 Healthcare
- 5.2.3 Aerospace and Defense
- 5.2.4 Energy and Power
- 5.2.5 Food and Beverage
- 5.2.6 Agriculture
- 5.2.7 Building Automation and Smart Homes
- 5.2.8 Consumer Electronics
- 5.2.9 Logistics and Transportation
- 5.2.10 Other End-user Industries
- 5.3 By Connectivity Protocol
- 5.3.1 Bluetooth and BLE
- 5.3.2 Wi-Fi
- 5.3.3 Zigbee
- 5.3.4 Cellular (4G/5G/NB-IoT)
- 5.3.5 LoRaWAN
- 5.3.6 Sigfox
- 5.3.7 WirelessHART
- 5.3.8 Thread
- 5.3.9 Z-Wave
- 5.3.10 Other Connectivity Protocols
- 5.4 By Deployment Environment
- 5.4.1 Indoor Industrial
- 5.4.2 Outdoor Harsh
- 5.4.3 Remote / Hazardous Locations
- 5.4.4 Underwater / Subsea
- 5.4.5 Building Infrastructure / Residential
- 5.5 By Geography
- 5.5.1 North America
- 5.5.1.1 United States
- 5.5.1.2 Canada
- 5.5.1.3 Mexico
- 5.5.2 South America
- 5.5.2.1 Brazil
- 5.5.2.2 Argentina
- 5.5.2.3 Rest of South America
- 5.5.3 Europe
- 5.5.3.1 Germany
- 5.5.3.2 United Kingdom
- 5.5.3.3 France
- 5.5.3.4 Italy
- 5.5.3.5 Spain
- 5.5.3.6 Rest of Europe
- 5.5.4 Asia-Pacific
- 5.5.4.1 China
- 5.5.4.2 Japan
- 5.5.4.3 South Korea
- 5.5.4.4 India
- 5.5.4.5 ASEAN
- 5.5.4.6 Rest of Asia-Pacific
- 5.5.5 Middle East and Africa
- 5.5.5.1 Middle East
- 5.5.5.1.1 Saudi Arabia
- 5.5.5.1.2 United Arab Emirates
- 5.5.5.1.3 Qatar
- 5.5.5.1.4 Turkey
- 5.5.5.1.5 Rest of Middle East
- 5.5.5.2 Africa
- 5.5.5.2.1 South Africa
- 5.5.5.2.2 Egypt
- 5.5.5.2.3 Nigeria
- 5.5.5.2.4 Rest of Africa
- 5.5.5.1 Middle East
- 5.5.1 North America
6 COMPETITIVE LANDSCAPE
- 6.1 Market Concentration
- 6.2 Strategic Moves
- 6.3 Market Share Analysis
- 6.4 Company Profiles (includes Global level Overview, Market level overview, Core Segments, Financials as available, Strategic Information, Market Rank/Share for key companies, Products and Services, and Recent Developments)
- 6.4.1 ABB Ltd.
- 6.4.2 Advantech Co., Ltd.
- 6.4.3 Analog Devices, Inc.
- 6.4.4 Banner Engineering Corp.
- 6.4.5 Bosch Sensortec GmbH
- 6.4.6 Digi International Inc.
- 6.4.7 Emerson Electric Co.
- 6.4.8 Honeywell International Inc.
- 6.4.9 Infineon Technologies AG
- 6.4.10 Libelium Comunicaciones Distribuidas S.L.
- 6.4.11 LORD Sensing Systems (MicroStrain)
- 6.4.12 Monnit Corporation
- 6.4.13 NXP Semiconductors N.V.
- 6.4.14 OMRON Corporation
- 6.4.15 Pasco Scientific
- 6.4.16 Phoenix Sensors LLC
- 6.4.17 Qualcomm Incorporated
- 6.4.18 Rockwell Automation, Inc.
- 6.4.19 Schneider Electric SE
- 6.4.20 Sensirion AG
- 6.4.21 Siemens AG
- 6.4.22 Silicon Laboratories Inc.
- 6.4.23 STMicroelectronics N.V.
- 6.4.24 TE Connectivity Ltd.
- 6.4.25 Texas Instruments Incorporated
7 MARKET OPPORTUNITIES AND FUTURE OUTLOOK
- 7.1 White-space and Unmet-Need Assessment

 無線位移感測器市場報告:趨勢、預測和競爭分析(至2035年)
 無線感測器市場:2026-2032年全球市場預測(依感測器類型、電源、連接方式、安裝配置、應用和部署環境分類)
 無線感測器標籤市場 - 全球產業規模、佔有率、趨勢、機會、預測:按類型、應用、地區和競爭格局分類,2021-2031年
 無線感測器市場規模、佔有率、趨勢和預測:按產品類型、技術、最終用途和地區分類,2026-2034 年半導體無線感測器物聯網市場:按組件、感測器類型、連接方式、應用、最終用途、國家和地區分類-產業分析、市場規模、市場佔有率及2025年至2032年預測
 無線感測器市場規模、佔有率和成長分析(按類型、應用、最終用戶和地區分類)—2026-2033年產業預測
 無線感測器市場機會、成長動力、產業趨勢分析及 2025 - 2034 年預測
 中東和非洲無線感測器:市場佔有率分析、行業趨勢、統計和成長預測(2025-2030)亞太地區無線感測器:市場佔有率分析、產業趨勢和成長預測(2025-2030)北美無線感測器:市場佔有率分析、行業趨勢、統計和成長預測(2025-2030)