


 |
市場調查報告書
商品編碼
2121397
智慧城市:市場佔有率分析、產業趨勢與統計、成長預測(2026-2031)Smart Cities - Market Share Analysis, Industry Trends & Statistics, Growth Forecasts (2026 - 2031) |
||||||

※ 本網頁內容可能與最新版本有所差異。詳細情況請與我們聯繫。
據 Mordor Intelligence 稱,2026 年智慧城市市場價值 1.96 兆美元,預計到 2031 年將達到 4.06 兆美元。
這意味著在預測期內,複合年成長率將達到 15.65%。
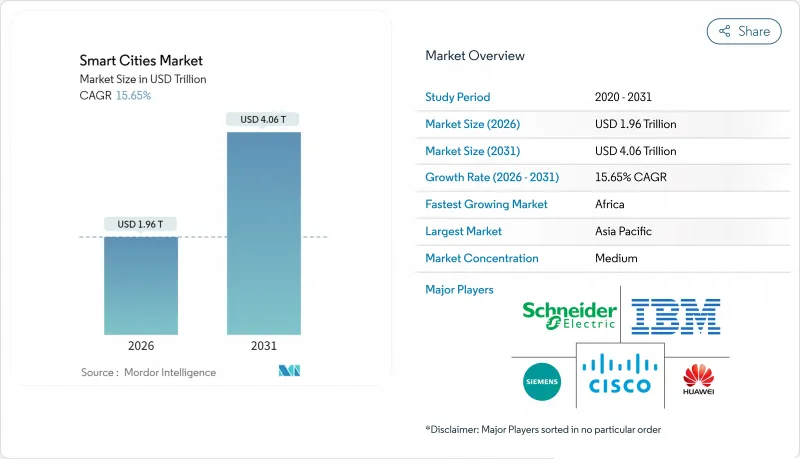
本報告按解決方案(例如,智慧運輸管理、智慧公共安全)、元件(硬體、軟體、服務)、部署模式(雲端、本地部署)、最終用戶(例如,政府/地方當局、住宅)和地區進行細分。市場預測以美元計價。
全球智慧城市市場趨勢與洞察
政府加大對綜合基礎建設的投入
多模態津貼項目正在將風險從地方政府財政轉移到國家預算。美國高級研究計畫署(ARPA-I)已撥款20億美元用於概念驗證項目,該項目將電動車充電站、智慧路燈和雨水感測器整合到共用管道中,從而將安裝成本降低近40%。英國地方數位基金將在2025年前投入5億英鎊(約6.35億美元),用於標準化地方政府服務中的應用程式介面(API),使居民能夠透過單一入口網站存取停車許可證和垃圾收集時間表。日本數位廳已撥款12億美元用於加強中型城市,提供光纖回程傳輸和邊緣運算節點,這些節點也可用作災害應變中心。這些項目將共同加速不具備債券發行權的地方政府採用智慧城市技術,並平滑智慧城市市場供應商的短期報酬曲線。
人工智慧和物聯網平台的廣泛應用
城市正從簡單的情境儀錶板轉向能夠自動分配資源的預測性分析。新加坡的「智慧國家」機器學習模型預測,到2025年,公車壅塞的預測準確率將達到92%,平均通勤時間將縮短11分鐘。國際電信聯盟(ITU)的Y.4000標準將於2024年獲得批准,它實現了真正的即插即用互通性,使採購團隊能夠更換感測器,而無需受限於單一的系統。慕尼黑的開放原始碼數位孿生系統處理了23億個感測器讀數,最佳化了除雪路線,降低了18%的燃油消耗,並節省了420萬歐元(約460萬美元)的加班費。這些案例展示了智慧城市的價值提案,縮短了投資回收期,從而推動了智慧城市需求的逐步成長。
高昂的初始維修和整合成本
成熟城市的現有基礎設施往往缺乏足夠的備用管道、電力容量或網路回程傳輸,因此在部署感測器之前必須進行成本高昂的土木工程改造。美國土木工程師協會 (ASCE) 估計,到 2025 年,每個路口的車路協同 (V2I) 升級成本將達到 17.5 萬至 25 萬美元,約為新建設(待開發區)成本的四倍。芝加哥的智慧路燈舉措就因一項意料之外的變壓器升級而花費了 1,800 萬美元,導致計畫延長 14 個月。此外,由於市政當局需要將數十年前的 SCADA 系統資料轉換為雲端就緒格式,整合流程的複雜性進一步推高了預算,這通常需要客製化中間件,從而使許可證費用增加 15% 至 25%。這些障礙可能會延緩合約簽訂,並阻礙智慧城市市場的初期部署。
細分市場分析
在先進計量和自動故障隔離強制實施的推動下,智慧公用事業將在2025年佔總收入的28.44%。光是美國能源局的電網韌性與創新夥伴關係(GRIP)計畫就將撥款35億美元用於展示即時電壓最佳化的項目,從而將停電時間減少高達50%。隨著市政當局部署互聯槍聲麥克風和基於人工智慧的犯罪預測系統,智慧公共安全解決方案預計將以17.24%的複合年成長率實現最高成長。例如,洛杉磯警察局升級後的即時犯罪響應中心預計將在2025年將財產犯罪的回應時間縮短14%。
多個相關領域正在豐富這項產品組合。智慧運輸利用將於2024年標準化的SAE V2X協議,以改善交通號誌協調並緩解交通堵塞。智慧建築依賴自動化暖通空調系統和人員佔用分析,通常可在三年內實現投資回報。在服務不足地區試行的智慧醫療自助服務終端已初步顯示出縮短急診室等待時間的效果。智慧安防應用針對水處理廠和變電站的邊界保護,並利用運輸安全管理局(TSA)的管線安全指南來論證投資的合理性。這些子類別共同凸顯了智慧城市市場的廣闊前景。
2025年,硬體支出佔總支出的54.46%,這反映了感測器、攝影機和邊緣伺服器等硬體的實體特性,它們能夠實現即時可視性。博世基於磁力計的停車節點已在120個城市部署,試點地區的平均停車位搜尋時間縮短了8分鐘,區域排放量降低了2.3%。相較之下,隨著市政當局轉向包含分析更新和安全修補程式的訂閱定價模式,軟體平台預計將以16.24%的複合年成長率成長。微軟的Azure數位孿生技術使18個城市能夠在虛擬環境中模擬擁塞收費區,幫助它們避免在政治上存在風險的誤判。
尤其是在面臨IT人才短缺的小規模市政當局中,服務在連結這兩個領域方面發揮著至關重要的作用。根據Linux基金會的報告,到2025年,其開放原始碼框架FIWARE/CityGML將在340個市政當局中部署,高於前一年的210個。這顯示人們對社區支持的技術堆疊越來越有信心。向軟體定義基礎設施的轉變進一步降低了供應商鎖定風險,使市政當局能夠在不移除硬體的情況下更換分析供應商。這一趨勢正在為智慧城市市場帶來結構性優勢。
區域分析
2025年,亞太地區佔了智慧城市市場收入的39.58%,這主要得益於中國到2030年建成500座智慧城市的目標。印度住宅和城鄉發展部強制要求所有人口超過百萬的城市設立綜合指揮中心,加速了對華為和阿里雲等國產平台的需求。印度的「智慧城市計畫」向100個市政當局撥款4,800億印度盧比(約58億美元),試點路段的交通堵塞狀況顯著改善了16%。日本的「社會5.0」計畫在2025年資助了23個數位孿生示範項目,其中包括一個能夠近乎即時模擬地震疏散的東京模型。
預計到2031年,非洲的複合年成長率將達到18.09%,位居全球最高之列。非洲開發銀行25億美元的「非洲城市議程」優先考慮洩漏檢測和預付式水錶的推廣。開普敦的智慧供水網路能夠迅速控制洩漏,從而延緩了耗資2.3億美元(約42億美元)的海水淡化廠的建設。基加利與韓國電信合作興建的城市物聯網骨幹網,使照明和廢棄物收整合本降低了12%。這些突破性案例表明,軟體定義基礎設施在頻寬受限的環境中同樣有效,並推動了新興經濟體智慧城市市場的擴張。
北美受益於聯邦成本分攤計劃,但面臨採購法規分散的問題。在歐洲,對開放原始碼和資料主權的重視推動了本地雲端的普及,並得到了75億歐元(87.6億美元)「數位歐洲計畫」的支持。在中東,像NEOM這樣的新型待開發區城市正在建設中,從一開始就融入了自動駕駛和基於區塊鏈的土地登記系統。在南美洲,特許經營模式盛行,僅聖保羅一地就吸引了4.2億美元的私人資本用於2024年的智慧照明項目。這些趨勢共同作用,正在使全球智慧城市市場的收入來源多元化,並增強其韌性。
其他好處:
- Excel格式的市場預測(ME)表
- 3個月的分析師支持
目錄
第1章:引言
- 研究假設和市場定義
- 調查範圍
第2章:調查方法
第3章執行摘要
第4章 市場狀況
- 市場概覽
- 市場促進因素
- 政府加大對綜合基礎建設的投入
- 擴大人工智慧和物聯網平台的應用
- 為增強應對氣候變遷的能力,感測器部署正在不斷擴大。
- 特大城市對數據驅動型城市服務的需求
- 在「能源正效益區」進行的試點計畫正在加速公共產業的支出。
- 數位孿生科技的引入縮短了地方政府的採購週期。
- 市場限制因素
- 高昂的初始維修和整合成本
- 網路安全和資料隱私問題
- 新冠疫情後,地方政府債務上限面臨壓力
- 對城市監控分析的政治抵制
- 產業價值鏈分析
- 監理情勢
- 技術展望
- 波特五力分析
- 宏觀經濟因素對市場的影響
第5章 市場規模與成長預測
- 透過解決方案
- 智慧運輸管理
- 智慧公共安全
- 智慧醫療
- 智慧建築
- 智慧公用事業
- 智慧安防
- 其他
- 按組件
- 硬體
- 軟體
- 服務
- 按部署模式
- 雲
- 現場
- 最終用戶
- 政府/市政當局
- 住宅
- 商業和工業
- 運輸/物流
- 公用事業供應商
- 其他
- 按地區
- 北美洲
- 美國
- 加拿大
- 墨西哥
- 南美洲
- 巴西
- 阿根廷
- 其他南美國家
- 歐洲
- 德國
- 英國
- 法國
- 義大利
- 西班牙
- 俄羅斯
- 其他歐洲國家
- 亞太地區
- 中國
- 日本
- 印度
- 韓國
- 澳洲和紐西蘭
- 東南亞
- 其他亞太國家
- 中東
- 沙烏地阿拉伯
- 阿拉伯聯合大公國
- 土耳其
- 其他中東國家
- 非洲
- 南非
- 奈及利亞
- 其他非洲國家
- 北美洲
第6章 競爭情勢
- 市場集中度
- 策略趨勢
- 市佔率分析
- 公司簡介
- ABB Ltd.
- Cisco Systems Inc.
- Emerson Electric Co.
- International Business Machines Corporation
- Telefonaktiebolaget LM Ericsson
- Schneider Electric SE
- General Electric Company
- Siemens AG
- Huawei Technologies Co. Ltd.
- Honeywell International Inc.
- Hitachi Ltd.
- Nokia Corporation
- Koninklijke Philips NV
- Microsoft Corporation
- Oracle Corporation
- AT&T Inc.
- Intel Corporation
- NEC Corporation
- Robert Bosch GmbH(Bosch Security Systems)
- Samsung Electronics Co. Ltd.
- Panasonic Corporation
- Verizon Communications Inc.
- Alibaba Group Holding Ltd.(Alibaba Cloud)
- Johnson Controls International plc
- Thales Group
第7章 市場機會與未來展望
According to Mordor Intelligence, the smart cities market size is valued at USD 1.96 trillion in 2026 and is projected to reach USD 4.06 trillion in 2031, translating into a 15.65% CAGR over the forecast period.
This report is Segmented by Solution (Smart Mobility Management, Smart Public Safety, and More), Component (Hardware, Software, and Services), Deployment Model (Cloud, and On-Premises), End-User (Government and Municipal, Residential, and More), and Geography. The Market Forecasts are Provided in Terms of Value (USD).
Global Smart Cities Market Trends and Insights
Surging Government Funding for Integrated Infrastructure
Multi-modal grant programs are shifting risk from local balance sheets to national budgets. The United States ARPA-I has earmarked USD 2 billion for proof-of-concept projects that combine electric-vehicle charging, smart streetlights and storm-water sensors within shared conduit, cutting installation costs by nearly 40%. The United Kingdom's Local Digital Fund committed GBP 500 million (USD 635 million) in 2025 to standardize application programming interfaces across council services, giving residents single-portal access to parking permits and waste-collection schedules. Japan's Digital Agency allotted USD 1.2 billion to reinforce mid-tier cities with fiber backhaul and edge compute nodes that double as disaster-response hubs. Collectively, these programs accelerate adoption in municipalities that lack bonding authority, smoothing the near-term revenue curve for vendors across the smart cities market.
Rising Adoption of AI and IoT Platforms
Cities are moving from descriptive dashboards to prescriptive analytics that automate resource allocation. Singapore's Smart Nation machine-learning models predicted bus crowding with 92% accuracy in 2025, trimming average commute times by 11 minutes. ITU's Y.4000 standards, ratified in 2024, unlocked true plug-and-play interoperability, letting procurement teams swap out sensors without being locked into monolithic suites. Munich's open-source digital twin processed 2.3 billion sensor readings to optimize snow-removal routes, slashing fuel use by 18% and saving EUR 4.2 million (USD 4.6 million) in overtime. Such examples validate the value proposition and shorten payback periods, spurring incremental demand in the smart cities market.
High Upfront Retrofit and Integration Costs
Legacy assets in mature cities lack spare conduit, power capacity or network backhaul, forcing expensive civil works before sensor rollouts. The American Society of Civil Engineers pegged vehicle-to-infrastructure upgrades at USD 175,000-250,000 per intersection in 2025, roughly four times the greenfield cost. Chicago's smart-streetlight initiative absorbed USD 18 million in unforeseen transformer upgrades, delaying completion by 14 months. Integration complexity further inflates budgets as municipalities translate data from decades-old SCADA systems into cloud-ready formats, often requiring bespoke middleware that adds 15-25% to licensing fees. These barriers can postpone deal closure and slow initial uptake in the smart cities market.
Other drivers and restraints analyzed in the detailed report include:
- Climate-Resilience Mandates Elevating Sensor Deployments
- Data-Driven Urban Services Demand in Megacities
- Cyber-Security and Data-Privacy Concerns
For complete list of drivers and restraints, kindly check the Table Of Contents.
Segment Analysis
Smart utilities represented 28.44% of total revenue in 2025, buoyed by mandates for advanced metering and automated fault isolation. The United States Department of Energy's Grid Resilience and Innovation Partnerships program alone released USD 3.5 billion to projects that demonstrate real-time voltage optimization, slicing outage durations by up to 50%. Smart public safety solutions are set to deliver the fastest 17.24% CAGR, as municipalities deploy interconnected gunshot-detection microphones and AI-based crime prediction. For instance, the Los Angeles Police Department's upgraded real-time crime center cut property-crime response times by 14% in 2025.
Multiple adjacent domains round out the portfolio. Smart mobility takes advantage of Society of Automotive Engineers V2X protocols standardized in 2024, improving traffic-signal coordination and reducing congestion. Smart buildings rely on automated HVAC and occupancy analytics that hit a typical three-year payback. Pilot smart healthcare kiosks in underserved neighborhoods demonstrate early success in trimming emergency-room backlog. Smart security applications address perimeter protection for water-treatment plants and substations, leveraging Transportation Security Administration pipeline directives to justify investment. Together these subcategories reinforce the breadth of the smart cities market.
Hardware commanded 54.46% of 2025 outlays, reflecting the tangible nature of sensors, cameras and edge servers that deliver instant visibility. Bosch magnetometer parking nodes, deployed across 120 cities, cut average parking search time by eight minutes and trimmed local emissions by 2.3% in pilot zones. In contrast, software platforms are forecast to climb at a 16.24% CAGR, as municipalities pivot toward subscription fees that bundle analytics updates and security patches. Microsoft's Azure Digital Twins gave 18 cities the ability to simulate congestion-pricing zones in silico, helping avoid politically risky missteps.
Services bridge the two worlds, especially for smaller municipalities lacking deep IT benches. The Linux Foundation reports 340 municipal installations of its open-source FIWARE and CityGML frameworks as of 2025, up from 210 a year earlier, signaling confidence in community-supported stacks. The shift toward software-defined infrastructure further weakens vendor lock-in, letting cities change analytics vendors without ripping out hardware, a trend that structurally benefits the smart cities market.
Complete Report Scope:
- By Solution
- Smart Mobility Management
- Smart Public Safety
- Smart Healthcare
- Smart Building
- Smart Utilities
- Smart Security
- Other Solutions
- By Component
- Hardware
- Software
- Services
- By Deployment Model
- Cloud
- On-Premise
- By End-User
- Government and Municipal
- Residential
- Commercial and Industrial
- Transportation and Logistics
- Utilities Providers
- Other End-User
- By Geography
- North America
- United States
- Canada
- Mexico
- South America
- Brazil
- Argentina
- Rest of South America
- Europe
- Germany
- United Kingdom
- France
- Italy
- Spain
- Russia
- Rest of Europe
- Asia Pacific
- China
- Japan
- India
- South Korea
- Australia and New Zealand
- Southeast Asia
- Rest of Asia Pacific
- Middle East
- Saudi Arabia
- United Arab Emirates
- Turkey
- Rest of Middle East
- Africa
- South Africa
- Nigeria
- Rest of Africa
- North America
Geography Analysis
Asia Pacific generated 39.58% of smart cities market revenue in 2025, underpinned by China's mandate to establish 500 smart cities by 2030. The Ministry of Housing and Urban-Rural Development requires every city above 1 million residents to operate an integrated command center, accelerating demand for domestic platforms offered by Huawei and Alibaba Cloud. India's Smart Cities Mission disbursed INR 480 billion (USD 5.8 billion) across 100 municipalities, showing measurable congestion reductions of 16% on pilot corridors. Japan's Society 5.0 funded 23 digital-twin pilots in 2025, including a Tokyo model that simulates earthquake evacuations in near real time.
Africa is projected to record an 18.09% CAGR through 2031, the highest worldwide. The African Development Bank's USD 2.5 billion African Urban Agenda prioritizes water-loss detection and prepaid metering. Cape Town's smart water grid plugged leaks fast enough to defer a ZAR 4.2 billion (USD 230 million) desalination plant. Kigali's city-wide IoT backbone, built with Korea Telecom, reduced lighting and waste-collection costs by 12%. These leapfrog deployments validate software-defined infrastructure in bandwidth-constrained environments, propelling the smart cities market across frontier economies.
North America benefits from federal cost-sharing programs but contends with fragmented procurement rules. Europe's focus on open-source and data sovereignty drives uptake of locally hosted clouds, underwritten by the EUR 7.5 billion (USD 8.76 billion) Digital Europe Programme. The Middle East is building showcase greenfield cities such as NEOM that embed autonomous mobility and blockchain land registries from day one. South America relies on concession models; Sao Paulo alone attracted USD 420 million in private capital for smart lighting in 2024. Collectively, these patterns diversify addressable revenue streams, adding resilience to the global smart cities market.
- ABB Ltd.
- Cisco Systems Inc.
- Emerson Electric Co.
- International Business Machines Corporation
- Telefonaktiebolaget LM Ericsson
- Schneider Electric SE
- General Electric Company
- Siemens AG
- Huawei Technologies Co. Ltd.
- Honeywell International Inc.
- Hitachi Ltd.
- Nokia Corporation
- Koninklijke Philips N.V.
- Microsoft Corporation
- Oracle Corporation
- AT&T Inc.
- Intel Corporation
- NEC Corporation
- Robert Bosch GmbH (Bosch Security Systems)
- Samsung Electronics Co. Ltd.
- Panasonic Corporation
- Verizon Communications Inc.
- Alibaba Group Holding Ltd. (Alibaba Cloud)
- Johnson Controls International plc
- Thales Group
Additional Benefits:
- The market estimate (ME) sheet in Excel format
- 3 months of analyst support
TABLE OF CONTENTS
1 INTRODUCTION
- 1.1 Study Assumptions and Market Definition
- 1.2 Scope of the Study
2 RESEARCH METHODOLOGY
3 EXECUTIVE SUMMARY
4 MARKET LANDSCAPE
- 4.1 Market Overview
- 4.2 Market Drivers
- 4.2.1 Surging Government Funding for Integrated Infrastructure
- 4.2.2 Rising Adoption of AI and IoT Platforms
- 4.2.3 Climate-Resilience Mandates Elevating Sensor Deployments
- 4.2.4 Data-Driven Urban Services Demand in Megacities
- 4.2.5 Energy-Positive District Pilots Accelerating Utilities Spend
- 4.2.6 Digital-Twin Adoption Shortening Municipal Procurement Cycles
- 4.3 Market Restraints
- 4.3.1 High Upfront Retrofit and Integration Costs
- 4.3.2 Cyber-Security and Data-Privacy Concerns
- 4.3.3 Municipal Debt-Ceiling Pressure Post-COVID
- 4.3.4 Political Resistance to Urban Surveillance Analytics
- 4.4 Industry Value Chain Analysis
- 4.5 Regulatory Landscape
- 4.6 Technological Outlook
- 4.7 Porter's Five Forces Analysis
- 4.7.1 Bargaining Power of Suppliers
- 4.7.2 Bargaining Power of Buyers
- 4.7.3 Threat of New Entrants
- 4.7.4 Threat of Substitutes
- 4.7.5 Intensity of Competitive Rivalry
- 4.8 Impact of Macroeconomic Factors on the Market
5 MARKET SIZE AND GROWTH FORECASTS (VALUE)
- 5.1 By Solution
- 5.1.1 Smart Mobility Management
- 5.1.2 Smart Public Safety
- 5.1.3 Smart Healthcare
- 5.1.4 Smart Building
- 5.1.5 Smart Utilities
- 5.1.6 Smart Security
- 5.1.7 Other Solutions
- 5.2 By Component
- 5.2.1 Hardware
- 5.2.2 Software
- 5.2.3 Services
- 5.3 By Deployment Model
- 5.3.1 Cloud
- 5.3.2 On-Premise
- 5.4 By End-User
- 5.4.1 Government and Municipal
- 5.4.2 Residential
- 5.4.3 Commercial and Industrial
- 5.4.4 Transportation and Logistics
- 5.4.5 Utilities Providers
- 5.4.6 Other End-User
- 5.5 By Geography
- 5.5.1 North America
- 5.5.1.1 United States
- 5.5.1.2 Canada
- 5.5.1.3 Mexico
- 5.5.2 South America
- 5.5.2.1 Brazil
- 5.5.2.2 Argentina
- 5.5.2.3 Rest of South America
- 5.5.3 Europe
- 5.5.3.1 Germany
- 5.5.3.2 United Kingdom
- 5.5.3.3 France
- 5.5.3.4 Italy
- 5.5.3.5 Spain
- 5.5.3.6 Russia
- 5.5.3.7 Rest of Europe
- 5.5.4 Asia Pacific
- 5.5.4.1 China
- 5.5.4.2 Japan
- 5.5.4.3 India
- 5.5.4.4 South Korea
- 5.5.4.5 Australia and New Zealand
- 5.5.4.6 Southeast Asia
- 5.5.4.7 Rest of Asia Pacific
- 5.5.5 Middle East
- 5.5.5.1 Saudi Arabia
- 5.5.5.2 United Arab Emirates
- 5.5.5.3 Turkey
- 5.5.5.4 Rest of Middle East
- 5.5.6 Africa
- 5.5.6.1 South Africa
- 5.5.6.2 Nigeria
- 5.5.6.3 Rest of Africa
- 5.5.1 North America
6 COMPETITIVE LANDSCAPE
- 6.1 Market Concentration
- 6.2 Strategic Moves
- 6.3 Market Share Analysis
- 6.4 Company Profiles (includes Global level Overview, Market level overview, Core Segments, Financials as available, Strategic Information, Market Rank/Share for key companies, Products and Services, and Recent Developments)
- 6.4.1 ABB Ltd.
- 6.4.2 Cisco Systems Inc.
- 6.4.3 Emerson Electric Co.
- 6.4.4 International Business Machines Corporation
- 6.4.5 Telefonaktiebolaget LM Ericsson
- 6.4.6 Schneider Electric SE
- 6.4.7 General Electric Company
- 6.4.8 Siemens AG
- 6.4.9 Huawei Technologies Co. Ltd.
- 6.4.10 Honeywell International Inc.
- 6.4.11 Hitachi Ltd.
- 6.4.12 Nokia Corporation
- 6.4.13 Koninklijke Philips N.V.
- 6.4.14 Microsoft Corporation
- 6.4.15 Oracle Corporation
- 6.4.16 AT&T Inc.
- 6.4.17 Intel Corporation
- 6.4.18 NEC Corporation
- 6.4.19 Robert Bosch GmbH (Bosch Security Systems)
- 6.4.20 Samsung Electronics Co. Ltd.
- 6.4.21 Panasonic Corporation
- 6.4.22 Verizon Communications Inc.
- 6.4.23 Alibaba Group Holding Ltd. (Alibaba Cloud)
- 6.4.24 Johnson Controls International plc
- 6.4.25 Thales Group
7 MARKET OPPORTUNITIES AND FUTURE OUTLOOK
- 7.1 White-Space and Unmet-Need Assessment

 智慧公共安全舉措:全球,2026 年
 智慧城市通訊服務:市場佔有率分析、產業趨勢與統計、成長預測(2026-2031)
 2035年前自給自足型都市公園市場分析和預測:按類型、產品、服務、技術、組件、應用、材料類型、最終用戶、安裝類型和解決方案。快速城市綠化系統市場分析及預測(至2035年):按類型、產品、服務、技術、組件、應用、材料類型、最終用戶、安裝模式和解決方案分類
 數位旅遊生態系統市場預測至2034年-按解決方案類型、整合類型、連接技術、交通方式、最終用戶和地區分類的全球分析
 智慧城市市場:全球市場預測,2026-2032年趨勢與機會概況-自治城市城市便利即服務 (CaaS) 市場預測至 2034 年:按服務類型、技術平台、應用、最終用戶和地區分類的全球分析智慧停車管理市場:預測至 2034 年-按解決方案、組件、技術、停車類型、最終用戶和地區分類的全球分析
 2026-2030年全球智慧城市市場