


 |
市場調查報告書
商品編碼
2120660
雙酚A(BPA):市場佔有率分析、行業趨勢和統計數據、成長預測(2026-2031年)Bisphenol A (BPA) - Market Share Analysis, Industry Trends & Statistics, Growth Forecasts (2026 - 2031) |
||||||

※ 本網頁內容可能與最新版本有所差異。詳細情況請與我們聯繫。
根據 Mordor Intelligence 估計,2025 年雙酚 A 市場規模為 933 萬噸,預計到 2031 年將從 2026 年的 992 萬噸成長至 1349 萬噸,預測期(2026-2031 年)複合年成長率為 6.34%。
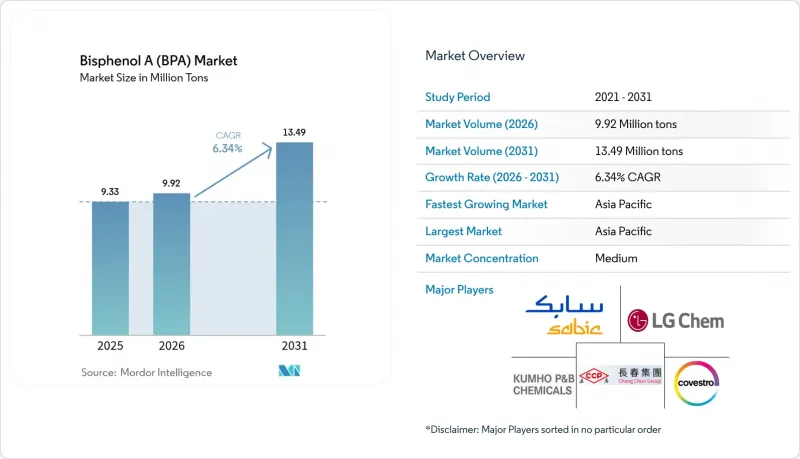
本報告按應用領域(聚碳酸酯樹脂、環氧樹脂、不飽和聚酯樹脂等)、終端用戶行業(電氣電子、汽車及交通運輸、建築及基礎設施、包裝等)和地區(亞太地區、北美、歐洲、南美、中東和非洲)進行細分。市場預測以噸為單位。
全球雙酚A(BPA)市場趨勢及洞察
風力發電機葉片對環氧樹脂的需求不斷成長
隨著風力發電規模的擴大,高性能環氧樹脂正被用於製造長度超過100公尺的風力發電機葉片,每片葉片都含有數百公斤的BPA衍生樹脂。到2025年,歐洲離岸風力發電電場將消耗約24,000噸此類環氧樹脂,並且隨著沿海計畫授權的加速,這一數字還在不斷成長。 BPA基環氧樹脂優異的黏合性、耐化學性和抗疲勞壽命滿足了決定發電平準化成本的葉片使用壽命目標。類似的特性也促使其在機艙罩和支管帽等領域得到更廣泛的應用。由於耐久性和成本在可再生能源供應鏈中變得至關重要,BPA的供應商已確保了穩定的銷售管道,幾乎不受食品接觸禁令的影響。同時,航太計畫對環氧樹脂的需求依然強勁,但由於認證週期較長,預計大部分需求將推遲到2028年或更晚才能實現。
亞太地區產能的提高將降低單位成本。
2024年上半年,中國當地新增工廠名目產能69.6萬噸/年,對全球合約價格構成下行壓力。這些工廠毗鄰異丙苯和苯酚-丙酮生產中心,降低了物流成本和營運資金。西方生產商由於反應器老舊且規模較小,面臨高昂的固定成本,導致2025年北美苯酚生產設施的運轉率55-60%。這種利潤率差距迫使一些公司退出消費品雙酚A業務,轉而生產特殊衍生物。此外,中國為支持聚碳酸酯生產線而新增的自用設施將進一步減少消費品貿易,將高成本地區的出口商排除在市場之外,並重塑雙酚A市場的貿易格局。
苯酚和丙酮等原物料價格的波動
2025年第四季,北美苯酚平均價格為每噸902美元,而亞太地區則維持在每噸728美元。這種價格差異引發了套利,導致現貨價格波動高達20%。由於雙酚A(BPA)吸收了苯酚成本的很大一部分,聚碳酸酯經銷商難以簽訂長期契約,而汽車原始設備製造商(OEM)則轉向固定價格契約,將風險轉移給了樹脂供應商。非一體化生產商降低了價格,產能運轉率維持在55%至60%之間。上游苯的價格仍與原油價格波動密切相關,因此原物料價格的劇烈變化可能在幾週內波及雙酚A市場。
細分市場分析
預計到2025年,聚碳酸酯將佔雙酚A(BPA)市場佔有率的61.62%,這反映了其在LED透鏡、智慧型手機機殼和輕質汽車玻璃等領域的成熟應用。然而,2025年18%至22%的價格波動促使汽車製造商試用聚碳酸酯-ABS共混物,以在不影響抗衝擊性的前提下減少BPA的使用。儘管採取了這些減少BPA的措施,但預計到2031年,對聚碳酸酯的需求仍將保持強勁,因為全球電動車平台都依賴透明、堅韌的玻璃來減輕重量。相較之下,環氧樹脂雖然初始市場規模較小,但預計將以6.44%的複合年成長率(CAGR)超越整個雙酚A市場,這主要得益於風力發電機葉片和航太材料的應用。單一離岸風力發電機葉片需要數百公斤樹脂,而超過100公尺的葉片長度確保了其數十年的使用壽命,從而帶來了穩定的需求。預計在預測期內,這兩種產品將繼續佔據雙酚 A 市場佔有率的五分之四以上。
其他應用,如阻燃劑四溴雙酚A、不飽和聚酯樹脂和特殊塗料,雖然市場定位小眾,但盈利豐厚。四溴雙酚A在印刷電路基板的安全配方中發揮關鍵作用,因為使用無鹵替代品會降低其阻燃性能。由三井化學和帝人共同開發的生質能衍生雙酚A預計在2028年進入中試生產階段,但實現成本等效仍是一項挑戰。雖然這些小規模應用有助於整體需求多元化,但如果消費品產業的替代加速,它們目前還不足以抵消通用聚碳酸酯需求的未來下降。
區域分析
預計到2025年,亞太地區將佔據雙酚A市場63.10%的佔有率,並在2031年之前以7.32%的複合年成長率成長。光是中國一國到2024年運作593.1萬噸/年的產能,而2025年1月至8月的產量達到315萬噸,較去年同期成長12%。萬華、青島海灣和恆力等公司的投產新增了69.6萬噸/年的產能,進一步提升了該地區的成本競爭力。在印度,建設計畫正在進行中,旨在減少對進口的過度依賴。 2023-24會計年度印度有機化學品進口量為501.8萬噸,顯示印度半島有潛在需求,最終將透過國內生產來滿足此需求。
由於原物料成本上漲和反傾銷稅造成的貿易扭曲,雙酚A在北美和歐洲的市佔率合計正在下降。 2025年第四季度,北美苯酚價格徘徊在每噸902美元左右,但來自亞洲的進口價格低於國內現金成本,這給一體化生產商的利潤率帶來了壓力。歐盟17.3%至33%的關稅保護了本地環氧樹脂供應商,但也推高了下游化合物生產商的成本,促使生產轉移到亞洲。西方供應商正透過更重視循環原料和特種等級產品來應對這項挑戰,力求在銷售量下滑的情況下維持價值。
南美洲、中東和非洲地區雖然規模較小,但仍是具有重要戰略意義的地區。儘管2024年第三季獲利下降了63.8%,沙烏地基礎工業公司(SABIC)的多元化策略仍將聚碳酸酯作為投資目標。巴西是世界第六大汽車生產國,一旦貨幣穩定,輕質玻璃的應用機會將會出現。南非的建築規範現在包含了阻燃聚碳酸酯板,這開啟了小規模但成長迅速的市場。雖然這些新興市場的規模小於亞太地區,但它們將為全球雙酚A市場需求帶來韌性。
其他好處:
- Excel格式的市場預測(ME)表
- 3個月的分析師支持
目錄
第1章:引言
- 研究假設和市場定義
- 調查範圍
第2章:調查方法
第3章執行摘要
第4章 市場狀況
- 市場概覽
- 市場促進因素
- 風力發電機葉片對環氧樹脂的需求不斷成長
- 亞太地區產能的提高降低了單位成本。
- 用於先進複合材料的航太級雙酚A衍生物
- 苯酚-丙酮連續流一體化製程正在提高利潤率。
- 封閉回路型雙酚A解聚合和增值回收技術正引起人們的注意。
- 市場限制因素
- 苯酚和丙酮等原物料價格的波動
- 對來自亞洲的BPA出口徵收反傾銷稅
- 在關鍵電子設備中快速採用不含雙酚A的樹脂
- 價值鏈分析
- 波特五力模型
- 原料分析
- 技術趨勢概述
- 貿易概覽
- 定價概覽
- 監理政策分析
第5章 市場規模與成長預測
- 透過使用
- 聚碳酸酯樹脂
- 環氧樹脂
- 不飽和聚酯樹脂
- 阻燃劑
- 其他用途
- 按最終用戶行業分類
- 電氣和電子設備
- 汽車和運輸業
- 建築和基礎設施
- 包裝
- 其他(醫療用品、體育用品等)
- 按地區
- 亞太地區
- 中國
- 印度
- 日本
- 韓國
- ASEAN
- 其他亞太國家
- 北美洲
- 美國
- 加拿大
- 墨西哥
- 歐洲
- 德國
- 英國
- 法國
- 義大利
- 西班牙
- 俄羅斯
- 其他歐洲國家
- 南美洲
- 巴西
- 阿根廷
- 其他南美國家
- 中東和非洲
- 沙烏地阿拉伯
- 南非
- 其他中東和非洲國家
- 亞太地區
第6章 競爭情勢
- 市場集中度
- 策略趨勢
- 市佔率和排名分析
- 公司簡介
- Altivia
- Chang Chun Group
- Covestro AG
- Formosa Chemicals & Fibre Corp
- Hexion
- Idemitsu Kosan Co., Ltd.
- INEOS
- Kumho P&B Chemicals Inc.
- LG Chem
- Lihua Yiweiyuan Chemical Co., Ltd.
- Mitsubishi Chemical Group Corporation
- NAN YA PLASTICS CORPORATION
- Olin Corporation
- PTT Global Chemical Public Company Limited
- SABIC
- Samyang Innochem Corporation
- Sinopec
- Solvay
- Teijin Limited
- Zhejiang Petroleum & Chemical Co. Ltd
第7章 市場機會與未來展望
According to Mordor Intelligence, the bisphenol a market size was valued at 9.33 million tons in 2025 and is estimated to grow from 9.92 million tons in 2026 to reach 13.49 million tons by 2031, at a CAGR of 6.34% during the forecast period (2026-2031).
This report is Segmented by Application (Polycarbonate Resins, Epoxy Resins, Unsaturated Polyester Resins, and More), End-User Industry (Electrical and Electronics, Automotive and Transportation, Construction and Infrastructure, Packaging, and More), and Geography (Asia-Pacific, North America, Europe, South America, and the Middle East and Africa). The Market Forecasts are Provided in Terms of Volume (tons).
Global Bisphenol A (BPA) Market Trends and Insights
Growth in Epoxy-Resin Demand for Wind-Turbine Blades
Wind-energy expansion is pulling high-performance epoxy resins into blades exceeding 100 m in length, and each blade contains several hundred kilograms of BPA-derived resin. Europe's offshore installations consumed about 24,000 tons of such epoxy in 2025, and volumes rise as coastal permitting accelerates. The superior adhesion, chemical resistance, and fatigue life of BPA-based epoxy meet blade-longevity targets that determine the levelized cost of energy. Similar property sets are driving adoption within nacelle covers and spar caps. As the renewable-energy supply chain emphasizes durability over cost alone, integrated BPA suppliers gain stable offtake that is largely insulated from food-contact bans. In parallel, aerospace programs keep epoxy demand on a steady trajectory, though long certification cycles push the bulk of lift past 2028.
Asia-Pacific Capacity Additions Lowering Unit Costs
New plants in mainland China added 696,000 t/y of nameplate capacity during 1H-2024, putting downward pressure on global contract prices. These sites sit next to cumene and phenol-acetone hubs, cutting logistics outlays and working capital. Western producers with older, smaller reactors face higher fixed costs, so North American phenol assets ran at only 55-60% through 2025. The margin gap forces some to exit merchant BPA and pivot toward specialty derivatives. Additional captive units that support Chinese polycarbonate lines will shrink merchant trade further, crowding exporters from high-cost geographies and reshaping Bisphenol A market trade flows.
Phenol and Acetone Feedstock Price Volatility
North American phenol averaged USD 902/t in Q4-2025 versus Asia-Pacific at USD 728/t, a gap that spurred arbitrage cargoes and drove spot volatility above 20%. Because BPA absorbs most phenol cost, polycarbonate sellers struggled to secure long-term contracts, and automotive OEMs moved toward fixed-price deals that shift risk back to resin suppliers. Non-integrated producers trimmed rates, leaving assets at 55-60% utilization. Upstream benzene remains tied to crude swings, so feedstock shocks can ripple through the Bisphenol A market within weeks.
Other drivers and restraints analyzed in the detailed report include:
- Aerospace-Grade BPA Derivatives for Advanced Composites
- Continuous-Flow Phenol-Acetone Integration Boosting Margins
- Anti-Dumping Duties on Asian BPA Exports
For complete list of drivers and restraints, kindly check the Table Of Contents.
Segment Analysis
Polycarbonate occupied 61.62% of the Bisphenol A market size in 2025, reflecting entrenched use in LED lenses, smartphone casings, and lightweight vehicle glazing. Price swings of 18-22% during 2025, however, encouraged automakers to test polycarbonate-ABS blends that lower BPA intensity without sacrificing impact performance. Even with these dilution tactics, global EV platforms rely on clear, tough glazing to cut mass, sustaining polycarbonate demand through 2031. Epoxy resin, by contrast, started from a smaller base but is forecast to outpace the overall Bisphenol A market at 6.44% CAGR, buoyed by wind-turbine blades and aerospace composites. Each offshore blade integrates hundreds of kilograms of resin, and blade lengths rising beyond 100 m lock in multi-decade service cycles that stabilize volume. Together, these two products will continue to represent more than four-fifths of the Bisphenol A market share during the outlook period.
Other applications, including flame-retardant tetrabromobisphenol A, unsaturated polyester resins, and specialty coatings, hold niche but profitable positions. Tetrabromobisphenol A dominates printed-circuit-board safety formulations where halogen-free substitutes weaken ignition resistance. Biomass-derived BPA under joint development by Mitsui Chemicals and Teijin could enter pilot scale by 2028, yet cost parity remains elusive. Collectively, these smaller outlets ensure demand diversity, but they lack the scale to counterbalance any future decline in commodity polycarbonate should substitution accelerate in consumer goods.
Complete Report Scope:
- By Application
- Polycarbonate Resins
- Epoxy Resins
- Unsaturated Polyester Resins
- Flame Retardants
- Other Applications
- By End-user Industry
- Electrical and Electronics
- Automotive and Transportation
- Construction and Infrastructure
- Packaging
- Others (Medical, Sports Equipment, etc.)
- By Geography
- Asia-Pacific
- China
- India
- Japan
- South Korea
- ASEAN
- Rest of Asia-Pacific
- North America
- United States
- Canada
- Mexico
- Europe
- Germany
- United Kingdom
- France
- Italy
- Spain
- Russia
- Rest of Europe
- South America
- Brazil
- Argentina
- Rest of South America
- Middle-East and Africa
- Saudi Arabia
- South Africa
- Rest of Middle-East and Africa
- Asia-Pacific
Geography Analysis
Asia-Pacific held 63.10% of the Bisphenol A market share in 2025 and is projected to grow at a 7.32% CAGR to 2031. China alone operated 5.931 million t/y of capacity by 2024 and lifted January-August 2025 output 12% year-on-year to 3.15 million tons. Recent startups at Wanhua, Qingdao Haiwan, and Hengli added 696,000 t/y, underpinning regional cost leadership. India's USD 37 billion petrochemical build-out through 2030 seeks to reduce heavy dependence on imports, 5.018 million-ton inflows of organic chemicals in FY 2023-24 signal latent demand the subcontinent will eventually meet locally.
North America and Europe together account for a declining slice of the Bisphenol A market as higher feedstock costs and anti-dumping duties distort trade. North American phenol hovered near USD 902/t in Q4-2025, squeezing integrated margins when Asian imports landed below domestic cash costs. EU duties of 17.3-33% shield local epoxy suppliers yet raise downstream compounder costs and encourage production shifts toward Asia. Western suppliers respond by doubling down on circular feedstocks and specialty grades, hoping to preserve value despite volume leakage.
South America and the Middle East & Africa remain small but strategic. SABIC's diversification agenda, despite a 63.8% profit drop in Q3-2024, keeps polycarbonate on the investment map. Brazilian vehicle output ranks sixth worldwide, offering opportunities for lightweight glazing once currency stability returns. South African construction specifications now include flame-retardant polycarbonate panels, opening a modest but growing outlet. These emerging nodes will not rival Asia-Pacific in scale but add resilience to global Bisphenol A market demand.
- Altivia
- Chang Chun Group
- Covestro AG
- Formosa Chemicals & Fibre Corp
- Hexion
- Idemitsu Kosan Co., Ltd.
- INEOS
- Kumho P&B Chemicals Inc.
- LG Chem
- Lihua Yiweiyuan Chemical Co., Ltd.
- Mitsubishi Chemical Group Corporation
- NAN YA PLASTICS CORPORATION
- Olin Corporation
- PTT Global Chemical Public Company Limited
- SABIC
- Samyang Innochem Corporation
- Sinopec
- Solvay
- Teijin Limited
- Zhejiang Petroleum & Chemical Co. Ltd
Additional Benefits:
- The market estimate (ME) sheet in Excel format
- 3 months of analyst support
TABLE OF CONTENTS
1 Introduction
- 1.1 Study Assumptions and Market Definition
- 1.2 Scope of the Study
2 Research Methodology
3 Executive Summary
4 Market Landscape
- 4.1 Market Overview
- 4.2 Market Drivers
- 4.2.1 Growth in epoxy-resin demand for wind-turbine blades
- 4.2.2 Asia-Pacific capacity additions lowering unit costs
- 4.2.3 Aerospace-grade BPA derivatives for advanced composites
- 4.2.4 Continuous-flow phenol-acetone integration boosting margins
- 4.2.5 Closed-loop BPA depolymerisation and upcycling technologies gain traction
- 4.3 Market Restraints
- 4.3.1 Phenol and acetone feedstock price volatility
- 4.3.2 Anti-dumping duties on Asian BPA exports
- 4.3.3 Rapid adoption of BPA-free resins in critical electronics
- 4.4 Value Chain Analysis
- 4.5 Porter's Five Forces
- 4.5.1 Bargaining Power of Suppliers
- 4.5.2 Bargaining Power of Buyers
- 4.5.3 Threat of New Entrants
- 4.5.4 Threat of Substitutes
- 4.5.5 Degree of Competition
- 4.6 Feedstock Analysis
- 4.7 Technological Snapshot
- 4.8 Trade Overview
- 4.9 Price Overview
- 4.10 Regulatory Policy Analysis
5 Market Size and Growth Forecasts (Volume)
- 5.1 By Application
- 5.1.1 Polycarbonate Resins
- 5.1.2 Epoxy Resins
- 5.1.3 Unsaturated Polyester Resins
- 5.1.4 Flame Retardants
- 5.1.5 Other Applications
- 5.2 By End-user Industry
- 5.2.1 Electrical and Electronics
- 5.2.2 Automotive and Transportation
- 5.2.3 Construction and Infrastructure
- 5.2.4 Packaging
- 5.2.5 Others (Medical, Sports Equipment, etc.)
- 5.3 By Geography
- 5.3.1 Asia-Pacific
- 5.3.1.1 China
- 5.3.1.2 India
- 5.3.1.3 Japan
- 5.3.1.4 South Korea
- 5.3.1.5 ASEAN
- 5.3.1.6 Rest of Asia-Pacific
- 5.3.2 North America
- 5.3.2.1 United States
- 5.3.2.2 Canada
- 5.3.2.3 Mexico
- 5.3.3 Europe
- 5.3.3.1 Germany
- 5.3.3.2 United Kingdom
- 5.3.3.3 France
- 5.3.3.4 Italy
- 5.3.3.5 Spain
- 5.3.3.6 Russia
- 5.3.3.7 Rest of Europe
- 5.3.4 South America
- 5.3.4.1 Brazil
- 5.3.4.2 Argentina
- 5.3.4.3 Rest of South America
- 5.3.5 Middle-East and Africa
- 5.3.5.1 Saudi Arabia
- 5.3.5.2 South Africa
- 5.3.5.3 Rest of Middle-East and Africa
- 5.3.1 Asia-Pacific
6 Competitive Landscape
- 6.1 Market Concentration
- 6.2 Strategic Moves
- 6.3 Market Share(%)/Ranking Analysis
- 6.4 Company Profiles (includes Global Overview, Market Overview, Core Segments, Financials, Strategic Information, Products and Services, Recent Developments)
- 6.4.1 Altivia
- 6.4.2 Chang Chun Group
- 6.4.3 Covestro AG
- 6.4.4 Formosa Chemicals & Fibre Corp
- 6.4.5 Hexion
- 6.4.6 Idemitsu Kosan Co., Ltd.
- 6.4.7 INEOS
- 6.4.8 Kumho P&B Chemicals Inc.
- 6.4.9 LG Chem
- 6.4.10 Lihua Yiweiyuan Chemical Co., Ltd.
- 6.4.11 Mitsubishi Chemical Group Corporation
- 6.4.12 NAN YA PLASTICS CORPORATION
- 6.4.13 Olin Corporation
- 6.4.14 PTT Global Chemical Public Company Limited
- 6.4.15 SABIC
- 6.4.16 Samyang Innochem Corporation
- 6.4.17 Sinopec
- 6.4.18 Solvay
- 6.4.19 Teijin Limited
- 6.4.20 Zhejiang Petroleum & Chemical Co. Ltd
7 Market Opportunities and Future Outlook
- 7.1 White-space and Unmet-need Assessment

 雙酚替代品全球市場規模、佔有率、趨勢和成長分析報告(2026-2034)
 雙酚A市場-2026-2032年全球市場預測
 2026 年至 2035 年雙酚替代品的市場機會、成長要素、產業趨勢與預測。
 雙酚A市場:按應用和地區分類雙酚S市場:依產品類型、劑型、應用、終端用戶產業及通路分類-2026-2032年全球預測熱塑性4,4-聯苯酚市場:依產品形式、製造流程、聚合物等級、最終用途產業和分銷通路分類 - 全球預測(2026-2032年)
 雙酚 A 市場報告:趨勢、預測和競爭分析(至 2031 年)
 雙酚 A 全球市場分析:工廠產能、產量、利用率、需求和供應、最終用戶行業、銷售渠道、區域需求、公司份額、對外貿易 (2015-2032)