


 |
市場調查報告書
商品編碼
2120527
安全與漏洞管理:市場佔有率分析、產業趨勢與統計、成長預測(2026-2031)Security And Vulnerability Management - Market Share Analysis, Industry Trends & Statistics, Growth Forecasts (2026 - 2031) |
||||||

※ 本網頁內容可能與最新版本有所差異。詳細情況請與我們聯繫。
根據 Mordor Intelligence 估計,到 2026 年,安全和漏洞管理市場價值將達到 178.2 億美元,從 2025 年的 167.5 億美元成長到 2031 年的 242.7 億美元。
預計從 2026 年到 2031 年,其複合年成長率將達到 6.4%。
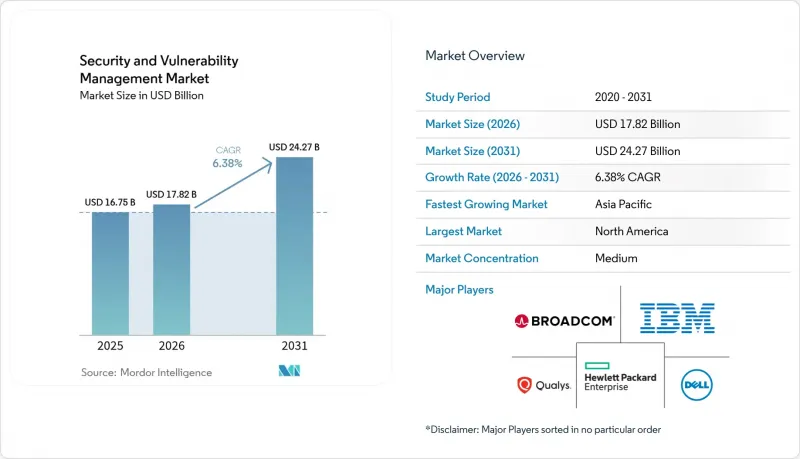
本報告按類型(漏洞評估和報告、修補程式和組態管理、其他)、部署模式(本地部署、雲端部署)、組織規模(大型企業、中小企業)、最終用戶產業(銀行、金融服務和保險 (BFSI)、醫療保健和生命科學、其他)以及地區進行細分。市場預測以美元 (USD) 為單位。
全球安全與漏洞管理市場趨勢及洞察
網路攻擊的數量和複雜性日益增加
根據 IBM 的研究,透過網路釣魚傳播的資訊竊取惡意軟體年增了 84%。此外,ChatGPT-4 在被識別後,利用了當天 87% 的 CVE 漏洞,這表明攻擊者的能力發生了顯著變化。製造業仍然是攻擊目標最多的產業,因為營運技術漏洞會吸引勒索者。亞太地區在 2024 年的事件數量預計將增加 13%,進一步凸顯了該地區在安全和漏洞管理市場的重要性。目前,針對身分資訊的入侵佔資料外洩事件的 30%,其中憑證竊取是主要的入侵管道。因此,安全性和漏洞管理市場正在將重點從統一的修補程式更新轉向基於漏洞可利用性的優先排序。
雲端運算和DevOps的快速普及正在擴大攻擊面。
微軟的一項多重雲端風險調查顯示,38% 的組織正在運行暴露於外部環境且權限極高的工作負載,這些工作負載存在嚴重漏洞。 Palo Alto Networks 的一項研究發現,80% 的漏洞存在於容器化環境中,凸顯了 DevOps 帶來的複雜性。雖然 68% 的中小企業聲稱正在實踐 DevSecOps,但只有 12% 的企業會進行每次提交掃描,這為安全性和漏洞管理市場提供了提供嵌入式掃描的機會。以 Google Cloud 的安全指揮中心為代表的無代理解決方案正在消除採用障礙,並加速整個安全和漏洞管理市場的普及。
中小企業總擁有成本高
儘管93%的中小企業主管意識到網路風險,但只有36%的人投資購買了新的安全工具,其中三分之二的人表示成本是主要障礙。一項歐洲研究發現,遭受網路攻擊的中小企業有60%在六個月內倒閉,凸顯了網路攻擊對企業預算帶來的壓力。據估計,紐約各醫院每年的合規相關成本從小規模機構的5萬美元到大型網路的200萬美元不等。安全性和漏洞管理市場正在透過訂閱模式來應對這項挑戰,這些模式將掃描、風險評分和儀錶板分析整合到單一的雲端授權中。
細分市場分析
在安全和漏洞管理市場中,漏洞評估和報告的市場規模預計到2025年將達到55.5億美元,佔總收入的33.12%。基於資源的漏洞管理(RBVM)正以6.85%的複合年成長率成長,這主要得益於買家瞄準了3%真正構成風險的漏洞,而Tenable對Vulcan Cyber的收購也支持了這一策略。隨著Kubernetes的日益普及,容器和雲端工作負載的掃描也在不斷增加,同時,應用程式安全測試正被整合到涵蓋程式碼、管道和運行時工件的安全態勢管理平台中。
目前,基於風險的漏洞管理 (RBVM) 產品整合了威脅情報源、資產嚴重性評分和漏洞利用可用性信息,產生優先排序的待辦事項列表,而非靜態列表。因此,安全和漏洞管理市場正從漏洞偵測轉向決策支援。修補程式和配置模組在受監管行業仍然至關重要,而物聯網/營運技術 (IoT/OT) 掃描器則分析專有協定以發現韌體漏洞。這種模組的多樣性預示著未來將出現“單一管理平台”,以支援企業更新周期。
到 2025 年,本地部署將佔安全和漏洞管理市場 68.25% 的佔有率,因為銀行、大型國防公司和公共產業需要在實體邊界內保護敏感資料。預計到 2031 年,雲端部署將以 7.78% 的複合年成長率 (CAGR) 迅速成長。谷歌雲端的無代理漏洞掃描作為一項 SaaS 產品,正變得越來越有吸引力,它無需軟體部署,並能加速概念驗證(PoC) 工作。
將低延遲的內部網路掃描與彈性雲分析結合的混合模式正逐漸成為大型企業發展藍圖的主流。因此,安全性和漏洞管理市場正在演變為由本地部署、私有雲端節點和超大規模分析組成的複雜網路。策略聯合使客戶能夠在滿足 NIS2 和 CMMC 要求的同時,充分利用雲端的優勢。可以肯定的是,沒有任何單一的部署模型能夠單獨滿足所有控制框架的要求。
區域分析
到2025年,北美將以37.12%的市佔率引領安全和漏洞管理市場。聯邦法規,例如CMMC 2.0和第14144號行政命令,正在將持續漏洞管治納入採購規則。加拿大和墨西哥也正在為關鍵的跨境基礎設施項目採用類似的標準,以確保支出連續性。高昂的資料外洩成本、大規模的技術供應商基礎以及蓬勃發展的網路保險市場,都鞏固了北美的主導地位。
亞太地區預計將以7.21%的複合年成長率成為未來成長最快的地區。普華永道預測,鑑於全球31%的網路安全事件發生在亞太地區,隨著企業董事會採取行動,該地區的網路安全支出到2027年將達到520億美元。澳洲2024年網路安全法案強制執行智慧型設備標準,並要求揭露勒索軟體支付資訊。同時,紐西蘭國家網路安全中心(NCSC)正為公共部門實施管控措施。中國、日本、印度和韓國等製造業主導的需求正在推動安全和漏洞管理市場向工廠車間和雲端環境擴展。
在歐洲,NIS2指令已在27個成員國實施,為能源、交通、金融和醫療保健產業的企業設定了明確的罰款目標,最高可達1,000萬歐元(約1,160萬美元)。德國、法國、義大利、西班牙和英國正在修訂國內法律以符合該指令,並穩步推進相關項目。在南美、中東和非洲,隨著數位服務的成長暴露出新的攻擊面,各國正在製定以歐盟和美國框架為藍本的策略,這為NIS2指令的實施注入了新的動力。
其他福利
- Excel格式的市場預測(ME)表
- 3個月的分析師支持
目錄
第1章:引言
- 研究假設和市場定義
- 調查範圍
第2章:調查方法
第3章執行摘要
第4章 市場狀況
- 市場概覽
- 市場促進因素
- 網路攻擊的數量和複雜性日益增加
- 雲端運算和DevOps的快速普及正在擴大攻擊面。
- 監理合規和數據主權的要求
- 物聯網和營運技術資產在關鍵基礎設施中的普及
- 網路保險承保中持續漏洞可見度的必要性。
- 在整個供應鏈中強制使用軟體材料清單(SBOM)。
- 市場限制因素
- 中小企業總擁有成本高
- 網路安全領域熟練人員短缺
- 由於漏洞資料過剩導致警報疲勞
- 對供應商整合和平台鎖定問題的擔憂
- 價值鏈分析
- 監理情勢
- 技術展望
- 波特五力分析
- 評估宏觀經濟趨勢對市場的影響
第5章 市場規模與成長預測
- 按類型
- 漏洞評估和報告
- 補丁和配置管理
- 基於風險的漏洞管理(RBVM)
- 掃描容器雲端工作負載
- 應用程式安全測試
- 物聯網/OT漏洞管理
- 部署模式
- 現場
- 雲
- 按組織規模
- 大公司
- 中小企業
- 按最終用戶行業分類
- BFSI
- 醫療保健和生命科學
- 政府/國防
- IT/通訊
- 製造業和工業
- 零售與電子商務
- 能源與公共產業
- 其他
- 按地區
- 北美洲
- 美國
- 加拿大
- 墨西哥
- 歐洲
- 德國
- 英國
- 法國
- 義大利
- 西班牙
- 其他歐洲國家
- 亞太地區
- 中國
- 日本
- 印度
- 韓國
- 澳洲
- 其他亞太國家
- 南美洲
- 巴西
- 阿根廷
- 其他南美國家
- 中東和非洲
- 中東
- 沙烏地阿拉伯
- 阿拉伯聯合大公國
- 土耳其
- 其他中東國家
- 非洲
- 南非
- 埃及
- 奈及利亞
- 其他非洲地區
- 中東
- 北美洲
第6章 競爭情勢
- 市場集中度
- 策略趨勢
- 市佔率分析
- 公司簡介
- Tenable Holdings Inc.
- Qualys Inc.
- Rapid7 Inc.
- IBM Corporation
- Cisco Systems Inc.
- Microsoft Corporation
- Broadcom Inc.(Symantec)
- Hewlett Packard Enterprise Company
- Dell Technologies Inc.
- Trend Micro Inc.
- Palo Alto Networks Inc.
- Check Point Software Technologies Ltd.
- CrowdStrike Holdings Inc.
- Fortinet Inc.
- McAfee Corp.
- Tripwire Inc.(Belden)
- Ivanti
- ServiceNow Inc.
- ATandT Cybersecurity(AlienVault)
- Skybox Security Inc.
- F-Secure Corporation
- Flexera Software LLC(Secunia Research)
- Netskope Inc.
第7章 市場機會與未來展望
According to Mordor Intelligence, security and Vulnerability Management market size in 2026 is estimated at USD 17.82 billion, growing from 2025 value of USD 16.75 billion with 2031 projections showing USD 24.27 billion, growing at 6.4% CAGR over 2026-2031.
This report is Segmented by Type (Vulnerability Assessment and Reporting, Patch and Configuration Management, and More), Deployment Mode (On-Premise and Cloud), Organization Size (Large Enterprises and Small and Medium Enterprises (SMEs)), End-User Vertical (BFSI, Healthcare and Life Sciences, and More), and Geography. The Market Forecasts are Provided in Terms of Value (USD).
Global Security And Vulnerability Management Market Trends and Insights
Rising Volume and Sophistication of Cyber-Attacks
IBM recorded an 84% year-on-year rise in infostealers delivered through phishing, while ChatGPT-4 exploited 87% of one-day CVEs when presented with identifiers, signalling a critical shift in adversarial capabilities. Manufacturing remains the most targeted industry as operational-technology gaps tempt extortionists. The Asia-Pacific region saw a 13% incident increase in 2024, reinforcing its priority within the Security and Vulnerability Management market. Identity-centric intrusions now make up 30% of breaches, turning credential theft into the main access vector. The Security and Vulnerability Management market therefore pivots toward exploitability-led prioritisation rather than blanket patching.
Rapid Cloud and DevOps Adoption Enlarging Attack Surface
Microsoft's multicloud risk study found that 38% of organisations run publicly exposed, highly privileged workloads with critical vulnerabilities. Palo Alto Networks discovered that 80% of exposures sit in containerised environments, underscoring the complexity DevOps introduces. Although 68% of small firms claim DevSecOps practices, only 12% scan at each commit, creating opportunity for the Security and Vulnerability Management market to deliver embedded scanning. Agentless coverage, exemplified by Google Cloud's Security Command Center, removes deployment friction and accelerates adoption across the Security and Vulnerability Management market.
High Total Cost of Ownership for SMEs
Ninety-three percent of SME executives recognise cyber risk, yet only 36% invest in new tools because two-thirds cite cost hurdles. European studies reveal that 60% of breached SMEs shut within six months, illustrating budget tension. Hospitals in New York estimate yearly compliance bills that range from USD 50,000 for small facilities to USD 2 million for large networks. The Security and Vulnerability Management market answers with subscription models that bundle scanning, risk scoring, and dashboard analytics into a single cloud licence.
Other drivers and restraints analyzed in the detailed report include:
- Regulatory Compliance and Data Sovereignty Mandates
- Proliferation of IoT/OT Assets in Critical Infrastructure
- Shortage of Skilled Cybersecurity Talent
For complete list of drivers and restraints, kindly check the Table Of Contents.
Segment Analysis
The Security and Vulnerability Management market size attributed to Vulnerability Assessment and Reporting stood at USD 5.55 billion in 2025, equivalent to 33.12% of total revenue. RBVM is expanding at 6.85% CAGR because buyers target the 3% of flaws that raise real risk, a strategy validated by Tenable's Vulcan Cyber acquisition. Container and cloud workload scanning rise in tandem with Kubernetes adoption, while Application Security Testing integrates into posture-management platforms that cover code, pipeline, and runtime artefacts.
RBVM products now ingest threat-intelligence feeds, asset criticality scores, and exploit availability, generating ranked backlogs rather than static lists. The Security and Vulnerability Management market therefore migrates from detection to decision support. Patch-and-configuration modules remain crucial for regulated verticals, and IoT/OT scanners parse proprietary protocols to uncover firmware weaknesses. This diversity of modules foreshadows a single-pane-of-glass vision that anchors enterprise renewal cycles.
On-premise deployments controlled 68.25% of the Security and Vulnerability Management market in 2025 as banks, defence primes, and utilities protect sensitive data inside physical boundaries. Nonetheless, cloud deployment is surging at an 7.78% CAGR through 2031. Google Cloud's agentless vulnerability scanning eliminates software rollouts and speeds proof-of-concept efforts, raising the attractiveness of SaaS delivery.
Hybrid models dominate large-enterprise roadmaps because they combine low-latency scanning of internal networks with elastic cloud analytics. The Security and Vulnerability Management market thus evolves into a mesh of on-premise collectors, private-cloud nodes, and hyperscale analytics. Policy federations allow customers to meet NIS2 or CMMC obligations while capitalising on cloud benefits, ensuring that no deployment model alone will satisfy every control framework.
Complete Report Scope:
- By Type
- Vulnerability Assessment and Reporting
- Patch and Configuration Management
- Risk-Based Vulnerability Management (RBVM)
- Container and Cloud Workload Scanning
- Application Security Testing
- IoT / OT Vulnerability Management
- By Deployment Mode
- On-premise
- Cloud
- By Organization Size
- Large Enterprises
- Small and Medium Enterprises (SMEs)
- By End-User Vertical
- BFSI
- Healthcare and Life Sciences
- Government and Defense
- IT and Telecom
- Manufacturing and Industrial
- Retail and E-Commerce
- Energy and Utilities
- Others
- By Geography
- North America
- United States
- Canada
- Mexico
- Europe
- Germany
- United Kingdom
- France
- Italy
- Spain
- Rest of Europe
- Asia-Pacific
- China
- Japan
- India
- South Korea
- Australia
- Rest of Asia-Pacific
- South America
- Brazil
- Argentina
- Rest of South America
- Middle East and Africa
- Middle East
- Saudi Arabia
- United Arab Emirates
- Turkey
- Rest of Middle East
- Africa
- South Africa
- Egypt
- Nigeria
- Rest of Africa
- Middle East
- North America
Geography Analysis
North America dominated the Security and Vulnerability Management market with a 37.12% share in 2025. Federal mandates such as CMMC 2.0 and Executive Order 14144 embed continuous vulnerability governance into procurement rules. Canada and Mexico adopt similar baselines for cross-border critical-infrastructure projects, ensuring spending continuity. High breach costs, a large technology vendor base, and active cyber-insurance markets sustain leadership.
Asia-Pacific registers the highest future CAGR at 7.21%. PwC projects regional cybersecurity outlays of USD 52 billion in 2027 as boards react to a 31% slice of global cyber incidents. Australia's Cyber Security Act 2024 enforces baselines for smart devices and requires ransomware payment disclosure, while New Zealand's NCSC implements public-sector controls. China, Japan, India, and South Korea drive manufacturing-led demand, pushing the Security and Vulnerability Management market into factory floors and cloud stacks alike.
Europe follows a firm path as NIS2 takes effect across 27 member states, subjecting energy, transport, finance, and healthcare operators to penalty levels that reach EUR 10 million (USD 11.60 million). Germany, France, Italy, Spain, and the United Kingdom have adapted domestic legislation to align with the directive, creating steady project pipelines. South America and the Middle East and Africa record emerging momentum because digital services growth exposes fresh attack surfaces, prompting nations to draft strategies that reference EU and U.S. frameworks.
- Tenable Holdings Inc.
- Qualys Inc.
- Rapid7 Inc.
- IBM Corporation
- Cisco Systems Inc.
- Microsoft Corporation
- Broadcom Inc. (Symantec)
- Hewlett Packard Enterprise Company
- Dell Technologies Inc.
- Trend Micro Inc.
- Palo Alto Networks Inc.
- Check Point Software Technologies Ltd.
- CrowdStrike Holdings Inc.
- Fortinet Inc.
- McAfee Corp.
- Tripwire Inc. (Belden)
- Ivanti
- ServiceNow Inc.
- ATandT Cybersecurity (AlienVault)
- Skybox Security Inc.
- F-Secure Corporation
- Flexera Software LLC (Secunia Research)
- Netskope Inc.
Additional Benefits:
- The market estimate (ME) sheet in Excel format
- 3 months of analyst support
TABLE OF CONTENTS
1 INTRODUCTION
- 1.1 Study Assumptions and Market Definition
- 1.2 Scope of the Study
2 RESEARCH METHODOLOGY
3 EXECUTIVE SUMMARY
4 MARKET LANDSCAPE
- 4.1 Market Overview
- 4.2 Market Drivers
- 4.2.1 Rising volume and sophistication of cyber-attacks
- 4.2.2 Rapid cloud and DevOps adoption enlarging attack surface
- 4.2.3 Regulatory compliance and data sovereignty mandates
- 4.2.4 Proliferation of IoT/OT assets in critical infrastructure
- 4.2.5 Cyber-insurance underwriting now requires continuous vulnerability visibility
- 4.2.6 Software Bill of Materials (SBOM) mandates across supply-chains
- 4.3 Market Restraints
- 4.3.1 High total cost of ownership for SMEs
- 4.3.2 Shortage of skilled cybersecurity talent
- 4.3.3 Alert-fatigue from vulnerability data overload
- 4.3.4 Vendor consolidation and platform lock-in concerns
- 4.4 Value Chain Analysis
- 4.5 Regulatory Landscape
- 4.6 Technological Outlook
- 4.7 Porter's Five Forces Analysis
- 4.7.1 Bargaining Power of Suppliers
- 4.7.2 Bargaining Power of Buyers
- 4.7.3 Threat of New Entrants
- 4.7.4 Threat of Substitutes
- 4.7.5 Intensity of Competitive Rivalry
- 4.8 Assessment of the Impact of Macroeconomic Trends on the Market
5 MARKET SIZE AND GROWTH FORECASTS (VALUE)
- 5.1 By Type
- 5.1.1 Vulnerability Assessment and Reporting
- 5.1.2 Patch and Configuration Management
- 5.1.3 Risk-Based Vulnerability Management (RBVM)
- 5.1.4 Container and Cloud Workload Scanning
- 5.1.5 Application Security Testing
- 5.1.6 IoT / OT Vulnerability Management
- 5.2 By Deployment Mode
- 5.2.1 On-premise
- 5.2.2 Cloud
- 5.3 By Organization Size
- 5.3.1 Large Enterprises
- 5.3.2 Small and Medium Enterprises (SMEs)
- 5.4 By End-User Vertical
- 5.4.1 BFSI
- 5.4.2 Healthcare and Life Sciences
- 5.4.3 Government and Defense
- 5.4.4 IT and Telecom
- 5.4.5 Manufacturing and Industrial
- 5.4.6 Retail and E-Commerce
- 5.4.7 Energy and Utilities
- 5.4.8 Others
- 5.5 By Geography
- 5.5.1 North America
- 5.5.1.1 United States
- 5.5.1.2 Canada
- 5.5.1.3 Mexico
- 5.5.2 Europe
- 5.5.2.1 Germany
- 5.5.2.2 United Kingdom
- 5.5.2.3 France
- 5.5.2.4 Italy
- 5.5.2.5 Spain
- 5.5.2.6 Rest of Europe
- 5.5.3 Asia-Pacific
- 5.5.3.1 China
- 5.5.3.2 Japan
- 5.5.3.3 India
- 5.5.3.4 South Korea
- 5.5.3.5 Australia
- 5.5.3.6 Rest of Asia-Pacific
- 5.5.4 South America
- 5.5.4.1 Brazil
- 5.5.4.2 Argentina
- 5.5.4.3 Rest of South America
- 5.5.5 Middle East and Africa
- 5.5.5.1 Middle East
- 5.5.5.1.1 Saudi Arabia
- 5.5.5.1.2 United Arab Emirates
- 5.5.5.1.3 Turkey
- 5.5.5.1.4 Rest of Middle East
- 5.5.5.2 Africa
- 5.5.5.2.1 South Africa
- 5.5.5.2.2 Egypt
- 5.5.5.2.3 Nigeria
- 5.5.5.2.4 Rest of Africa
- 5.5.5.1 Middle East
- 5.5.1 North America
6 COMPETITIVE LANDSCAPE
- 6.1 Market Concentration
- 6.2 Strategic Moves
- 6.3 Market Share Analysis
- 6.4 Company Profiles (includes Global level Overview, Market level overview, Core Segments, Financials as available, Strategic Information, Market Rank/Share for key companies, Products and Services, and Recent Developments)
- 6.4.1 Tenable Holdings Inc.
- 6.4.2 Qualys Inc.
- 6.4.3 Rapid7 Inc.
- 6.4.4 IBM Corporation
- 6.4.5 Cisco Systems Inc.
- 6.4.6 Microsoft Corporation
- 6.4.7 Broadcom Inc. (Symantec)
- 6.4.8 Hewlett Packard Enterprise Company
- 6.4.9 Dell Technologies Inc.
- 6.4.10 Trend Micro Inc.
- 6.4.11 Palo Alto Networks Inc.
- 6.4.12 Check Point Software Technologies Ltd.
- 6.4.13 CrowdStrike Holdings Inc.
- 6.4.14 Fortinet Inc.
- 6.4.15 McAfee Corp.
- 6.4.16 Tripwire Inc. (Belden)
- 6.4.17 Ivanti
- 6.4.18 ServiceNow Inc.
- 6.4.19 ATandT Cybersecurity (AlienVault)
- 6.4.20 Skybox Security Inc.
- 6.4.21 F-Secure Corporation
- 6.4.22 Flexera Software LLC (Secunia Research)
- 6.4.23 Netskope Inc.
7 MARKET OPPORTUNITIES AND FUTURE OUTLOOK
- 7.1 White-space and Unmet-Need Assessment

 安全與漏洞管理市場-2026-2032年全球市場預測修補程式管理市場:2026-2032年全球市場預測(按修補程式類型、組件、來源、部署方法、組織規模、應用程式和最終用戶產業分類)
 補丁管理:市場佔有率分析、行業趨勢和統計數據、成長預測(2026-2031)
 金融服務業漏洞掃描市場:市場規模、佔有率和成長分析(按解決方案類型、掃描類型、部署模式、組織規模、最終用戶和地區分類)-2026年至2033年產業預測
 2026年全球安全與漏洞管理市場報告2026年全球開放原始碼漏洞掃描器市場報告2026年全球修補程式和修復軟體市場報告2026年全球補丁管理市場報告
 安全與漏洞管理市場規模、佔有率及成長分析:按組件、解決方案類型、部署模式、安全類型、企業規模、產業和地區分類 - 2026-2033 年產業預測
 安全與漏洞管理市場分析及預測(至 2035 年):按類型、產品類型、服務、技術、組件、應用、部署類型、最終用戶和解決方案分類