


 |
市場調查報告書
商品編碼
2064381
補丁管理:市場佔有率分析、行業趨勢和統計數據、成長預測(2026-2031)Patch Management - Market Share Analysis, Industry Trends & Statistics, Growth Forecasts (2026 - 2031) |
||||||
※ 本網頁內容可能與最新版本有所差異。詳細情況請與我們聯繫。
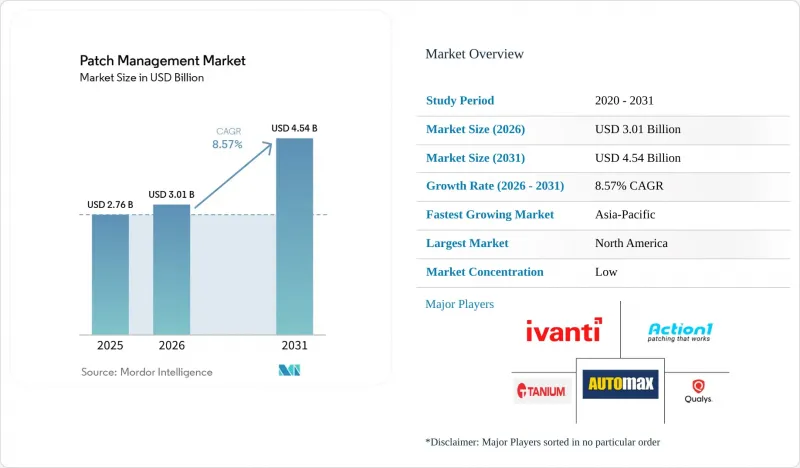
根據 Mordor Intelligence 預測,修補程式管理市場規模將從 2025 年的 27.6 億美元和 2026 年的 30.1 億美元成長到 2031 年的 45.4 億美元,2026 年至 2031 年的年複合成長率(CAGR)為 8.57%。
本報告按組件(軟體和服務)、部署類型(雲端和本地部署)、組織規模(大型企業和中小企業)、產業(銀行、金融服務和保險 (BFSI)、IT 和電信、醫療保健和生命科學、政府和國防、零售和電子商務、能源和公共產業等)以及地區進行細分。市場預測以價值(美元)表示。
全球修補程式管理市場趨勢及洞察
利用已知漏洞的行為正在加劇。
修補程式管理市場短期需求的最強促進因素是活躍利用漏洞數量的持續成長。美國網路安全與基礎設施安全局 (CISA) 的已知利用漏洞 (KEV) 目錄預計到 2026 年 5 月將達到 1,592 個條目,這向安全團隊發出一個明確的訊號:大量且不斷成長的漏洞已與現實世界的攻擊相關聯。這種環境正在改變修補程式預算的優先排序方式,因為當需要對有限範圍的已知利用漏洞做出快速回應時,組織不能再依賴基於嚴重性的廣泛優先排序。這種情況也推動修補程式管理市場轉向能夠快速捕獲 KEV 情報並將其直接映射到受影響資產和修補程式工作流程的工具。因此,能夠縮短從外部威脅情報到內部修復時間的供應商在企業採購週期中建立更清晰的價值提案。
加強網路韌性和合規性要求
合規性如今已成為修補程式管理市場的主要支出促進因素,尤其是在漏洞回應與法律責任和正式監管掛鉤的情況下。歐盟委員會指出,NIS2 強制要求受監管組織進行漏洞管理,違規者將面臨最高 1,000 萬歐元(1,080 萬美元)或全球年收入 2% 的罰款。這推動了對能夠以內部審計和監管機構可驗證的格式記錄優先邏輯、糾正措施時間、核准流程和回滾程序的平台的需求。根據 ENISA 的一份報告,70% 的歐盟組織將監管合規性列為 2024 年網路安全投資的主要促進因素,50% 的組織認為修補程式管理是應對 NIS2 要求時面臨的最大挑戰。隨著這些法規的日趨完善,修補程式管理市場可能會更青睞那些兼具自動化和詳細報告功能的供應商,而不是那些僅專注於部署機制的供應商。
補丁相容性和業務中斷風險
與修補程式相關的服務中斷仍然是修補程式管理市場的主要阻力,因為許多組織在安排部署視窗時仍然需要權衡系統停機風險和濫用風險。在停機會直接影響營運和安全的環境中,例如醫療保健、製造業和金融基礎設施,這個問題尤其突出。在這些環境中,自動化部署通常受到限制,因為在投入生產之前需要進行檢驗、測試和回溯計畫。因此,即使修補程式知識有所提高,如果團隊缺乏對更新不會中斷核心工作流程的信心,執行速度仍然可能很慢。這種限制推動了對能夠改善部署前測試、分階段推廣設計和變更管理可見性的平台的持續需求。
細分市場分析
在2025年的修補程式管理市場中,軟體將佔62.13%,成為最大的組成部分。收入將繼續集中在作業系統修補程式、第三方應用程式更新以及幫助企業管理龐大且多樣化設備群的跨平台自動化層。 2025年和2026年的產品投資正轉向更廣泛的平台支援。這是因為到2025年,企業用戶將佔補丁管理市場62.13%的佔有率,成為最大的組成部分。企業用戶需要更少的工具和更統一的修復工作流程。 2025年11月,Action1擴展了其Linux支援範圍,新增了Ubuntu、Debian、Red Hat Enterprise Linux和SUSE。這反映了支援異質環境而非單一作業系統修補程式的趨勢。
合規性要求也提升了軟體在修補程式管理行業的重要性,因為企業需要記錄來證明其託管應用程式已按時打補丁,並在整個環境中進行追蹤。 2025年12月,Adaptiva宣布其平台目錄涵蓋超過20,000種產品的250,000多個補丁。這凸顯了對更深入的第三方應用程式覆蓋範圍以及更強大的、可隨時用於審計的系統的需求。服務領域是成長最快的領域,預計到2031年,該領域的修補程式管理市場規模將以8.97%的複合年成長率成長。託管服務在這一需求成長中佔據了很大一部分,因為大大小小的企業擴大尋求將策略執行、異常處理和報告外包給外部團隊。歐盟網路安全與資訊安全局(ENISA)的一項調查顯示,76%的歐盟組織在網路安全人才方面面臨挑戰,這支持了向服務主導交付模式的結構性轉變。
基於雲端的部署模式也是成長最快的部署模式,預計到 2025 年將佔據修補程式管理市場 55.89% 的佔有率,並在 2031 年前以 8.92% 的複合年成長率持續成長。這種主導地位反映了雲端部署模式在遠端和混合式環境中的顯著優勢,在這些環境中,基於雲端的代理程式無需依賴本地中繼基礎設施或 VPN 連線即可強制執行修補程式策略。該模式還支援更快的集中式策略更新和更廣泛的分散式設備應用,這兩點都是修補程式管理市場的核心需求。 Adaptiva 報告稱,到 2025 年,其新客戶獲取量將成長 70%,聯合銷售交易量將成長 75%,這表明客戶對雲端原生修補程式和終端架構的持續興趣。
在工業環境中,由於空氣間隙環境、敏感網路以及資料儲存位置和網路隔離等因素限制了雲端採用,因此本地部署仍然至關重要。 Ivanti 於 2026 年 4 月發布了 ISA6500 和 ISA8500 主權設備,這表明供應商仍然認可市場對本地化外形規格以及雲端管理策略編配和區域資料管理的需求。這意味著本地部署市場正在萎縮而非消失,而修補程式管理市場正在服務一小部分但需求穩定的專業客戶,他們無法完全遷移到共用雲端環境。整體發展方向仍然明確,因為雲端平台更適合分散式終端、薄型化的IT 團隊以及加快修復週期。
區域分析
到2025年,北美將佔據修補程式管理市場41.84%的佔有率,成為最大的區域貢獻者。美國佔據了該地區的大部分需求,因為其龐大的企業預算、成熟的託管服務生態系統以及嚴格的內部管治都支持企業增加補丁方面的支出。 CISA持續擴展KEV目錄,並在漏洞響應協調方面發揮積極作用,為該地區的組織提供可操作的情報信息,從而實現更清晰的優先級排序和更快的執行。加拿大和墨西哥透過跨國企業網路和擴大MSP(託管服務供應商)在中型企業客戶中的覆蓋範圍來推動需求。該地區還擁有強大的供應商基礎,這加劇了補丁管理市場的競爭,並推動了產品功能的改進。
亞太地區是成長最快的地區,預計到2031年,補丁管理市場將以9.57%的複合年成長率成長。這項成長主要得益於終端資產規模的擴大、網路安全框架的強化以及企業IT持續向雲端交付營運模式的轉型。趨勢科技在2025年3月發布的報告顯示,日本的平均補丁應用時間為36.4天,比全球平均慢1.2倍。這顯示該關鍵區域市場的自動化程度有明顯差距。 Action1已承諾自2026年4月1日起遵守印度的資料居住要求,這表明供應商現在已將區域合規性視為其在該地區業務擴大策略的一部分。在澳洲和其他亞太市場,修補程式管治在國家網路安全計畫中的地位日益提升,這正在推動其長期應用。
到2025年,歐洲將佔據第二大市場佔有率,其中英國、德國和法國將推動企業和中型企業用戶的需求。根據歐盟網路安全局(ENISA)的報告,70%的歐盟組織表示,2024年網路安全投資的主要促進因素是合規性,而新納入NIS2範圍的組織網路安全預算平均增加了22%。這確保了修補程式管理市場與採購週期緊密相關,而採購週期又受到正式合規計畫、文件化的控制設定和監管審查的影響。南美、中東和非洲仍處於早期階段,隨著中小企業雲端採用率的提高和MSP(託管服務提供者)採用率的上升,巴西和阿拉伯聯合大公國的需求正在成長。
其他好處:
- Excel格式的市場預測(ME)表
- 3個月的分析師支持
目錄
第1章:引言
- 研究假設和市場定義
- 調查範圍
第2章:調查方法
第3章執行摘要
第4章 市場狀況
- 市場概覽
- 市場促進因素
- 利用已知漏洞的攻擊愈演愈烈
- 加強網路韌性和合規性要求
- 混合辦公室和分散式終端的擴展
- 向雲端原生和自動化補丁過渡
- 國家漏洞資料庫 (NVD) 中缺乏全面數據,因此有必要採用基於風險的修補情報。
- 第三方應用程式的激增以及與瀏覽器相關的風險
- 市場限制因素
- 補丁相容性和業務中斷風險
- 舊有系統和分散的終端環境
- 關於中等嚴重性漏洞的漏洞上下文資訊不完整
- 虛擬修補和替代解決方案可以推遲全面糾正措施的支出。
- 宏觀經濟因素對市場的影響
- 產業價值鏈分析
- 監理情勢
- 技術展望
- 波特五力分析
第5章 市場規模與成長預測
- 按組件
- 軟體
- 作業系統修補程式管理
- 第三方應用程式的補丁管理
- 跨平台補丁自動化與分析
- 服務
- 專業服務
- 託管服務
- 軟體
- 部署模式
- 基於雲端的
- 現場
- 按組織規模
- 大公司
- 小型企業
- 按行業分類
- BFSI
- 資訊科技/通訊
- 醫療保健和生命科學
- 政府/國防
- 零售與電子商務
- 製造業
- 能源公用事業
- 教育
- 其他工業部門
- 按地區
- 北美洲
- 美國
- 加拿大
- 墨西哥
- 南美洲
- 巴西
- 阿根廷
- 其他南美國家
- 歐洲
- 英國
- 德國
- 法國
- 義大利
- 西班牙
- 其他歐洲國家
- 亞太地區
- 中國
- 日本
- 印度
- 韓國
- 其他亞太國家
- 中東和非洲
- 中東
- 阿拉伯聯合大公國
- 沙烏地阿拉伯
- 其他中東國家
- 非洲
- 南非
- 埃及
- 其他非洲國家
- 中東
- 北美洲
第6章 競爭情勢
- 市場集中度
- 策略趨勢
- 市佔率分析
- 公司簡介
- Action1 Corporation
- Addigy, Inc.
- Acronis International GmbH
- Adaptive Protocols, Inc.
- Atera Networks Ltd.
- Automox Inc.
- baramundi software GmbH
- ConnectWise, LLC
- GFI USA, LLC
- Heimdal Security A/S
- Ivanti, Inc.
- NinjaOne
- Kaseya Inc.
- N-able Technologies Ltd.
- PDQ.com Corporation
- Qualys, Inc.
- SecPod Technologies Private Limited
- Tanium Inc.
- Vicarius Ltd.
第7章 市場機會與未來展望
According to Mordor Intelligence, the patch management market size is projected to expand from USD 2.76 billion in 2025 and USD 3.01 billion in 2026 to USD 4.54 billion by 2031, registering a CAGR of 8.57% between 2026 and 2031.
This report is Segmented by Component (Software, and Services), Deployment Mode (Cloud-Based, and On-Premises), Organization Size (Large Enterprises, and Small and Medium Enterprises), Industry Vertical (BFSI, IT and Telecom, Healthcare and Life Sciences, Government and Defense, Retail and E-Commerce, Energy and Utilities, and More), and Geography. The Market Forecasts are Provided in Terms of Value (USD).
Global Patch Management Market Trends and Insights
Escalating Exploitation of Known Vulnerabilities
The strongest near-term force behind patch management market demand is the continued rise in actively exploited vulnerabilities. CISA's Known Exploited Vulnerabilities catalog had reached 1,592 entries by May 2026, providing security teams with a clear signal that a large and growing set of flaws is already tied to real-world attacks. That environment changes how patching budgets are prioritized, because organizations cannot rely on broad severity queues when a narrower set of known-exploited issues requires immediate action. It also pushes the patch management market toward tools that can ingest KEV intelligence quickly and map it directly to affected assets and patch workflows. Vendors that can cut the time between external threat intelligence and internal remediation execution are therefore gaining a clearer value proposition in enterprise buying cycles.
Tightening Cyber Resilience and Compliance Mandates
Compliance is now a direct spending driver for the patch management market, especially where vulnerability handling is tied to legal accountability and formal supervisory review. The European Commission states that NIS2 requires covered entities to address vulnerability management, and penalties can reach EUR 10 million (USD 10.8 million) or 2% of global annual turnover for non-compliance. This is raising demand for platforms that can document prioritization logic, remediation timing, approvals, and rollback procedures in a form that internal audit and regulators can review. ENISA reported that 70% of EU organizations named regulatory compliance as their main cybersecurity investment driver in 2024, and 50% identified patch management as the most difficult NIS2 requirement to address. As these rules mature, the patch management market is likely to favor vendors that combine automation with deep reporting rather than those that focus solely on deployment mechanics.
Patch Compatibility and Business Downtime Risk
Patch-related service disruptions remain a significant brake on the patch management market, as many organizations still weigh outage risk against exploit risk when scheduling deployment windows. This issue is most pronounced in environments where downtime has direct operational or safety consequences, including healthcare, manufacturing, and financial infrastructure. In these settings, automated rollout is often limited by the need for validation, testing, and rollback planning before production deployment can proceed. The result is that even when patch intelligence improves, execution speed can still slow down if teams lack confidence that updates will not interrupt core workflows. This restraint keeps demand high for platforms that can improve pre-deployment testing, staged rollout design, and change control visibility.
Other drivers and restraints analyzed in the detailed report include:
- Growth in Hybrid Work and Distributed Endpoints
- Shift Toward Cloud-Native and Automated Patching
- Legacy Systems and Fragmented Endpoint Estates
For complete list of drivers and restraints, kindly check the Table Of Contents.
Segment Analysis
Software accounted for 62.13% of the patch management market in 2025, making it the largest component. Revenue still centers on operating system patching, third-party application updates, and cross-platform automation layers that help enterprises manage large and mixed device fleets. Product investment in 2025 and 2026 has been moving toward broader platform coverage, because buyers accounted for 62.13% of the patch management market in 2025, making it the largest components want fewer tools and a more unified remediation workflow. Action1 expanded to Linux in November 2025 across Ubuntu, Debian, Red Hat Enterprise Linux, and SUSE, which reflects the wider shift toward heterogeneous fleet coverage rather than single-OS patch execution.
Compliance needs are also strengthening the software case in the patch management industry, as organizations need records showing whether managed applications are patched on time and tracked across the estate. Adaptiva said in December 2025 that its platform catalog covered more than 250,000 patches across more than 20,000 products, which supports the demand for deeper third-party application coverage and stronger audit readiness. Services is the fastest-growing component, and the patch management market size for this segment is projected to grow at 8.97% CAGR through 2031. Managed services are capturing most of that incremental demand, as enterprises and SMEs increasingly want external teams to handle policy execution, exception handling, and reporting. ENISA's finding that 76% of EU organizations struggled to attract cybersecurity staff supports the structural shift toward service-led delivery.
Cloud-based deployment captured 55.89% of the patch management market in 2025 and is also the fastest-growing deployment mode, with an 8.92% CAGR through 2031. That lead reflects a clear advantage in remote and hybrid environments, where cloud-based agents can enforce patch policy without depending on on-premises relay infrastructure or VPN connectivity. The model also supports faster central policy updates and broader reach across distributed devices, both of which are core needs in the patch management market. Adaptiva reported 70% growth in new customer acquisition in 2025 and a 75% increase in co-sell wins, indicating sustained customer interest in cloud-native patch and endpoint architectures.
On-premises deployment still matters in air-gapped environments, classified networks, and industrial settings where data residency or network isolation limits cloud use. Ivanti introduced ISA6500 and ISA8500 sovereign appliances in April 2026, which shows that vendors still see demand for local form factors tied to cloud-managed policy orchestration and regional data controls. This means the on-premises segment is narrowing rather than disappearing, and the patch management market is serving a smaller but durable specialist tier of customers that cannot fully move to shared cloud delivery. The broader direction remains clear, as cloud platforms better fit distributed endpoints, leaner IT teams, and the push for faster remediation cycles.
Geography Analysis
North America accounted for 41.84% of the patch management market in 2025, making it the largest regional contributor. The United States accounts for most regional demand because large enterprise budgets, a mature managed services ecosystem, and strict internal governance all support higher patching spend. CISA's continued expansion of the KEV catalog and its active vulnerability coordination role give organizations in the region a practical intelligence feed that sharpens prioritization and speeds execution. Canada and Mexico add demand through cross-border enterprise networks and growing MSP coverage in mid-market accounts. The region also benefits from a dense vendor base, which keeps the patch management market highly competitive and pushes product capabilities upward.
Asia-Pacific is the fastest-growing region, with the patch management market advancing at a 9.57% CAGR through 2031. Larger endpoint estates, stronger cybersecurity frameworks, and a continuing move toward cloud-delivered operations across enterprise IT are supporting growth. Trend Micro reported in March 2025 that Japan had a mean time to patch of 36.4 days, which was 1.2 times slower than the global average, indicating a clear automation gap in a major regional market. Action1 committed to India data residency effective April 1, 2026, which shows that vendors now see local compliance alignment as part of their expansion strategy in the region. Australia and other Asia-Pacific markets are also giving patch governance a firmer place inside national cyber programs, which supports longer-term adoption.
Europe held the second-largest share in 2025, with the United Kingdom, Germany, and France leading demand across enterprise and mid-market users. ENISA reported that 70% of EU organizations identified regulatory compliance as their primary cybersecurity investment driver in 2024, and organizations newly entering the NIS2 scope saw an average 22% increase in cybersecurity budgets. This keeps the patch management market closely tied to formal compliance programs, documented control design, and procurement cycles shaped by regulatory review. South America, the Middle East, and Africa remain early-stage regions, where Brazil and the UAE lead demand as cloud adoption rises and MSP penetration improves across smaller organizations.
- Action1 Corporation
- Addigy, Inc.
- Acronis International GmbH
- Adaptive Protocols, Inc.
- Atera Networks Ltd.
- Automox Inc.
- baramundi software GmbH
- ConnectWise, LLC
- GFI USA, LLC
- Heimdal Security A/S
- Ivanti, Inc.
- NinjaOne
- Kaseya Inc.
- N-able Technologies Ltd.
- PDQ.com Corporation
- Qualys, Inc.
- SecPod Technologies Private Limited
- Tanium Inc.
- Vicarius Ltd.
Additional Benefits:
- The market estimate (ME) sheet in Excel format
- 3 months of analyst support
TABLE OF CONTENTS
1 INTRODUCTION
- 1.1 Study Assumptions and Market Definition
- 1.2 Scope of the Study
2 RESEARCH METHODOLOGY
3 EXECUTIVE SUMMARY
4 MARKET LANDSCAPE
- 4.1 Market Overview
- 4.2 Market Drivers
- 4.2.1 Escalating Exploitation of Known Vulnerabilities
- 4.2.2 Tightening Cyber Resilience and Compliance Mandates
- 4.2.3 Growth in Hybrid Work and Distributed Endpoints
- 4.2.4 Shift Toward Cloud-Native and Automated Patching
- 4.2.5 National Vulnerability Database Enrichment Gaps Are Forcing Risk-Based Patch Intelligence Adoption
- 4.2.6 Explosion of Third-Party Application Sprawl and Browser-Based Exposure
- 4.3 Market Restraints
- 4.3.1 Patch Compatibility and Business Downtime Risk
- 4.3.2 Legacy Systems and Fragmented Endpoint Estates
- 4.3.3 Incomplete Vulnerability Context for Mid-Severity Vulnerabilities
- 4.3.4 Virtual Patching and Compensating Controls Can Delay Full Remediation Spend
- 4.4 Impact of Macroeconomic Factors on the Market
- 4.5 Industry Value Chain Analysis
- 4.6 Regulatory Landscape
- 4.7 Technological Outlook
- 4.8 Porter's Five Forces Analysis
- 4.8.1 Bargaining Power of Suppliers
- 4.8.2 Bargaining Power of Buyers
- 4.8.3 Threat of New Entrants
- 4.8.4 Threat of Substitutes
- 4.8.5 Intensity of Competitive Rivalry
5 MARKET SIZE AND GROWTH FORECASTS (VALUE)
- 5.1 By Component
- 5.1.1 Software
- 5.1.1.1 Operating System Patch Management
- 5.1.1.2 Third-Party Application Patch Management
- 5.1.1.3 Cross-Platform Patch Automation and Analytics
- 5.1.2 Services
- 5.1.2.1 Professional Services
- 5.1.2.2 Managed Services
- 5.1.1 Software
- 5.2 By Deployment Mode
- 5.2.1 Cloud-Based
- 5.2.2 On-Premises
- 5.3 By Organization Size
- 5.3.1 Large Enterprises
- 5.3.2 Small and Medium Enterprises
- 5.4 By Industry Vertical
- 5.4.1 BFSI
- 5.4.2 IT and Telecom
- 5.4.3 Healthcare and Life Sciences
- 5.4.4 Government and Defense
- 5.4.5 Retail and E-commerce
- 5.4.6 Manufacturing
- 5.4.7 Energy and Utilities
- 5.4.8 Education
- 5.4.9 Other Industry Verticals
- 5.5 By Geography
- 5.5.1 North America
- 5.5.1.1 United States
- 5.5.1.2 Canada
- 5.5.1.3 Mexico
- 5.5.2 South America
- 5.5.2.1 Brazil
- 5.5.2.2 Argentina
- 5.5.2.3 Rest of South America
- 5.5.3 Europe
- 5.5.3.1 United Kingdom
- 5.5.3.2 Germany
- 5.5.3.3 France
- 5.5.3.4 Italy
- 5.5.3.5 Spain
- 5.5.3.6 Rest of Europe
- 5.5.4 Asia-Pacific
- 5.5.4.1 China
- 5.5.4.2 Japan
- 5.5.4.3 India
- 5.5.4.4 South Korea
- 5.5.4.5 Rest of Asia-Pacific
- 5.5.5 Middle East and Africa
- 5.5.5.1 Middle East
- 5.5.5.1.1 United Arab Emirates
- 5.5.5.1.2 Saudi Arabia
- 5.5.5.1.3 Rest of Middle East
- 5.5.5.2 Africa
- 5.5.5.2.1 South Africa
- 5.5.5.2.2 Egypt
- 5.5.5.2.3 Rest of Africa
- 5.5.5.1 Middle East
- 5.5.1 North America
6 COMPETITIVE LANDSCAPE
- 6.1 Market Concentration
- 6.2 Strategic Moves
- 6.3 Market Share Analysis
- 6.4 Company Profiles (includes Global Level Overview, Market Level Overview, Core Segments, Financials as available, Strategic Information, Market Rank/Share, Products and Services, Recent Developments)
- 6.4.1 Action1 Corporation
- 6.4.2 Addigy, Inc.
- 6.4.3 Acronis International GmbH
- 6.4.4 Adaptive Protocols, Inc.
- 6.4.5 Atera Networks Ltd.
- 6.4.6 Automox Inc.
- 6.4.7 baramundi software GmbH
- 6.4.8 ConnectWise, LLC
- 6.4.9 GFI USA, LLC
- 6.4.10 Heimdal Security A/S
- 6.4.11 Ivanti, Inc.
- 6.4.12 NinjaOne
- 6.4.13 Kaseya Inc.
- 6.4.14 N-able Technologies Ltd.
- 6.4.15 PDQ.com Corporation
- 6.4.16 Qualys, Inc.
- 6.4.17 SecPod Technologies Private Limited
- 6.4.18 Tanium Inc.
- 6.4.19 Vicarius Ltd.
7 MARKET OPPORTUNITIES AND FUTURE OUTLOOK
- 7.1 White-Space and Unmet-Need Assessment
 金融服務業漏洞掃描市場:市場規模、佔有率和成長分析(按解決方案類型、掃描類型、部署模式、組織規模、最終用戶和地區分類)-2026年至2033年產業預測
 修補程式管理市場:按組件、部署類型、組織規模和最終用戶產業分類的全球市場預測,2026-2032 年安全與漏洞管理市場:按組件、組織規模、部署模式、應用和產業分類-2026年至2032年全球市場預測
 2026年全球安全與漏洞管理市場報告2026年全球開放原始碼漏洞掃描器市場報告2026年全球修補程式和修復軟體市場報告2026年全球補丁管理市場報告
 安全與漏洞管理市場規模、佔有率及成長分析:按組件、解決方案類型、部署模式、安全類型、企業規模、產業和地區分類 - 2026-2033 年產業預測
 安全與漏洞管理市場分析及預測(至 2035 年):按類型、產品類型、服務、技術、組件、應用、部署類型、最終用戶和解決方案分類API漏洞掃描器市場按組件類型、部署類型、組織規模和行業分類 - 全球預測,2026-2032年