


 |
市場調查報告書
商品編碼
2120523
再生材料包裝解決方案:市場佔有率分析、產業趨勢與統計、成長預測(2026-2031)Recycled Materials Packaging Solutions - Market Share Analysis, Industry Trends & Statistics, Growth Forecasts (2026 - 2031) |
||||||

※ 本網頁內容可能與最新版本有所差異。詳細情況請與我們聯繫。
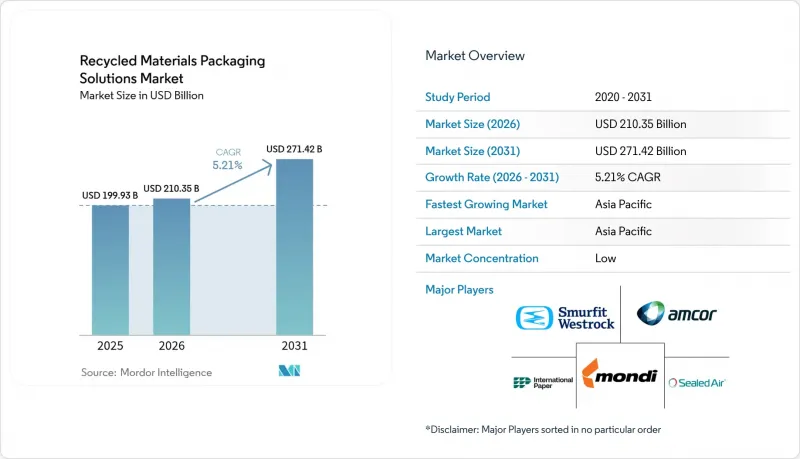
根據 Mordor Intelligence 估計,2026 年再生包裝解決方案市值將達到 2,103.5 億美元,高於 2025 年的 1,999.3 億美元,預計到 2031 年將達到 2,714.2 億美元。
預計從 2026 年到 2031 年,其複合年成長率將達到 5.21%。
本報告按材料類型(塑膠、紙張、玻璃、金屬)、終端用戶產業(食品、飲料、家居用品及個人護理、醫療保健等)、包裝類型(硬包裝、軟包裝)、再生材料來源(消費後再生材料、工業再生材料等)和地區進行細分。市場預測以美元(USD)為單位。
全球再生材料包裝解決方案市場趨勢及洞察
擴大生產者延伸責任制(EPR)的強制實施範圍
關於生產者責任延伸制度(EPR )的法規已將廢棄產品的處理成本從地方政府轉移到生產商,從而使使用再生材料更具經濟吸引力。越南2024年的法規規定,硬質PET瓶的回收率必須達到22%,材料回收率必須達到40%,這正在推動設備的快速升級。韓國已將寶特瓶再生塑膠的強制性使用比例從3%提高到10%,並計劃在2030年達到30%。泰國的「無標籤PET舉措」正在減少污染,並探索對再生塑膠的稅額扣抵。歐盟的《包裝和包裝廢棄物條例》規定,到2030年,食品包裝中再生PET的使用比例必須達到30%。印度目前允許在食品包裝中使用某些再生塑膠,但必須進行強制性的可追溯性標籤標註。
品牌擁有者2025年再生材料含量目標
全球品牌正在採取超越法規要求的自願措施。雅詩蘭黛的目標是到2030年使用至少25%的消費後回收塑膠(PCR),並將原生塑膠的使用量減半。瑪氏已將其主要糖果甜點罐更換為100%再生塑膠,每年減少原生塑膠的使用量1300噸。億滋國際計畫使用80%的再生塑膠包裝3億條吉百利分享裝巧克力。吉百利澳洲公司已採購1000噸化學回收聚丙烯用於其牛奶巧克力棒的包裝。
優質再生材料供應不穩定
再生PET和高密度聚苯乙烯的價格波動劇烈,為加工商的預算帶來了挑戰。飲料品牌最近發現,食品級rPET的交貨週期長達6-8週,原生替代品只需3週即可到貨。由於污染問題,15-25%的回收塑膠未能通過食品級檢測,導致一些品牌無法履行其再生材料使用承諾。這種價格波動對需要特殊等級的阻隔材料影響尤其嚴重。
細分市場分析
至2025年,紙張將佔再生包裝解決方案市場佔有率的44.25%。這反映了北美成熟的纖維回收體係以及瓦楞紙板超過90%的回收率。預計到2031年,塑膠的複合年成長率將達到6.03%,這主要得益於化學回收提升了食品級塑膠的品質以及新應用的開發。玻璃繼續在高階飲料和化妝品等細分市場中使用,在這些市場中,觸感對於品牌價值至關重要。金屬具有無限的可回收性,吸引了採用閉合迴路回收方式的公司。雖然金屬的用量仍然不大,但它們在氣霧劑、飲料和化妝品包裝領域的地位不斷鞏固。
儘管紙製品市場因全球電子商務的擴張而持續穩定成長,但塑膠製品預計未來將迎來顯著成長。超過80億美元的投資正在加速化學回收利用,有望解決食品級rPET供不應求。例如,伊士曼公司的Gemini Compact產品就採用了分子回收樹脂,展現了塑膠製品進軍化妝品產業的趨勢。因此,預計再生材料包裝解決方案市場中,紙製品和塑膠製品之間的材料成分將逐漸趨於整合。
預計到2025年,食品應用將佔總需求的36.20%,但監管安全標準限制了其成長。在印度,在嚴格的可追溯性要求下,食品包裝中已允許使用某些再生塑膠,這在一定程度上降低了使用門檻。百事可樂等飲料品牌已推出採用50%再生聚丙烯製成的零食包裝,這表明,如果性能允許,此類產品將被更廣泛地採用。
隨著消費者越來越願意為低碳產品支付更高的價格,家庭和個人護理行業預計將以6.58%的複合年成長率成長。波爾公司資助了Meadow公司推出完全可回收的鋁製肥皂和洗髮精包裝盒,顯示各品牌已做好快速更換包裝材料的準備。在電子商務和工業包裝等二次產業中,隨著回收網路的日益完善,更多消費後回收材料(PCR)被採用,再生包裝解決方案的市場也不斷擴大。
區域分析
預計到2025年,亞太地區將佔全球再生材料包裝解決方案市場45.80%的佔有率,複合年成長率(CAGR)為7.55%。越南的生產者延伸責任制(EPR)目標、韓國的再生材料含量標準以及泰國的稅收優惠等監管政策的訂定,正在促進投資流入。東南亞國協對基礎建設的投入,正在消除回收瓶頸,並克服先前阻礙供應穩定的挑戰。
自2017年以來,北美地區宣布投資80億美元擴大回收規模,新增處理量約900廢棄物/年。奧勒岡州和科羅拉多的「生產者延伸責任制」(EPR)將於2025年7月生效,該制度明確了生產者的貢獻,並促進產品重新設計,並專注於可回收性。企業採購承諾確保了銷售管道,並支撐了穩定的投資前景。歐洲在監管方面保持領先地位。到2030年,食品包裝中必須使用30%的再生PET,以及「可回收設計」標準正在推動創新。 4evergreen和FINAT等合作平台分別制定了紙張和標籤襯紙回收的技術指南。南美洲以及中東和非洲的溫和成長反映了新興的津貼早期EPR框架,這些措施正在逐步擴大再生包裝解決方案的市場。
其他好處:
- Excel格式的市場預測(ME)表
- 3個月的分析師支持
目錄
第1章:引言
- 研究假設和市場定義
- 調查範圍
第2章:調查方法
第3章執行摘要
第4章 市場狀況
- 市場概覽
- 市場促進因素
- 擴大強制性生產者延伸責任制(EPR)
- 品牌擁有者2025年再生材料含量目標
- 先進的分選技術:減少污染物
- 消費者偏好低碳包裝
- 企業對淨零排放的承諾正在加速消費後回收材料的採購。
- 對化學品回收能力的投資正在激增。
- 市場限制因素
- 優質再生材料供應不穩定
- 纖維基替代包裝材料的競爭需求
- 原生樹脂價格下跌所帶來的負面經濟影響
- 新興市場缺乏回收基礎設施
- 產業價值鏈分析
- 監理情勢
- 技術展望
- 波特五力分析
- 宏觀經濟因素對市場的影響
第5章 市場規模與成長預測
- 材料類型
- 塑膠
- 紙
- 玻璃
- 金屬
- 按最終用戶行業分類
- 食物
- 飲料
- 居家及個人護理
- 衛生保健
- 其他終端用戶產業
- 按包裝類型
- 硬包裝
- 軟包裝
- 按回收材料來源
- 回收利用的材料(PCR)
- 工業再生材料(PIR)
- 海洋廢棄物和回收廢棄物
- 按地區
- 北美洲
- 美國
- 加拿大
- 墨西哥
- 南美洲
- 巴西
- 阿根廷
- 其他南美國家
- 歐洲
- 德國
- 法國
- 英國
- 義大利
- 西班牙
- 其他歐洲國家
- 亞太地區
- 中國
- 日本
- 印度
- 韓國
- 東南亞國協
- 澳洲和紐西蘭
- 其他亞太國家
- 中東和非洲
- 中東
- 沙烏地阿拉伯
- 阿拉伯聯合大公國
- 土耳其
- 其他中東國家
- 非洲
- 南非
- 奈及利亞
- 埃及
- 其他非洲國家
- 中東
- 北美洲
第6章 競爭情勢
- 市場集中度
- 策略趨勢
- 市佔率分析
- 公司簡介
- Amcor plc
- Kruger Inc.
- Smurfit WestRock plc
- Packaging Corporation of America
- Tetra Laval International SA
- International Paper Company
- Mondi plc
- Verallia SA
- Sealed Air Corporation
- Ardagh Group
- Plastipak Holdings, Inc.
- Billerud AB
- Stora Enso Oyj
- UPM-Kymmene Corporation
- Huhtamaki Oyj
- Graphic Packaging Holding Company
- Veolia Environnement SA
- Eco-Products, Inc.
- Loop Industries, Inc.
- Sonoco Products Company
第7章 市場機會與未來展望
According to Mordor Intelligence, the recycled materials packaging solutions market size in 2026 is estimated at USD 210.35 billion, growing from 2025 value of USD 199.93 billion with 2031 projections showing USD 271.42 billion, growing at 5.21% CAGR over 2026-2031.
This report is Segmented by Material Type (Plastic, Paper, Glass, and Metal), End-User Industry (Food, Beverage, Home and Personal Care, Healthcare, and More), Packaging Type (Rigid Packaging, and Flexible Packaging), Source of Recycled Material (Post-Consumer Recyclate, Post-Industrial Recyclate, and More), and Geography. The Market Forecasts are Provided in Terms of Value (USD).
Global Recycled Materials Packaging Solutions Market Trends and Insights
Extended Producer Responsibility (EPR) Mandates Expansion
EPR statutes shift end-of-life costs from municipalities to producers, making recycled content economically attractive. Vietnam's 2024 rules require 22% recycling for rigid PET and 40% material recovery rates, sparking rapid equipment upgrades. South Korea is boosting the required recycled plastic in PET bottles from 3% to 10% and targets 30% by 2030. Thailand's label-free PET initiative trims contamination and considers tax credits for recycled resin. The EU Packaging and Packaging Waste Regulation mandates 30% recycled PET in food packaging by 2030. India now allows specified recycled plastics in food packaging, requiring traceability labelling.
Brand-Owner 2025 Recycled-Content Targets
Global brands are voluntarily outpacing regulation. Estee Lauder seeks at least 25% PCR and to halve virgin plastic by 2030. Mars moved key confectionery jars to 100% recycled resin, cutting 1,300 tonnes of virgin plastic each year. Mondelez will package 300 million Cadbury sharing bars in 80% attributable recycled plastic. Cadbury Australia sourced 1,000 tonnes of chemically recycled polypropylene for Dairy Milk bars.
Volatile Supply of High-Quality Recycled Feedstock
Pricing for recycled PET and high-density polyethylene swings widely, imposing budgeting challenges for converters. Beverage brands recently queued 6-8 weeks for food-grade rPET while virgin alternatives were available in 3 weeks. Contamination means 15-25% of collected plastics fail food-grade tests, forcing some brands to under-fulfill recycled-content pledges. The volatility is most acute for barrier materials that demand specialty grades.
Other drivers and restraints analyzed in the detailed report include:
- Advanced Sortation Technologies: Reducing Contamination
- Consumer Preference for Low-Carbon Packaging
- Competing Demand from Fiber-Based Substitute Packaging
For complete list of drivers and restraints, kindly check the Table Of Contents.
Segment Analysis
In 2025, paper commanded 44.25% of the recycled materials packaging solutions market share, reflecting mature fiber collection systems and corrugated recovery rates above 90% in North America. Plastic is projected to post a 6.03% CAGR through 2031 as chemical recycling improves food-grade quality and unlocks new applications. Glass continues serving premium beverage and cosmetic niches where brand equity values tactile heft. Metal offers infinite recyclability that attracts closed-loop purchasers, buttressing its role in aerosol, beverage, and cosmetics packaging even when volumes remain modest.
Paper maintains steady growth due to global e-commerce, but plastics claim future upside. Investment topping USD 8 billion accelerates chemical recycling to offset the shortfall in food-grade rPET. Examples such as Eastman's Gemini compact underscore plastics' progress into cosmetics using molecularly recycled resins. Consequently, the recycled materials packaging solutions market expects a gradual convergence in the material mix between paper and plastic solutions.
Food applications generated 36.20% of 2025 demand, but regulatory safety thresholds constrain growth. India's new allowance of specific recycled plastics in food packaging under strict traceability slightly relaxes barriers. Beverage brands such as PepsiCo demonstrate 50% recycled polypropylene snack packs, hinting at broader adoption where performance permits.
Home and personal care is set to rise at a 6.58% CAGR, as consumers accept premiums for low-carbon formats. Ball Corporation financed Meadow to launch fully recyclable aluminum cartridges for soaps and shampoos, showing brand readiness to switch materials swiftly. Secondary industries such as e-commerce and industrial packaging also incorporate more PCR as collection networks mature, broadening the recycled materials packaging solutions market.
Complete Report Scope:
- By Material Type
- Plastic
- Paper
- Glass
- Metal
- By End-User Industry
- Food
- Beverage
- Home and Personal Care
- Healthcare
- Other End-user Industries
- By Packaging Type
- Rigid Packaging
- Flexible Packaging
- By Source of Recycled Material
- Post-consumer Recyclate (PCR)
- Post-industrial Recyclate (PIR)
- Ocean-bound and Recovered Waste
- By Geography
- North America
- United States
- Canada
- Mexico
- South America
- Brazil
- Argentina
- Rest of South America
- Europe
- Germany
- France
- United Kingdom
- Italy
- Spain
- Rest of Europe
- Asia-Pacific
- China
- Japan
- India
- South Korea
- ASEAN Countries
- Australia and New Zealand
- Rest of Asia-Pacific
- Middle East and Africa
- Middle East
- Saudi Arabia
- United Arab Emirates
- Turkey
- Rest of Middle East
- Africa
- South Africa
- Nigeria
- Egypt
- Rest of Africa
- Middle East
- North America
Geography Analysis
Asia-Pacific held 45.80% of the recycled materials packaging solutions market size in 2025 and will grow at a 7.55% CAGR. Regulatory clarity, such as Vietnam's EPR targets, South Korea's recycled-content thresholds, and Thailand's tax incentives, is reinforcing investment flows. Infrastructure financing across ASEAN nations addresses collection bottlenecks, closing gaps that historically impeded supply consistency.
North America benefits from USD 8 billion in announced recycling expansions since 2017, adding capacity to process almost 9 million tonnes of waste annually. Extended Producer Responsibility laws in Oregon and Colorado that take effect in July 2025 clarify producer fees and spur redesign toward recyclability. Corporate procurement commitments secure offtake, supporting a stable investment outlook. Europe sustains regulatory leadership. Mandatory 30% recycled PET for food packaging by 2030 and design-for-recycling criteria foster innovation pipelines. Collaborative platforms such as 4evergreen and FINAT develop technical guidance for paper and label liner recycling, respectively. Moderate growth in South America and the Middle East & Africa reflects emerging grant funding and nascent EPR frameworks that gradually enlarge the recycled materials packaging solutions market.
- Amcor plc
- Kruger Inc.
- Smurfit WestRock plc
- Packaging Corporation of America
- Tetra Laval International S.A.
- International Paper Company
- Mondi plc
- Verallia SA
- Sealed Air Corporation
- Ardagh Group
- Plastipak Holdings, Inc.
- Billerud AB
- Stora Enso Oyj
- UPM-Kymmene Corporation
- Huhtamaki Oyj
- Graphic Packaging Holding Company
- Veolia Environnement S.A.
- Eco-Products, Inc.
- Loop Industries, Inc.
- Sonoco Products Company
Additional Benefits:
- The market estimate (ME) sheet in Excel format
- 3 months of analyst support
TABLE OF CONTENTS
1 INTRODUCTION
- 1.1 Study Assumptions and Market Definition
- 1.2 Scope of the Study
2 RESEARCH METHODOLOGY
3 EXECUTIVE SUMMARY
4 MARKET LANDSCAPE
- 4.1 Market Overview
- 4.2 Market Drivers
- 4.2.1 Extended Producer Responsibility (EPR) Mandates Expansion
- 4.2.2 Brand-Owner 2025 Recycled-Content Targets
- 4.2.3 Advanced Sortation Technologies: Reducing Contamination
- 4.2.4 Consumer Preference for Low-Carbon Packaging
- 4.2.5 Corporate Net-Zero Commitments Accelerating PCR Procurement
- 4.2.6 Surging Investment in Chemical Recycling Capacity
- 4.3 Market Restraints
- 4.3.1 Volatile Supply of High-Quality Recycled Feedstock
- 4.3.2 Competing Demand from Fiber-Based Substitute Packaging
- 4.3.3 Unfavorable Economics when Virgin Resin Prices Decline
- 4.3.4 Recycling Infrastructure Gaps in Emerging Markets
- 4.4 Industry Value Chain Analysis
- 4.5 Regulatory Landscape
- 4.6 Technological Outlook
- 4.7 Porter's Five Forces Analysis
- 4.7.1 Bargaining Power of Suppliers
- 4.7.2 Bargaining Power of Buyers
- 4.7.3 Threat of New Entrants
- 4.7.4 Threat of Substitutes
- 4.7.5 Intensity of Competitive Rivalry
- 4.8 Impact of Macroeconomic Factors on the Market
5 MARKET SIZE AND GROWTH FORECASTS (VALUE)
- 5.1 By Material Type
- 5.1.1 Plastic
- 5.1.2 Paper
- 5.1.3 Glass
- 5.1.4 Metal
- 5.2 By End-User Industry
- 5.2.1 Food
- 5.2.2 Beverage
- 5.2.3 Home and Personal Care
- 5.2.4 Healthcare
- 5.2.5 Other End-user Industries
- 5.3 By Packaging Type
- 5.3.1 Rigid Packaging
- 5.3.2 Flexible Packaging
- 5.4 By Source of Recycled Material
- 5.4.1 Post-consumer Recyclate (PCR)
- 5.4.2 Post-industrial Recyclate (PIR)
- 5.4.3 Ocean-bound and Recovered Waste
- 5.5 By Geography
- 5.5.1 North America
- 5.5.1.1 United States
- 5.5.1.2 Canada
- 5.5.1.3 Mexico
- 5.5.2 South America
- 5.5.2.1 Brazil
- 5.5.2.2 Argentina
- 5.5.2.3 Rest of South America
- 5.5.3 Europe
- 5.5.3.1 Germany
- 5.5.3.2 France
- 5.5.3.3 United Kingdom
- 5.5.3.4 Italy
- 5.5.3.5 Spain
- 5.5.3.6 Rest of Europe
- 5.5.4 Asia-Pacific
- 5.5.4.1 China
- 5.5.4.2 Japan
- 5.5.4.3 India
- 5.5.4.4 South Korea
- 5.5.4.5 ASEAN Countries
- 5.5.4.6 Australia and New Zealand
- 5.5.4.7 Rest of Asia-Pacific
- 5.5.5 Middle East and Africa
- 5.5.5.1 Middle East
- 5.5.5.1.1 Saudi Arabia
- 5.5.5.1.2 United Arab Emirates
- 5.5.5.1.3 Turkey
- 5.5.5.1.4 Rest of Middle East
- 5.5.5.2 Africa
- 5.5.5.2.1 South Africa
- 5.5.5.2.2 Nigeria
- 5.5.5.2.3 Egypt
- 5.5.5.2.4 Rest of Africa
- 5.5.5.1 Middle East
- 5.5.1 North America
6 COMPETITIVE LANDSCAPE
- 6.1 Market Concentration
- 6.2 Strategic Moves
- 6.3 Market Share Analysis
- 6.4 Company Profiles (includes Global level Overview, Market level overview, Core Segments, Financials as available, Strategic Information, Market Rank/Share for key companies, Products and Services, and Recent Developments)
- 6.4.1 Amcor plc
- 6.4.2 Kruger Inc.
- 6.4.3 Smurfit WestRock plc
- 6.4.4 Packaging Corporation of America
- 6.4.5 Tetra Laval International S.A.
- 6.4.6 International Paper Company
- 6.4.7 Mondi plc
- 6.4.8 Verallia SA
- 6.4.9 Sealed Air Corporation
- 6.4.10 Ardagh Group
- 6.4.11 Plastipak Holdings, Inc.
- 6.4.12 Billerud AB
- 6.4.13 Stora Enso Oyj
- 6.4.14 UPM-Kymmene Corporation
- 6.4.15 Huhtamaki Oyj
- 6.4.16 Graphic Packaging Holding Company
- 6.4.17 Veolia Environnement S.A.
- 6.4.18 Eco-Products, Inc.
- 6.4.19 Loop Industries, Inc.
- 6.4.20 Sonoco Products Company
7 MARKET OPPORTUNITIES AND FUTURE OUTLOOK
- 7.1 White-space and Unmet-need Assessment

 兒童安全及老年人友善包裝市場預測至2034年-按包裝類型、材料、機制、分銷管道、最終用戶和地區分類的全球分析
 再生塑膠屋頂瓦市場規模、佔有率和成長分析:按產品類型、材料來源、應用、分銷管道和地區分類-產業預測(2026-2033 年)
 PVC包裝帶市場:策略洞察與預測(2026-2031年)
 自黏氈墊市場:全球市場預測(2026-2032 年)兒童安全藥品包裝市場預測至2034年-按包裝類型、材料類型、藥品類型、最終用戶和地區分類的全球分析
 可重複使用罐:市場佔有率分析、行業趨勢和統計數據、成長預測(2026-2031)PCB先進材料市場預測至2034年-按PCB類型、材料類型、功能、最終用戶和地區分類的全球分析包裝材料市場預測至2034年-按材料、包裝類型、應用、最終用戶和地區分類的全球分析
 2026-2030年全球包裝材料市場鍵合線封裝材料市場:依材料、封裝類型、線徑及最終用途產業分類-2026-2032年全球市場預測