


 |
市場調查報告書
商品編碼
2120446
檸檬酸:市場佔有率分析、產業趨勢與統計、成長預測(2026-2031)Citric Acid - Market Share Analysis, Industry Trends & Statistics, Growth Forecasts (2026 - 2031) |
||||||

※ 本網頁內容可能與最新版本有所差異。詳細情況請與我們聯繫。
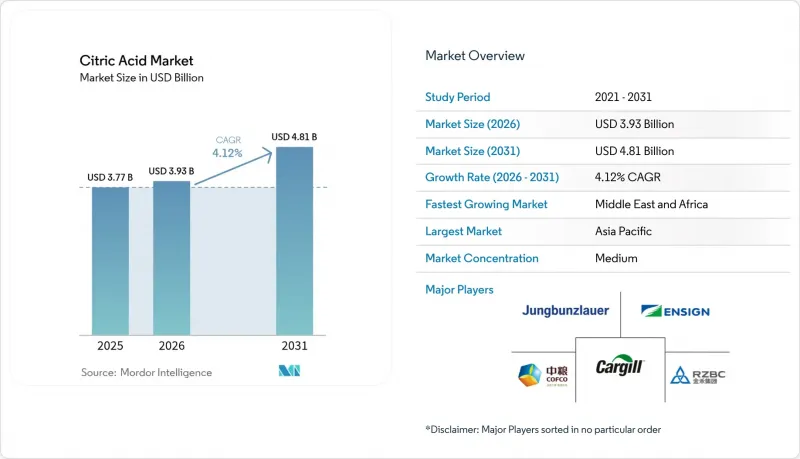
根據 Mordor Intelligence 預測,檸檬酸市場規模預計將從 2025 年的 37.7 億美元成長到 2026 年的 39.3 億美元,到 2031 年達到 48.1 億美元,2026 年至 2031 年的複合年成長率預計為 4.12%。
本報告按形態(無水、液體)、應用領域(食品飲料[烘焙、糖果甜點、乳製品、飲料、家常小菜和零食、其他]、藥品、個人護理和化妝品、清潔劑和家用清潔產品、其他)以及地區(北美、歐洲、亞太、南美、中東和非洲)進行細分。市場預測以價值(美元)和數量(噸)表示。
全球檸檬酸市場趨勢與洞察
加工食品和飲料對「潔淨標示」的需求激增。
由於消費者偏好易於識別的成分,食品生產商被迫以天然替代品取代合成防腐劑。因此,檸檬酸在烘焙、糖果甜點和乳製品領域被定位為兼具酸味劑和抗菌雙重功能的添加劑。美國食品藥物管理局 (FDA) 根據《聯邦法規》21 CFR 582.1033 將檸檬酸認定為「公認安全 (GRAS)」的直接食品添加劑,消除了監管障礙,使產品開發商能夠在不引起消費者擔憂的情況下將檸檬酸列入成分標籤。飲料生產商正在利用檸檬酸的酸性來掩蓋低糖配方中令人不悅的味道,隨著拉丁美洲和東南亞糖稅的普及,這一趨勢正在加速發展。在烘焙領域,檸檬酸的特性被用於延長保存期限,其作用是將 pH 值降低到 4.6 以下,並抑制肉毒桿菌的生長,且不會像山梨酸鹽和苯甲酸鹽那樣產生金屬味。零售業的監管法規進一步加劇了人們對「潔淨標示」的需求。歐洲大型連鎖超市現在要求供應商在其自有品牌產品中去除E編號添加劑,這加速了精簡流程,使檸檬酸取代丙酸鈣和苯甲酸鈉成為更優的選擇。
磷酸鹽使用禁令導致清潔劑。
歐盟法規 (EC) 648/2004 對家用清潔劑中的磷酸鹽含量作出了規定,並通過修正案將磷含量限制在每次標準使用量 0.3 克以內,這促使人們開始使用檸檬酸及其鈉鹽作為螯合劑和助垢劑。檸檬酸能夠螯合硬水中的鈣離子和鎂離子,防止衣物和洗衣機零件上形成水垢。此外,根據經合組織 (OECD) 301B 協議,檸檬酸具有生物分解性,符合磷酸鹽無法達到的環境標準。預計到 2025 年,歐洲家用清潔產品的消費量將達到約 10 萬噸,其中大部分消費在德國、法國和英國。北美地區也正在效仿,美國一些州已立法禁止在洗碗機清潔劑中使用磷酸鹽,加拿大各省也考慮採取類似措施。預計到2031年,清潔劑行業的複合年成長率將達到6.03%,這不僅反映了監管力度的加大,也體現了配方研發人員對檸檬酸即使在低pH值下也能保持穩定性的認知,從而能夠開發高濃度液體產品,並減輕包裝重量和運輸排放。這對倡導永續性的品牌來說無疑是雙重利好。
玉米和糖價格波動
檸檬酸生產的經濟可行性取決於原料成本,其中糖蜜、玉米萃取物和精製糖佔發酵過程總生產成本的40-50%。 2023/24年度全球整體糖產量達1.794億噸,巴西出口3,400萬噸,但糖價仍容易受到極端天氣事件的影響。 2024年,泰國和印度的厄爾尼諾現象引發的乾旱導致甘蔗減產。這造成糖蜜供應緊張,現貨價格較去年同期上漲18-22%。玉米價格對美國和歐洲的生產商至關重要,但由於強制性生質燃料政策,玉米價格波動不定。美國可再生燃料標準(RFS)規定每年生產150億加侖玉米乙醇,導致原料挪為他用,並在歉收年份加劇競爭。化肥成本從2022年4月的每噸815美元暴跌至2024年4月的每噸327美元,暫時緩解了市場壓力。然而,由於貨櫃運輸中斷(紅海航線改道和巴拿馬運河吃水限制)導致運費波動,預計2025年糖蜜和原糖的進口成本將上漲12%至15%。如果原物料價格上漲超過生產商將成本轉嫁給下游的能力,那麼那些糖精煉或玉米濕磨環節垂直整合程度不足的生產商將面臨利潤率壓力。這種趨勢在價格敏感的食品領域尤其明顯,因為買家在合約期間往往不願意接受價格調整。
細分市場分析
到2025年,無水檸檬酸將以55.62%的市佔率佔據主導地位,鞏固其在對水分敏感的乾混應用中的地位。其晶體穩定性對於粉末飲料混合物、發泡和烘焙改良劑至關重要,可防止其與碳酸氫鹽和吸濕性成分過早發生反應。預計到2031年,液態檸檬酸的複合年成長率將達到5.80%,在製藥和個人保健產品領域備受關注,這些領域優先考慮水溶液中精確的pH值控制和易於操作的特性。製藥業向液態口腔崩壞膜和兒童糖漿的轉變推動了液態檸檬酸的應用,因為它避免了無塵室中的粉塵和靜電問題。餐飲服務業商也更傾向於使用液態檸檬酸來供應飲料和配製調味品,因為使用預先溶解的檸檬酸無需攪拌,從而降低了人事費用。無水檸檬酸由於其結晶和乾燥工藝,具有製造成本較低的優勢,但液態檸檬酸供應商透過在與發酵廠同一場所建立設施來降低水運輸成本,從而縮小了差距。
兩種形式的檸檬酸均符合 ISO 9001 和 HACCP 標準。然而,根據聯合國運輸法規,無水檸檬酸被歸類為非危險固態,但同時也被指定為腐蝕性物質(聯合國 1760,第 8 章),這簡化了物流,而液態檸檬酸則需要特殊的容器和處理方式。噴霧乾燥和流化床造粒技術的創新使得無水檸檬酸生產商能夠根據特定應用定製粒徑,例如用於片劑生產的粗粒(40-100 目)和用於澄清飲料的細粉(200 目及以上)。這些客製化產品的售價比標準無水檸檬酸高出 10-15%。作為回應,液態檸檬酸供應商提供穩定配方。這些配方可將螯合金屬的含量降低到 ppm 以下,滿足化妝品和注射的嚴格標準,因為即使是少量的鐵或銅也會導致變色或氧化。
區域分析
預計到2025年,亞太地區將佔據35.43%的市場。這主要得益於中國強大的生產能力以及食品加工和工業領域的國內需求激增。該地區的優勢包括完善的發酵基礎設施、具有競爭力的生產成本以及便捷獲取玉米和甘蔗等關鍵原料。然而,貿易緊張局勢和反傾銷措施正在改變該地區的格局。印度、泰國和其他東南亞國家正在擴大產能,以滿足國內和出口需求。日本先進的製藥和食品加工業展現出良好的市場前景,而澳洲快速成長的飲料產業也在推動區域消費成長。
中東和非洲是值得關注的地區,預計到2031年,其年複合成長率(CAGR)將達到6.56%。這一成長主要得益於沙烏地阿拉伯和阿拉伯聯合大公國等國食品加工業的快速擴張和基礎設施投資。該地區政府主導的旨在加強糧食安全和實現產業多元化的舉措,正在為檸檬酸創造新的需求中心。 NEOM與Liberation Labs合作建立微發酵設施,充分展現了該地區在先進生物製造領域的雄心。同時,北美和歐洲的食品和製藥行業已發展成熟,需求穩定,但市場飽和和監管趨於一致,導致其成長速度放緩。
歐洲市場保持穩定,這得益於食品、飲料和個人護理行業的強勁需求,以及嚴格的品質標準和完善的加工設施。北美市場成長穩健,主要受即飲飲料、簡便食品和藥品需求激增的推動。該地區的消費者越來越傾向於選擇成分潔淨標示的產品,並將檸檬酸用作天然防腐劑和增味劑。在南美洲,尤其是在巴西和阿根廷等國家,由於食品加工業的成長和加工食品需求的增加,市場正在擴張。南美洲的生產商擁有雙重優勢:一方面,他們擁有豐富的檸檬酸生產原料;另一方面,他們對進口的依賴程度較低。在歐洲、北美和南美洲,有利於天然添加劑的法律規範進一步提升了檸檬酸的市場潛力,為全球和本地企業創造了商機。
其他福利
- Excel格式的市場預測(ME)表
- 3個月的分析師支持
目錄
第1章:引言
- 研究假設和市場定義
- 調查範圍
第2章:調查方法
第3章執行摘要
第4章 市場狀況
- 市場概覽
- 市場促進因素
- 加工食品和飲料對「潔淨標示」的需求激增。
- 磷酸鹽使用禁令導致清潔劑。
- 拓展藥用輔料的應用
- 擴大亞洲生物基生產能力
- 利用解脂耶氏酵母產生的廢棄甘油的商業化途徑
- 歐盟綠色交易對可生物分解螯合劑給予優惠待遇
- 市場限制因素
- 玉米和糖價格波動
- 中國產能過剩以及反傾銷稅對利潤率造成的壓力
- 妥善處理石膏廢棄物的成本正在迅速增加。
- 新興多元酸混合物帶來的替代品威脅
- 供應鏈分析
- 監理情勢
- 技術展望
- 波特五力模型
第5章 市場規模與成長預測
- 按形式
- 無水
- 液體
- 透過使用
- 飲食
- 麵包店
- 糖果甜點
- 乳製品
- 飲料
- 家常小菜和零食
- 其他食品和飲料
- 製藥
- 個人護理和化妝品
- 清潔劑和家用清潔劑
- 其他
- 飲食
- 按地區
- 北美洲
- 美國
- 加拿大
- 墨西哥
- 其他北美國家
- 歐洲
- 英國
- 德國
- 法國
- 義大利
- 西班牙
- 瑞典
- 比利時
- 波蘭
- 荷蘭
- 其他歐洲國家
- 亞太地區
- 中國
- 日本
- 印度
- 泰國
- 新加坡
- 韓國
- 澳洲
- 紐西蘭
- 其他亞太國家
- 南美洲
- 巴西
- 阿根廷
- 哥倫比亞
- 智利
- 秘魯
- 其他南美國家
- 中東和非洲
- 阿拉伯聯合大公國
- 沙烏地阿拉伯
- 卡達
- 土耳其
- 南非
- 奈及利亞
- 埃及
- 摩洛哥
- 其他中東和非洲國家
- 北美洲
第6章 競爭情勢
- 市場集中度
- 策略趨勢
- 市場排名分析
- 公司簡介
- Archer Daniels Midland Company
- Cargill Incorporated
- Jungbunzlauer Suisse AG
- Weifang Ensign Industry Co. Ltd.
- RZBC Group Co. Ltd.
- Tate & Lyle PLC
- COFCO Biochemical(Anhui)Co. Ltd.
- Gadot Biochemical Industries Ltd.
- Citrique Belge NV
- Huangshi Xinghua Biochemical Co. Ltd.
- TTCA Co. Ltd.
- Jiangsu Guoxin Union Energy Co. Ltd.
- Laiwu Taihe Biochemistry Co. Ltd.
- BBCA Group
- Pfizer Inc.
- Kenko Corporation
- Natural Biological Group
- SA Citrique Belge NV
- Shandong Ensign Industry Co., Ltd.
- Foodchem International Corporation
第7章 市場機會與未來展望
According to Mordor Intelligence, the citric acid market size is expected to grow from USD 3.77 billion in 2025 to USD 3.93 billion in 2026, and reach USD 4.81 billion by 2031, growing at a CAGR of 4.12% from 2026 to 2031.
This report is Segmented by Form (Anhydrous and Liquid), Application (Food and Beverages [Bakery, Confectionery, Dairy, Beverages, Savory and Snacks, and More], Pharmaceuticals, Personal Care and Cosmetics, Detergents and Household Cleaners, and More), and Geography (North America, Europe, Asia-Pacific, South America, Middle East and Africa). Market Forecasts are Provided in Terms of Value (USD) and Volume (Tons).
Global Citric Acid Market Trends and Insights
Clean-label demand surge in processed foods and beverages
Consumer preference for recognizable ingredients has compelled food manufacturers to replace synthetic preservatives with naturally derived alternatives, positioning citric acid as a dual-function acidulant and antimicrobial agent in bakery, confectionery, and dairy applications. FDA recognition under 21 CFR 582.1033 as a direct food substance affirmed as generally recognized as safe (GRAS) eliminates regulatory friction, enabling formulators to declare citric acid on ingredient panels without consumer skepticism. Beverage producers are leveraging citric acid's tartness to mask off-notes in reduced-sugar formulations, a trend accelerating as sugar taxes proliferate across Latin America and Southeast Asia. Bakery applications benefit from citric acid's ability to extend shelf life by lowering pH below 4.6, inhibiting Clostridium botulinum growth without imparting the metallic aftertaste associated with sorbates or benzoates. The clean-label imperative is further amplified by retailer mandates; major European grocery chains now require suppliers to eliminate E-number additives from private-label lines, driving reformulation cycles that favor citric acid over calcium propionate or sodium benzoate.
Phosphate bans boosting citrate use in detergents
Regulatory restrictions on phosphates in household detergents, codified in EU Regulation (EC) 648/2004 and reinforced by amendments limiting phosphorus content to 0.3 grams per standard dose, have catalyzed substitution with citric acid and its sodium salts as builders and chelating agents. Citric acid sequesters calcium and magnesium ions in hard water, preventing scale deposition on fabrics and washing-machine components, while its biodegradability under OECD 301B protocols satisfies environmental criteria that phosphates fail. European consumption of household cleaning products reached approximately 100,000 tonnes in 2025, with Germany, France, and the United Kingdom accounting for the majority of uptake. North American jurisdictions are following suit; several U.S. states have enacted phosphate bans in automatic dishwasher detergents, and Canadian provinces are considering similar measures. The detergent segment's 6.03% CAGR through 2031 reflects not only regulatory push but also formulator recognition that citric acid enables concentrated liquid formats by maintaining stability at lower pH, reducing packaging weight and transport emissions, a dual benefit as brands pursue sustainability claims.
Corn and sugar price volatility
Citric acid production economics hinge on feedstock costs, with molasses, corn-steep liquor, and refined sugar accounting for 40-50% of total manufacturing expenses in fermentation-based processes. Sugar production in the 2023/24 crop year totaled 179.4 million tonnes globally, with Brazil exporting 34 million tonnes, yet prices remain susceptible to weather anomalies. El Nino-induced droughts in Thailand and India curtailed 2024 cane yields, tightening molasses availability and elevating spot prices by 18-22% year-over-year. Corn prices, critical for U.S. and European producers, oscillate with biofuel mandates; the U.S. Renewable Fuel Standard's requirement for 15 billion gallons of corn ethanol annually diverts feedstock, creating competition that spikes during short-crop years. Fertilizer cost collapses, from USD 815 per tonne in April 2022 to USD 327 per tonne in April 2024, providing temporary relief, yet freight-rate volatility linked to container-shipping disruptions (Red Sea diversions, Panama Canal draft restrictions) has inflated import bills for molasses and raw sugar by 12-15% in 2025. Producers lacking vertical integration into sugar refining or corn wet-milling face margin compression when feedstock inflation outpaces their ability to pass costs downstream, particularly in price-sensitive food-grade segments where buyers resist mid-contract adjustments.
Other drivers and restraints analyzed in the detailed report include:
- Expanding pharmaceutical excipient applications
- Growth of bio-based production capacity in Asia
- Margin pressure from Chinese overcapacity and anti-dumping duties
For complete list of drivers and restraints, kindly check the Table Of Contents.
Segment Analysis
In 2025, anhydrous citric acid dominated the market with a 55.62% share, solidifying its role in dry-blend applications sensitive to moisture. Its crystalline stability is crucial for powdered beverage mixes, effervescent tablets, and bakery enhancers, preventing premature reactions with bicarbonates and hygroscopic ingredients. Liquid citric acid, projected to grow at a 5.80% CAGR through 2031, is gaining traction in pharmaceutical and personal-care products, where precise pH control in aqueous systems and ease of handling are prioritized. The pharmaceutical industry's shift to liquid orally disintegrating films and pediatric syrups is driving liquid citric acid adoption, avoiding dust and static-electricity issues in cleanrooms. Food-service operators are also favoring liquid formats for beverage dispensing and dressing preparation, as pre-dissolved citric acid eliminates mixing and reduces labor costs. While anhydrous citric acid benefits from lower production costs due to crystallization and drying, liquid suppliers are closing the gap by co-locating with fermentation plants to reduce water transport costs.
Both forms of citric acid comply with ISO 9001 and HACCP protocols. However, anhydrous citric acid, classified as a non-hazardous solid under UN transport regulations, simplifies logistics compared to liquid citric acid, labeled as corrosive (UN 1760, Class 8), which requires specialized containers and handling. Innovations in spray-drying and fluidized-bed granulation are enabling anhydrous producers to customize particle sizes for specific uses, such as coarse granules (40-100 mesh) for tableting and fine powders (200+ mesh) for beverage clouding. These tailored products command a 10-15% premium over standard anhydrous citric acid. Liquid citric acid suppliers are countering with stabilized formulations, removing chelated trace metals to sub-ppm levels to meet stringent cosmetic and injectable-pharmaceutical standards, where even minor iron or copper contamination can cause discoloration or oxidation.
Complete Report Scope:
- Form
- Anhydrous
- Liquid
- Application
- Food and Beverages
- Bakery
- Confectionery
- Dairy
- Beverages
- Savory and Snacks
- Other Foods and Beverages
- Pharmaceuticals
- Personal Care and Cosmetics
- Detergents and Household Cleaners
- Others
- Food and Beverages
- Geography
- North America
- United States
- Canada
- Mexico
- Rest of North America
- Europe
- United Kingdom
- Germany
- France
- Italy
- Spain
- Sweden
- Belgium
- Poland
- Netherlands
- Rest of Europe
- Asia-Pacific
- China
- Japan
- India
- Thailand
- Singapore
- South Korea
- Australia
- New Zealand
- Rest of Asia Pacific
- South America
- Brazil
- Argentina
- Colombia
- Chile
- Peru
- Rest of South America
- Middle East and Africa
- United Arab Emirates
- Saudi Arabia
- Qatar
- Turkey
- South Africa
- Nigeria
- Egypt
- Morocco
- Rest of Middle East and Africa
- North America
Geography Analysis
In 2025, Asia-Pacific commands a 35.43% market share, largely due to China's robust production capabilities and its surging domestic appetite in food processing and industrial sectors. The region's advantages include a well-established fermentation infrastructure, competitive production costs, and close access to vital raw materials like corn and sugarcane derivatives. Yet, trade tensions and anti-dumping measures are altering the regional landscape. Countries like India, Thailand, and other Southeast Asian nations are ramping up production capacities to cater to both local and export demands. Japan's sophisticated pharmaceutical and food processing sectors present lucrative market prospects, while Australia's burgeoning beverage industry bolsters regional consumption.
The Middle East and Africa are the regions to watch, boasting a 6.56% CAGR through 2031. This growth is largely attributed to the burgeoning food processing sectors and infrastructural investments in nations such as Saudi Arabia and the UAE. Government initiatives in the region, aimed at bolstering food security and diversifying industries, are birthing new demand hubs for citric acid. NEOM's collaboration with Liberation Labs to set up precision fermentation facilities underscores the region's ambition in advanced biomanufacturing. Meanwhile, North America and Europe, with their entrenched food and pharmaceutical sectors, offer stable demand, albeit with tempered growth rates due to market saturation and regulatory consistency.
Europe, with its robust demand from the food, beverage, and personal care sectors, remains a stable player, bolstered by stringent quality standards and established processing facilities. North America's growth is steady, driven by a surge in ready-to-drink beverages, convenience foods, and pharmaceuticals. Consumers here increasingly lean towards clean-label ingredients, using citric acid as a natural preservative and flavor enhancer. South America, particularly in nations like Brazil and Argentina, is on the rise, thanks to its expanding food processing sectors and a growing appetite for packaged foods. South American manufacturers enjoy the dual advantage of abundant agricultural feedstocks for citric acid production and a reduced reliance on imports. Across Europe, North America, and South America, regulatory frameworks that favor natural additives further enhance citric acid's market potential, presenting opportunities for both global giants and local players.
- Archer Daniels Midland Company
- Cargill Incorporated
- Jungbunzlauer Suisse AG
- Weifang Ensign Industry Co. Ltd.
- RZBC Group Co. Ltd.
- Tate & Lyle PLC
- COFCO Biochemical (Anhui) Co. Ltd.
- Gadot Biochemical Industries Ltd.
- Citrique Belge N.V.
- Huangshi Xinghua Biochemical Co. Ltd.
- TTCA Co. Ltd.
- Jiangsu Guoxin Union Energy Co. Ltd.
- Laiwu Taihe Biochemistry Co. Ltd.
- BBCA Group
- Pfizer Inc.
- Kenko Corporation
- Natural Biological Group
- S.A. Citrique Belge N.V.
- Shandong Ensign Industry Co., Ltd.
- Foodchem International Corporation
Additional Benefits:
- The market estimate (ME) sheet in Excel format
- 3 months of analyst support
TABLE OF CONTENTS
1 INTRODUCTION
- 1.1 Study Assumptions and Market Definition
- 1.2 Scope of the Study
2 RESEARCH METHODOLOGY
3 EXECUTIVE SUMMARY
4 MARKET LANDSCAPE
- 4.1 Market Overview
- 4.2 Market Drivers
- 4.2.1 Clean-label demand surge in processed foods and beverages
- 4.2.2 Phosphate bans boosting citrate use in detergents
- 4.2.3 Expanding pharmaceutical excipient applications
- 4.2.4 Growth of bio-based production capacity in Asia
- 4.2.5 Commercialization of Yarrowia lipolytica waste-glycerol routes
- 4.2.6 EU Green Deal incentives for biodegradable chelants
- 4.3 Market Restraints
- 4.3.1 Corn and sugar price volatility
- 4.3.2 Margin pressure from Chinese overcapacity and anti-dumping duties
- 4.3.3 Surge in gypsum-waste disposal compliance costs
- 4.3.4 Substitution threat from emerging multi-acid blends
- 4.4 Supply Chain Analysis
- 4.5 Regulatory Landscape
- 4.6 Technological Outlook
- 4.7 Porter's Five Forces
- 4.7.1 Threat of New Entrants
- 4.7.2 Bargaining Power of Buyers
- 4.7.3 Bargaining Power of Suppliers
- 4.7.4 Threat of Substitutes
- 4.7.5 Intensity of Competitive Rivalry
5 MARKET SIZE AND GROWTH FORECASTS (VALUE AND VOLUME)
- 5.1 Form
- 5.1.1 Anhydrous
- 5.1.2 Liquid
- 5.2 Application
- 5.2.1 Food and Beverages
- 5.2.1.1 Bakery
- 5.2.1.2 Confectionery
- 5.2.1.3 Dairy
- 5.2.1.4 Beverages
- 5.2.1.5 Savory and Snacks
- 5.2.1.6 Other Foods and Beverages
- 5.2.2 Pharmaceuticals
- 5.2.3 Personal Care and Cosmetics
- 5.2.4 Detergents and Household Cleaners
- 5.2.5 Others
- 5.2.1 Food and Beverages
- 5.3 Geography
- 5.3.1 North America
- 5.3.1.1 United States
- 5.3.1.2 Canada
- 5.3.1.3 Mexico
- 5.3.1.4 Rest of North America
- 5.3.2 Europe
- 5.3.2.1 United Kingdom
- 5.3.2.2 Germany
- 5.3.2.3 France
- 5.3.2.4 Italy
- 5.3.2.5 Spain
- 5.3.2.6 Sweden
- 5.3.2.7 Belgium
- 5.3.2.8 Poland
- 5.3.2.9 Netherlands
- 5.3.2.10 Rest of Europe
- 5.3.3 Asia-Pacific
- 5.3.3.1 China
- 5.3.3.2 Japan
- 5.3.3.3 India
- 5.3.3.4 Thailand
- 5.3.3.5 Singapore
- 5.3.3.6 South Korea
- 5.3.3.7 Australia
- 5.3.3.8 New Zealand
- 5.3.3.9 Rest of Asia Pacific
- 5.3.4 South America
- 5.3.4.1 Brazil
- 5.3.4.2 Argentina
- 5.3.4.3 Colombia
- 5.3.4.4 Chile
- 5.3.4.5 Peru
- 5.3.4.6 Rest of South America
- 5.3.5 Middle East and Africa
- 5.3.5.1 United Arab Emirates
- 5.3.5.2 Saudi Arabia
- 5.3.5.3 Qatar
- 5.3.5.4 Turkey
- 5.3.5.5 South Africa
- 5.3.5.6 Nigeria
- 5.3.5.7 Egypt
- 5.3.5.8 Morocco
- 5.3.5.9 Rest of Middle East and Africa
- 5.3.1 North America
6 COMPETITIVE LANDSCAPE
- 6.1 Market Concentration
- 6.2 Strategic Moves
- 6.3 Market Ranking Analysis
- 6.4 Company Profiles
- 6.4.1 Archer Daniels Midland Company
- 6.4.2 Cargill Incorporated
- 6.4.3 Jungbunzlauer Suisse AG
- 6.4.4 Weifang Ensign Industry Co. Ltd.
- 6.4.5 RZBC Group Co. Ltd.
- 6.4.6 Tate & Lyle PLC
- 6.4.7 COFCO Biochemical (Anhui) Co. Ltd.
- 6.4.8 Gadot Biochemical Industries Ltd.
- 6.4.9 Citrique Belge N.V.
- 6.4.10 Huangshi Xinghua Biochemical Co. Ltd.
- 6.4.11 TTCA Co. Ltd.
- 6.4.12 Jiangsu Guoxin Union Energy Co. Ltd.
- 6.4.13 Laiwu Taihe Biochemistry Co. Ltd.
- 6.4.14 BBCA Group
- 6.4.15 Pfizer Inc.
- 6.4.16 Kenko Corporation
- 6.4.17 Natural Biological Group
- 6.4.18 S.A. Citrique Belge N.V.
- 6.4.19 Shandong Ensign Industry Co., Ltd.
- 6.4.20 Foodchem International Corporation
7 MARKET OPPORTUNITIES AND FUTURE OUTLOOK

 全球聚氨基酸聚合物市場規模、佔有率、趨勢和成長分析報告(2026-2034)
 2026-2030年全球檸檬酸市場
 伊康酸市場:2026-2032年全球市場預測(依等級、形態、生產流程、應用及通路分類)檸檬酸市場:2026-2032年全球市場預測(依產品種類、等級、形態、原料、應用及通路分類)
 聚氨基酸聚合物市場規模、佔有率和趨勢分析報告:按產品類型、應用、地區和細分市場預測(2026-2033 年)
 伊康酸市場規模、佔有率和成長分析:按應用、製造方法、等級、最終用途和地區分類-2026-2033年產業預測
 高純度檸檬酸:市佔率分析、產業趨勢與統計、成長預測(2026-2031)
 伊康酸市場:依衍生物、應用及地區分類
 檸檬酸市場報告:趨勢、預測及競爭分析(至2035年)
 檸檬酸市場報告:按應用、形態和地區分類(2026-2034 年)